Development of expert systems for the mitigation of nitrogen pollution at farm and regional scale
|
|
|
- Lenard Williamson
- 5 years ago
- Views:
Transcription

1 SCUOLA DI DOTTORATO TERRA, AMBIENTE E BIODIVERSITÀ Ph.D. in Agricultural Ecology XXV Cycle Development of expert systems for the mitigation of nitrogen pollution at farm and regional scale Ph.D. Thesis Lodovico Alfieri N R08696 Supervisor Prof. Marco Acutis Academic Year Coordinator Prof. Graziano Zocchi
2
3 Lodovico ALFIERI Development of expert systems for the mitigation of nitrogen pollution at farm and regional scale Ph. D. Thesis Department of Agricultural and Environmental Science University of Milan Via Celoria 2, Milan Italy Titolo in Italiano: Sviluppo di sistemi esperti per la mitigazione dell inquinamento di azoto a scala aziendale e regionale Tesi di Dottorato in Ecologia Agraria XXV Ciclo, Anno Accademico
4 .
5 Ph.D. in Agricultural Ecology - XXV Cycle Lodovico Alfieri Alfieri, L., Development of expert systems for the mitigation of nitrogen pollution at farm and regional scale Italy. Ph.D. Thesis, University of Milano, 99 pp, 19 figures, 14 tables, 105 references. Intensive agriculture and concentration of livestock activities represent critical factors in the environment, particularly in Lombardia region where nitrate vulnerable zones constitute 62% of Utilized Agricultural Area (UAA). In addition, the aquifer Po valley aquifer is one of the largest in Europe, for which it is estimated that over two-thirds of the nitrogen that reaches the surface and the subsoil is of agricultural origin. The problem of reduction of nitrogen losses into the environment, as leaching of nitrates into groundwater and ammonia emissions into atmosphere, can be only addressed through a critical and scientific analysis of manure entire production chain. As a consequence, the opportunity to develop software tools to analyze the current situation and the effects of possible scenarios arising from different regional policies relating to the release of nitrogen from agricultural sources. A decision support system (DSS) has been developed, to run simulation both at farm and territorial scale. The farm simulator is aimed at farmers and allows to analyze the management and technological alternatives available for the entire supply chain from animal feed to the distribution in the field for maximum utilization of the livestock waste. It is a free software downloaded from the website of the Lombardia Region, which collects the data of the structure and management of farm in the regional database; the speed of execution and the interface easily understandable make it "user friendly". The territorial simulator, available to
6 regional authorities, works on a regional scale it is completely resident on the web and allows the evaluation of the impact of any regulatory measures and incentives simulated from the agronomic, environmental and economic point of view. Below, has been analyzed the regional database and have been drawn up reference tables, were also collected, reviewed and made consistent models already existing and validated for the various phases of manure production. Were then assessed and defined the agronomic, plant and economic alternatives. The basic unit of simulation is made by the single cadastral parcel; in case of a territorial scale simulation model is applied to all the parcels of the sample selected. The DSS provides data both in detail and in the form of synthetic indicators. In the first months of activity the DSS at farm scale, introduced in November 2011, has been used by 200 users of which around 65% are professional agronomists and farmers of large companies; therefore it represents an important opportunity for the Lombardia agriculture to combine environmental protection with economic and technical sustainability. Courses: Elements of statistics. Instrumental analysis. Biogeochemical cycles. Credits evaluation Attendance at international/national congress: 13 th Italian Association of Agrometeorology Congress: Agrometeorologia nella gestione integrata dei sistemi agro-forestali dell ambiente June 2012, Bari, Italy. Oral presentation at technical workshop: Presentazione Sistema Esperto Valore. Regione Lombardia, 11 November Deroga Nitrati. Regione Lombardia Brescia, 15 December Deroga Nitrati. Regione Lombardia Mantova, 11 Junuary Deroga Nitrati. Regione Lombardia Milano, 26 Junuary 2012
7 Sistema Esperto Valore alcune applicazioni. Regione Lombardia Bergamo, 30 Junuary Agricoltura Conservativa. Coldiretti Monza, 7 March 2012 Agricoltura Conservativa. Condifesa Brescia, 19 November 2012 Teaching activities: Training courses (16 hours) on ValorE software held by Ordine degli Agronomi di Milano. Practical lessons in Agricultural Ecology. Poster presentation at international/national congress: Giussani A., Alfieri, L., Provolo, G., Acutis, M. ValorE Sistemi Esperti per la valorizzazione degli effluenti di allevamento, la salvaguardia ambientale e la tutela del territorio delle Lombardia. Proceedings of XLI Congress of the Italian Society for Agronomy, Bari,, September 2012,
8 Supervisor: Prof. Marco ACUTIS Coordinator: Prof. Graziano ZOCCHI
9 I wish to thank Prof. Marco Acutis for valuable professional assistance. I am deeply grateful to Dr. M. Fumagalli and Dr. A. Giussani for the whole help.
10
11 CONTENTS GENERAL INTRODUCTION WHICH SOLUTION FOR A BETTER LIVESTOCK MANURE MANAGEMENT IN LOMBARDIA REGION? OBJECTIVE AND ORGANIZATION OF THE RESEARCH SYNOPSIS NOTES VALORE: A DECISION SUPPORT SYSTEM TO ENHANCE LIVESTOCK MANURE MANAGEMENT INTRODUCTION DATABASES AND REFERENCE INFORMATION Farm structure Meteorological database Soil data Technical and agronomic management data SOFTWARE DEVELOPMENT Excretion module Manure storage and treatment module Agronomic module TASKS OF THE DSS Query task Alternative scenarios generator Indicators Multi-criteria analysis Model validation, updating procedures and stakeholders interaction APPLICATION OF VALORE IN LOMBARDIA REGION: CASE STUDIES AT FARM AND REGIONAL SCALE INTRODUCTION APPLICATION OF VALORE AT FARM SCALE Selection of the farms Examples of alternative management options APPLICATION OF VALORE AT REGIONAL SCALE Examples of databases interrogation GENERAL DISCUSSION
12 5.1 CHARACTERISTICS OF THE VALORE DSS APPLICATION OF THE VALORE DSS FUTURE RESEARCH REFERENCES
13
14
15 GENERAL INTRODUCTION Chapter 1
16 GENERAL INTRODUCTION 1.1 Which solution for a better livestock manure management in Lombardia region? Livestock production determines serious environmental problems such as greenhouse gas (GHG) emissions, agricultural land use as grazing and feed production (Steinfeld et al., 2006) and emissions of reactive nitrogen (N) in atmosphere (Menzi et al., 2010) and water. These problems are getting much importance due to the stringent environmental targets required by the agricultural policies and regulations for preventing pollution of land, air and water. The plain area of the Lombardia region (northern Italy) is characterised by an intensively managed agriculture with high livestock density and elevated use of production factors. Lombardia region accounts for a big part of the Italian livestock: in particular more than 27% of cattle and 45% of pigs. Animal manure is a source of valuable plant nutrients and renewable energy but also a potential problem for the environment and human health. In fact the Po Basin Water Board stated that more than two third of the N that reach the surface and the sub-surface water of the basin is determined by the livestock activities (AdBaPO, 2001). Sixty-two percent of the area is defined as vulnerable to nitrates (Regione Lombardia, 2006) that mainly included the areas with the highest organic N loads (Figure 1.1). Moreover the Po Valley is one of the major ammonia (NH 4 +) emitting regions of Europe, where the manure management causes high NH 4 + volatilisation, reducing its agronomic value and becoming a potential cause of environmental concerns: in fact the agricultural sector account for almost 97% of the regional emission of NH 4 + (Inemar, 2007). 16
 and (2012) highlighted the high use of production factors such as nitrogen, fossil energy and plant protection products to sustain animal and crop productions. Perego et al.")
17 Chapter 1 Recent studies have confirmed the potential impacts of the regional agricultural activities. Fumagalli et al. (2011) and (2012) highlighted the high use of production factors such as nitrogen, fossil energy and plant protection products to sustain animal and crop productions. Perego et al. (2012) reported how the intensive maize-based cropping systems based on the use of organic and inorganic fertilisers determine high risk of nitrate pollution as well as Carozzi et al. (2013a, b) showed how alternative low-ammonia emission techniques have to be prescribed during manure distribution on fields. However, nowadays is needed a whole farm perspective to deal with the environmental concerns due to livestock activities. The approach has to consider the strong links among feeding, housing, treatment processes, storage conditions and filed application practices along the manure management chain because it affects the soil, air and water quality, the crops growth and consequently the farm income. The selection of livestock manure management 17
18 GENERAL INTRODUCTION options is becoming a strategically important task that farmers and public policy makers have to face. As presented by Karmakar et al. (2010) several options of the manure collection, storage and land application are available. Yet, as discussed by Petersen et al. (2007) a variety of manure treatments with a specific target have been developed as well as improvements of the animal nutrition to control manure production and composition have been studied. Because of this, is necessary a support tool that could facilitate stakeholders and farmers on identification, evaluation, and selection of the suitable manure management option for a specific area and aim before investing money. In fact, each management has its advantages and disadvantages when considering environmental, agronomic, technical, energetic, cost and labour issues (Fumagalli et al., 2012). A decision support system (DSS) is an interactive computer-based system or subsystem intended to help decision makers use communication technologies, data, documents, knowledge and/or models to identify and solve problems, complete decision process tasks with the overall objective of making wellinformed decisions (Power, 1997). Several examples of development and application of DSSs in agriculture addressing a variety of domains, such as pest management (Perini and Susi, 2004), water management (Giupponi et al., 2005; Pallottino et al., 2005; Giupponi, 2007, Acutis, 2010) and nutrient management (Djodjic et al., 2002; Forsman et al., 2003; De et al., 2004), are available. DSSs specifically related to manure management are also available but as stated by Karmakar et al. (2007) most of them were developed with a focus on the nutrient management (De et al., 2004, De and Bezuglov, 2007). Only few DSSs consider the whole-farm manure management from the production to the land application providing support towards the choice of the suitable option. For example Karmakar et al. (2010) developed a specific DSS for swine farms of the Canadian Praires region: multiple combinations of management options can be evaluated considering different decision criteria such as environmental, 18
19 Chapter 1 agronomic, social and health, greenhouse gas emission, and economic factors. Even if the software MLCONE4 (Ogilvie et al., 2000) allows to evaluate alternative manure-handling systems of a greater number of livestock types (i.e. swine, dairy and poultry), it was specifically designed for Ontario Province s conditions. The awareness of the environmental problem, of the requirement of the whole farm approach, and of the availability of tools to support decision making, led the Lombardia Regional Authority to fund the development of a DSS able to provide to stakeholders, such as policy makers, farmers and their consultants an assessment tool to evaluate different livestock manure management systems. The tool application under contrasting scenarios could allow for the identification of the best management which could be characterized by available techniques and technologies [Kropff et al., 2001; Ceplecha et al., 2004; Goodall et al., 2010]. An integrated decision support system is presented to be used for livestock farms in the Lombardia region (northern Italy) in order to address all the major components of manure management (production, collection, storage, treatment and land application) for a variety of livestock types. It was developed on the basis of the previous experience carried out in Provolo et al. (2005) to evaluate livestock manure management. The proposed system allows to conduct an integrated assessment at farm and territorial scale under a decision-making process. The DSS permits to know the current situation in terms of farm management systems being integrated with a regional database and to finally suggest management decisions. Several manure management options are available as well as the possibility to make changes at cropping system level. Stakeholders can evaluate management options through the results of a wide set of multidisciplinary indicators and visualise their spatial affects thanks to a coupled geographical information system (GIS). 19
20 GENERAL INTRODUCTION 1.2 Objective and organization of the research The objective of the present work is to present a DSS named ValorE which helps stakeholders (i) to find the best option in order to minimise the risk of environmental pollution (mainly from nitrogen), (ii) to valorise the organic manure from different livestock types in environmental, technical, agronomic and economic terms, (iii) to plan the building of new plants for the manure treatment, (iv) to evaluate the effects of new technologies and to check, ante factum, the possible effects of new policies. The work carried out with the collaboration of different experts to manage all the major components of manure management (production, collection, storage, treatment and land application) in a multidisciplinary and integrated approach, can be summarized in the following phases: 1. Creation of the knowledge base of the DSS: acquisition and analysis of the regional databases about (i) farm structure, (ii) meteorology, and (iii) pedological information and development a specific database containing default data derived from existing literature and farmers interviews about technical and agronomic management. 2. Definition and development of the modelling: for each component of manure management a specific model was developed. Then it was assembled the software that consists of different modular components relating a specific stage of the manure production process following the objectoriented programming (OOP) paradigm. The input data and the parameters of the model not included in the databases were obtained from literature. 3. Definition of indicators: to evaluate the actual and alternative management from a technical, agronomic, environmental, energetic, economic multi-functional and normative point of views a wide set of indicators 20
21 Chapter 1 was selected. different alternative scenarios both at farm and territorial scale 4. Definition of management options: through intensive interactions among scientists a wide set of management options related to manure collection systems, manure treatments, storage facilities and manure land application as well as modifications at cropping system level were discussed and defined. Such recommendations for the users are useful to build a specific scenario both at farm and territorial scale. 5. Improvement of DSS: to get a better usability of the software, different aspects were carefully strengthened: o user-friendly interface: an easy management of the simulations at farm and territorial scale is guaranteed for all types of users (Figure. 1.2); o territorial simulation: the simulator is based on a WebGis interface; o farm simulation: the farm simulator can be installed and run on any computer no matter if internet connection is available; o data loading: the input data from databases are loaded in a short time (few seconds for each farm); o time of execution: the results of simulations are immediately available(few seconds for each farm); o normative compliance of the farms: possibility to check the respect of the limit values provided by regulations; o debug activities through intensive interactions with stakeholders. 21
 introduces the Valore DSS both as main software architecture and characteristics and main")
22 GENERAL INTRODUCTION 1.3 Synopsis Chapter 2 (ValorE: a decision support system to enhance livestock manure management) introduces the Valore DSS both as main software architecture and characteristics and main functionalities. Chapter 3 (Application of ValorE DSS in Lombardia region: case studia at farm and regional scale) contains a detailed examples of application of ValorE in the Lombardia region (northern Italy between N and N and 8 40 E and E). Different management options at farm and territorial scale are described and the results are discussed. 22
23 Chapter 1 Chapter 5 (General discussions) synthesises the results from the ValorE application. It focuses on the characteristics (novelty, advantages and limitations) of the proposed study and suggests the road for future researches. 1.4 Notes All the maps exported from the software are in Italian language since it was not performed an English version. 23
24
25 Chapter 2 VALORE: A DECISION SUPPORT SYSTEM TO ENHANCE LIVESTOCK MANURE MANAGEMENT
26 DSS VALORE FOR MANURE MANAGEMENT 2.1 Introduction ValorE is a user-friendly computer program developed to face with the livestock manure management that is becoming crucial in our region due to the strict environmental regulations. The DSS developed consists of three main parts: data management subsystem, model management subsystem and a userinterface. A simple representation of the DSS structure is reported in Figure 2.1. Different external databases provide the relevant information to DSS while a software package developed in the.net environment and implemented using object oriented and component paradigm (Donatelli and Rizzoli, 2008; Donatelli et al., 2012) through the C # language, includes several linked models to simulate livestock manure management at farm scale, from the production by the herd to the land application. Two different types of a user-friendly interface allow to manage the simulation at farm and territorial scale. A linked GIS handles spatially distributed inputs and outputs of the DSS. 26
27 Chapter 2 27
28 DSS VALORE FOR MANURE MANAGEMENT 2.2 Databases and reference information All the information to run the system is stored on available and wide databases, which are provided by Lombardia Government. Such regional data regard (i) farm structure, (ii) meteorology, and (iii) pedological information. Another database contains several tables of default data called thereafter reference tables Farm structure The database of the Agricultural Informative System of Lombardia Region (SIARL) contains a number of tables that are related to farms structure of the entire region. All the information is annually updated by farmers. In particular, farmers have to give details about the regulatory compliance on the matter of N management (Provolo, 2005). The database includes information on distribution of the animal herd in different age categories, animals housing, manure and slurry storage and treatment. Moreover, land use data of every cadastral plot are stored for each farm. Such information is fundamental for identifying the area allocated to the different crops over the years Meteorological database The Lombardy Region has made available a twenty-year time series of daily meteorological data such as maximum and minimum temperature ( C) and precipitation (mm). The provided data were measured at 14 monitoring stations from 1989 to 2008, but measures are still undergoing (Figure 2.2). 28

29 Chapter 2 However, only 9 stations provide measured data of solar radiation for the period (Table 2.1). The data reliability was firstly tested, and then the global radiation was estimated for all the 14 stations by using the model proposed by Bristow and Campbell [1994]. The model was first calibrated on the basis of 4 sites/20 years where global radiation was measured. In detail the procedure used was the follow: Analysis of data reliability: for the stations where radiation data were available it was first check the number of missing data (Table 2.1). 29


30 DSS VALORE FOR MANURE MANAGEMENT Further data elaboration: considering that theoretically the clear sky transmissivity, is almost in a sunny summer day we found values of transmissivity not accurate for central period of the year. Then for each station was counted the number of data over 0.70 and averaged the five highest atmospheric transmissivities between day of year 120 and day of year 240. Among the 9 stations were finally selected 5 stations characterized by the highest number of transmissivity data over 0.70 and by the mean of the five greatest transmissivity data over 0.71 (Table 2.2) for the calibration and validation of the models (Bechini et al., 2000) of solar radiation (Hargreaves, Bristow-Campbell and Donatelli-Campbell) and to choose the best one. Values of clear sky transmissivity over 0.85 were not never detected. 30
.")

31 Chapter 2 Calibration of the models: the calibration of the parameters of each model was done for the year 2004 on trimonthly basis using the nonlinear regression method of SPSS (first quarter: January-March; second quarter: April-June; third quarter: July-September; fourth quarter: October- December). The model proposed by Hargreaves and Samani (1982)estimate the daily actual radiation (Rad i): where RadP i as daily extraterrestrial radiation and Kr as empirical parameter calibrated by using measured data. In Bristow-Campbell and Donatelli- Campbell the daily actual radiation is obtained by multiplying daily extraterrestrial radiation for a given day and latitude by the atmospheric transmissivity tt i. Bristow-Campbell (Bristow e Campbell, 1984) model estimates the actual atmospheric transmissivity (tt i) using the clear sky transmissivity (τ) and daily maximum (Tmax i) and minimum (Tmin i) temperatures: 31
 estimates the actual atmospheric transmissivity(tt i) for the ith day of the year as a function of clear sky transmissivity (τ) and daily maximum")
32 DSS VALORE FOR MANURE MANAGEMENT where ΔT i = Tmax i (Tmax i + Tmin i+1) and ΔT m as average monthly temperatures and B and c are empirical parameters calibrated using measured data. The model proposed by Donatelli and Campbell (1998) estimates the actual atmospheric transmissivity(tt i) for the ith day of the year as a function of clear sky transmissivity (τ) and daily maximum (Tmax i) and minimum (Tmin i) temperatures: where Tavg = ½(Tmax i + Tmin i) and ΔT i = Tmax i (Tmax i + Tmin i+1). The functions f(tavg) = exp(exp( x Tavg)) and f(tmin i ) = exp(tmin i /Tnc) are empirical, whereas b and Tnc are two locationspecific parameters, which are calibrated by using measured data. The estimates of the parameters are reported in Table


33 Chapter 2 Validation of the models: the validation was performed using data of three-year period ( ) and the parameters previously selected. The simulated radiation was compared with that measured. Model evaluation: the results of statistical indexes (Table 2.4) used to evaluate the models performances indicate the Bristow Campbell model as the best one. Always for all the stations and for the six indices used in this evaluation, Bristow-Campell over performed respect to the other methods Use of the metereological information: a spatial interpolation was performed on the basis of the measured data to extend the meteorological information throughout the entire plain of the region by employing Thiessen polygon method. 33
34 DSS VALORE FOR MANURE MANAGEMENT Soil data A digital soil map at scale 1:50000 is available, where 1038 soilscapes are defined and characterized by at least one soil profile. Soil physical and chemical properties, such as texture, structure, organic matter, ph, soil cation exchange capacity, derived from field and laboratory analysis are available for each horizon of the soil profiles down to 1.5 m depth. The soils are classified according to the WRB classification [FAO, 1998]. Soil data have been successively elaborated to manage the simulation within the agronomic module. To limit the number of simulation of the cropping system model and at the same time to maintain a clear representation of the results, all the regional soil types have been grouped. A cluster analysis using the TWOSTEP CLUSTER procedure of SPSS which allows to use both qualitative and quantitative variables was carried out to identify homogeneous groups of soils. Also the number of groups is automatically determined by the procedure, using a index derived from the Akaike one (Akaike, 1974). The variables used for cluster analysis were considered for two layers (0-40 and cm depth): D50 (mm): median particle diameter; Skeleton (%); Organic carbon content (%); saturated hydraulic conductivity (mm/h) estimated with Hypress (Wosten et a., 1998) The characteristics of the three groups of soil individuated are presented in Table


35 Chapter 2 35
36 DSS VALORE FOR MANURE MANAGEMENT Technical and agronomic management data Only a part of the information needed to run the DSS is directly available from the SIARL database, so that another database containing five reference tables of default data was filled. Default data derived from existing literature and farmers interviews are: - techniques, functional and economic features of the available technologies used for the manure treatment; - animals ration in terms of protein content on the basis of data reported by the Italian Breeders Association (AIA, 2010); - prevalent crops of the regional arable land and related agronomic management such as sowing and harvest time, organic and mineral N supply (Regione Lombardia, 2010); - irrigation techniques, frequency and water volume typical of the different area of the region; - the current regulation on the matter of (i) NVZs definition, (ii) allowed timing of manure application, (iii) restriction of manure fertilization in particular areas such as riparian zones, protected areas, (iv) prescription for manure incorporation [Regione Lombardia, 2007] 2.3 Software development The software has to meet a series of requirements in order to be helpful to stakeholders and easy to be updated. The main are both to be web based and installed and run on any computer avoiding specific hardware requirement, to be very simple to use (no more than 5 clicks to get to a complete analysis in agreement with the three click rule for user friendly and more impactful web disegn) and finally, to report simulation results both in maps and tabular form. The intended purpose of the software is to simulate at farm scale each stage of livestock excreta cycle from excretion by the herd to the crop N uptake as well as the N cycle and losses occurring via leaching, and gaseous emission 36
 purchased animals, fertilizer, feed and bedding materials, and (ii) sold animals, milk, crops and fertilizer are not shown.")
37 Chapter 2 (volatilization and denitrification). Figure 2.3 shows the simulated N flows at farm level: flows related to (i) purchased animals, fertilizer, feed and bedding materials, and (ii) sold animals, milk, crops and fertilizer are not shown. The software consists of different modular components relating a specific stage of the manure production process and developed following the object-oriented programming (OOP) paradigm proposed by (Donatelli and Rizzoli, 2008; Donatelli et al., 2012). Each component allows for selection of strategies to simulate a specific process and each module results represent the input data the subsequent one (Figure 2.4). The farm represents the simulation unit and the aggregation of farms allows the assessment of the potential risk for the environment at territorial scale under a specific scenario. In order to carry out such territorial analysis, a WebGis application was developed to elaborate a tabular and map based summary, at different aggregation scale (e.g. farm, hydrologic basin, municipality, county, region, NVZs, etc). 37

38 DSS VALORE FOR MANURE MANAGEMENT The software allows for different application under actual and alternative scenarios, taking into account eventual update of new technologies, crops or agricultural practices and future scenarios of meteorological data. Different scenarios can be evaluated and compared by synthetic indexes which take into account environmental, economic, technical, multifunctional and normative aspects. 38
39 Chapter Excretion module In order to evaluate the impact of the different livestock rations on urine and faeces excreted by cattle and swine the dynamic of N and P content was simulated as a function of feed intake. In the analysis, the dairy cattle, beef and pigs breeding were considered as the main source of production of slurry in the Lombardia. With regard to cattle, the model allows to estimate separately for urine and faeces the amount of N and P excreted by quantifying first the amount of manure. For dairy cattle, the excretion is computed by a sub-model from the following input variables: (i) the body weight of lactating dairy cows, dry cows, heifers and calves (ii) the milk production level, (iii) milk fat and protein content, (iv) the dry matter intake, (v) and the protein content of feed. In particular, the dry matter intake is calculated by using the equation proposed by the National Research Council of USA (2001). The model produces the following outputs data: (i) the excreted products as fresh matter (kg FM d -1 ), calculated according to Nennich et al. (2005), (ii) urine and its N content (kg d - 1), calculated according to Fox et al. (2004), (iii) the amount of faeces, calculated as difference between the total excreted products and urine (kg d -1 ), (iv) the N faeces content, computed as difference between N intake and urine and, v) the milk N content (kg d -1 ). The model developed for the pigs simulation estimates the excreted amount of N, P and K according to van Milgen et al., 2003; Le Bellego at al., 2001; Pomar et al., 1991a; Pomar et al., 1991b; Pomar et al., 1991c. Such amounts are divided in solid and liquid fraction as a function of the body weight, the daily rate of body weight increase (kg d -1 ), the feed, protein and P intake (kg d -1 ), the protein and P digestibility (%) and the feed-to-grain conversion index. For other animal species such as, poultry, sheep, goats and horses, the excretion was estimated as a fixed percentage of live weight, as recommended by existing legislation (Regione Lombardia D.g.r. November 21 st 2007 n. 5868). 39
40 DSS VALORE FOR MANURE MANAGEMENT Manure storage and treatment module Slurry is subjected to chemical and physical modification with relative gaseous losses to the atmosphere. For each stage of the storage and treatment process the slurry module simulates the amount of slurry mass and its N and P content. Moreover, it allows for the assessment of the feasibility of alternative techniques in plant management. The input data of the slurry storage and treatment module are: (i) chemical and physical composition of the excreted products expressed as (kg DM (Dry matter), kg FM, faeces TKN (Total Kjeldhal nitrogen) content, urine TKN and P 2O 5 content in faeces and urine), (ii) the litter fraction of the manure, and (iii) the rainfall. The effect of the typology of livestock housing is simulated according to Fulhage and Pfost, (1993), Kroodsma et al.(1993) and Ogink and Kroodsma, (1996). The effect of different types of slurry storage is simulated according to Amon et al. (2006), Espagnol et al. (2008), Ni et al., (2009) and Vanderzaag et al. (2009). Both conventional and non- conventional treatments are considered in the module: solid-liquid separation [Christenesen et al., 2009; Hjorth et al., 2009; Jørgensen and Jensen, 2009; Dinuccio, et al., 2008; Fangueiro et al., 2008a; Fangueiro et al., 2008b; Sørensen and Møller, 2006], anaerobic digestion with biogas and energy production [Amon et al., 2007; Biswas et al 2007; Lubken et al., 2007; Karim et al., 2005], ammonia stripping [Lei at al., 2007; Bonmatì and Flotats, 2003], nitrification and denitrification [Castrillon et al., 2009; Rousseau et al., 2008; Waki et al., 2007; Obaja et al., 2003], aerobic stabilization [Beline et al., 2007; Loyon et al., 2006] and composting [Fukumoto and Inubushi 2009; Szanto et al., 2007; Paillat et al., 2005]. The slurry module calculates: (i) the final volume of the stored slurry, (ii) the final chemical and physical composition, (iii) the solid and liquid fraction, (iv) gaseous losses to the atmosphere, and (v) the eventual production of biogas for the anaerobic digestion plants. 40
41 Chapter Agronomic module The agronomic module is based on the crop simulation model, ARMOSA (Acutis et al., 2007). However, due to the long computational times required the efficacy of process-based models in a large scale is questionable. Therefore, we used a meta-model that can provide almost the same results as the original model at a lower computational cost The cropping systems simulation model ARMOSA ARMOSA model simulates crop growth, water and nitrogen dynamics in arable land, under different climatic conditions, crops and management practices. It is a simulation model specifically developed on the basis of field data and implements approaches largely validated in the scientific literature and used for practical application. Crop growth model development was based on SUCROS WOFOST (a photosynthesis-based model from Wageningen school, used, among others application, at European scale for the Bulletin of yield prediction for wheat, maize and other important crops (Supit et al., 1994; van Ittersum et l., 2003). Water dynamics can be simulated using the cascading approach, or the Richards equation, solved as in the SWAP model (Van Dam et al., 1997; Van Dam and Feddes, 2000). The SWAP appeared to be the best performing one with very detailed soil moisture data set in 6 typical soils in Lombardia (Bonfante et al.; 2010, Perego et al., 2012). Nitrogen dynamics is simulated according to the SOILN approach (Johnsson et al., 1987; Eckersten et al., 1996), but with some improvements. In SOILN only three pools of organic and mineral nitrogen are simulated: humus, litter, manure, while in ARMOSA each type of organic matter has been differentiated with reference to mineralisation rates, respiration losses and C/N ratio, allowing for separate calculations for the different types of organic fertilisers or crop residuals incorporated into the soil. Depth of incorporation is also taken in account. As in SOILN, NH 4 + and NO 3 - pools are considered; NH 4 + pool can be up taken 41
42 DSS VALORE FOR MANURE MANAGEMENT by plants, oxidised to NO 3 -, fixed by the clay component of the soil, and immobilised in the organic matter; losses due to ammonia volatilisation are also simulated. NO 3 - pool is subject to plant uptake, leaching and denitrification. Several options to use for medium-long time simulation are included: it is possible to define sowing and harvest DOY (day of the year), crop rotation, automatic irrigation, set of fertilization. Another improvement respect to SOILN model deals with plant nitrogen uptake; in SOILN this process is based just on the amount of transpiration mass flow of NH 4 + and NO 3 -, whereas in ARMOSA crop uptake is also calculated on the basis of minimum, critical and maximum N dilution curve. Soil temperature is also simulated, according to the Campbell (1985) approach. ARMOSA model was calibrated and validated using a large dataset consisting of 3500 SWC daily data of soil profile from 0.8 to 1.3 m depth (Bonfante et al. 2010), soil solution N concentrations, N leaching and crop growth and N uptake data (Perego et al., 2012) The agronomic meta-model The need to operate on a territorial scale involves the use of the meta-model, once developed on the basis of the ARMOSA model. Such procedure represents an easy approach, quick in generating results of N losses and crop yields under different cropping systems, management and pedo-climatic conditions. The meta-model was developed on the basis of the examples provided by the literature (Forsman et la., 2003; Gandolfi et al., 2010). It was performed starting from the results of simulation under different scenarios of cropping systems in Lombardia. In particular, the agricultural management was defined in function of the farm type and the pedoclimatic conditions of the region. The different pedological conditions, for example, resulted by using a cluster analysis previously described (paragraph 2.3.4) as function of D50 value, stone and organic carbon content along soil profile of 2 m depth. The meta-model development started with the sensitivity analysis 42
43 Chapter 2 (Morris, 1991; Saltelli et al., 2005) of the input variables on the ARMOSA output in order to finally reduce the input data. The input meta-model are: crop yield (t ha -1 ), N leaching (kg ha -1 year -1 ), crop N uptake and removal (kg ha -1 year -1 ), drainage (mm year -1 ), N mineralization (kg ha -1 year -1 ), ammonia N volatilization (kg ha -1 year -1 ), denitrification (kg ha -1 year -1 ), soil N fixation (kg ha -1 year -1 ). For different crops, such as silage and grain maize (Zea mayze L.), winter wheat (Triticum aestivum L.), alfalfa (Medicago sativa L.), permanent meadow, foxtail millet (Setaria italica L.), and Italian ryegrass (Lolium multiflorum L.), a multiple linear regression was calculated by applying the stepwise method in order to identify the significant factors in determining N leaching, volatilization, crop N uptake, and crop yield, with average R 2 of The meta-model input and output variables are reported in Figure


44 DSS VALORE FOR MANURE MANAGEMENT 2.4 Tasks of the DSS The ValorE DSS allows to evaluate the effects of the livestock manure management at farm scale and the possible consequences in the spatial domain. First, its offers a possibility to know the current perspective in terms of manure management system and related aspects at farm or territorial scale by interrogating the available databases through a query function. Then it is possible to enhance the N management generating different alternative scenarios both at farm and territorial scale, thanks to an extensive choice of management options. Changes can be focused on manure management system and on cropping system characteristics. Actual and alternative scenario 44
45 Chapter 2 sustainability can be evaluated and compared by using indicators. Moreover a specific tool of the DSS makes possible to investigate the effect of policy measures Query task The software offers a possibility to get an instrument for an easy interrogation of the regional databases. Both predefined and free queries can be done and the results are available in exportable reports (Excel or PDF format). The query system is based on a WebGis interface, to help the users to obtain aggregated information for specific geographic areas (e.g. whole region, provinces, municipality, farms etc..). Thus, it makes possible to obtain a general perspective of the farming systems characteristics including the potential and critical environmental issues related to the manure management. The query procedure involves, first, the selection of the aggregation level to finally present the results (i.e. farm, municipality and provinces) and, second, the selection of the geographic area of interest (e.g. one or more municipality). Both free and predefined queries are related to several domains: animals herd, animal housing, manure storage, manure treatments, cropping systems, economical and mechanization aspects, policies aspects (e.g. normative compliance of slurry storages) and pedo-climatic characteristics. The predefined query option provides a set of about 40 queries previously selected as relevant by a group of experts and stockholders: in this case the user has the possibility to change the parameterization of the query itself (e.g. selection criteria of several queries could be farm area, the number of the livestock units, the typology of housing, the soil type etc.). A free query can be written using a query generator developed ad hoc to simplify the access to the database, or directly using SQL. An example of free query is reported in figure

46 DSS VALORE FOR MANURE MANAGEMENT Alternative scenarios generator The user can quickly generate many different alternative scenarios by choosing options related to manure collection systems, manure treatments, storage facilities and manure land application methods. Moreover to enhance the manure and relative N management changes at cropping system level can be done. As example a list of the available solutions in term of livestock manure treatment with their specific objective is reported in Table 2.6 for each manure type. To simplify the choice of the users each alternative is detailed through a flow chart as reported in Figure


47 Chapter 2 47

48 DSS VALORE FOR MANURE MANAGEMENT The farm simulator allows to create management options at farm scale by modifying several inputs, such as i) number of LSU, protein content in animal ration and the daily weight increase rate (kg d -1 ), ii) livestock housing (e.g. straw based or slurry based tying stalls), iii) manure treatment (solid-liquid separation, anaerobic digestion with biogas and energy production, ammonia stripping, nitro-denitro process, aerobic stabilization and composting), iv) manure storage features (i.e storage and covering types), v) type and timing of manure application on the basis of calculated fertilisation plan, vi) cropping systems (e.g. changes in the crops rotation by introducing new crops and cover crops and vii) fertiliser management scheme. An example of alternative scenario in which a combination of 5 alternative managements is adopted in order to improve N management at farm scale is shown in Figure 2.8. Through the webgis interface new scenarios at territorial scale can be generated by introducing alternative agricultural management in a selected sample of farms. The range of options available for the users is not wide as at farm scale. The territorial simulator allows to define alternative management only related to four domains such as animal housing, manure treatment, storage facilities and cropping systems. In the case of cropping system and manure treatment domains the users can select directly the management options. For example, the method of manure distribution or the introduction of a cover crop and several manure treatments types (e.g. the solid-liquid separation, the 48
49 Chapter 2 biogas production). On the opposite, in the case of animal housing and manure storage domains the DSS provides different management options on the basis of the final aim selected by the users, namely the reduction of manure amount excluding rainfall water or the reduction of ammonia emission (Fig. 2.9). However, the software controls ensure that adopted management is in agreement with current regulation and farm characteristics. For example a particular type of treatment requires a minimum volume of manure to be functional. Either the crude protein content of the animal diet has to be included in a default range of values. Scenarios evaluation at regional scale is obtained by aggregating farms sample results. In fact, the software application at regional or municipality scale allows stakeholders to simulate the environmental impact of possible normative intervention and technical innovations as for example the implementation of plants cooperative for slurry storage and/or treatments (e.g. biogas production, solid/liquid separation and composting) that could be used by different farms of the same area. 49

50 DSS VALORE FOR MANURE MANAGEMENT Indicators The evaluation of actual and alternative scenarios and their comparison is computed with the software through the calculation of a wide set of indicators. They are a synthetic representation of the implications on technical, agronomic, environmental, energetic, and economic aspects due to the adoption of a particular management. The major part of indicators are quantitative, however, some of them, are expressed with a qualitative scale as bad, fair, good, excellent. The complete list of indicators is reported in Table
, which estimates cropping systems impact on biodiversity and landscape in terms of crops allocation and field size, (iii) the soil surface N balance")
51 Chapter 2 Several indicators are related to agro-environmental aspects such as (i) CO 2, CH 4, NH 4 +, N 2O gaseous emissions to atmosphere, (ii) the crop prevalence at farm or regional scale (Crop Diversity Indicator, CDI, Bockstaller, 2000), which estimates cropping systems impact on biodiversity and landscape in terms of crops allocation and field size, (iii) the soil surface N balance (Oenema et al., 2003) that compares the difference between ingoing and outgoing N fluxes through the soil surface N balance indicating the potential N surplus at field scale and, (iv) the agricultural nitrate hazard index (IPNOA, Padovani and 51
52 DSS VALORE FOR MANURE MANAGEMENT Trevisan 2002, Capri et al., 2009) which summarizes the results of N supply, soil nitrogen content, meteorological condition, agricultural practices and irrigation adopted. Multi-functional, normative, and technical indicators, such as power required and energetic consumption of slurry treatments, assess the compliance of farm and/or region of mandatory standards related to nitrate leaching towards groundwater. Economic indicators show the benefit of the adoption of new management and technologies, at farm and regional scale. For the actual scenario, all indicators are already calculated for the entire regional area and stored in a database to reduce computational time in what-if analysis Multi-criteria analysis To identify the optimal or compromise solutions that take into account the farming system characteristics, the agronomical, social, environmental and economic objectives as well as the expectations of the stakeholders involved, a subsequent multi-criteria analysis has to be performed on the basis of weighted sum of a subset of the indicators. Relevant indicators and their weights can be obtained by expert elicitation. An on-going work is the implementation of a multi-criteria analysis module based on the Meacros software (Mazzetto et al., 2003). This software performs concordance analysis providing preference rankings for the alternatives based on computed indices and allowing sensitivity analysis of weighted values as well as displaying the results in the graphic form Model validation, updating procedures and stakeholders interaction The model validation step is an on-going procedure carried out by a group of potential users such as, agronomists and technicians of the Italian farmers 52
53 Chapter 2 organizations. Twenty farms have been identified as representative of the entire regional area by applying selection criteria (e.g. farm belonging the nitrate vulnerable area, minimum agricultural area equal to 35/40 ha, number of animals over 150 and 2000 for cattle and swine, respectively) to get real data through farmer s interviews. This let us to estimate the reliability of the model, to detect weaknesses of the system and to do a general improvement of the application usability. Databases are updated to acquire the latest reference data available for a state. The SIARL database is annually updated with the new information provided by the farmers as well as meteorological and soil databases could be refreshed if new information is available. The knowledge base could be modified with changes in regulations and/or new scientific achievements (e.g. parameters for crop modelling). Variations of the raw materials price such as energy, fertilisers and crop products are also taken into account. Following the indications provided by the literature that reports the importance of the participatory processes on DSS' success (Van Meensel et al., 2012) we are currently involving stakeholders that actively collaborate to test it on real cases, to debug and propose new software features and improvement. 53
54
55 Chapter 3 APPLICATION OF VALORE IN LOMBARDIA REGION: CASE STUDIES AT FARM AND REGIONAL SCALE
56 APPLICATION OF VALORE DSS 3.1 Introduction As described in the chapter 2 ValorE was developed to face with livestock (mainly cattle and swine) manure management that is becoming crucial in our regional agricultural domain due to the strict environmental regulations. Being a software that consists of different modular components each specific stage of the waste production process is simulated. It starts considering the manure production as a function of animal diet, to its final distribution on field and their productive and environmental consequences. The software allows simulation both at farm and territorial scale. The farm scale simulator lets to individuate the more sustainable farm management to reduce environmental impact (mainly nitrogen feature) and to valorise livestock manure. The territorial scale simulator allows, starting from the current state, to analyse the effects of the hypothetical implementation of alternative managements following a multidisciplinary approach. The actual farm configuration was labelled as actual scenario (ACT) while the hypothetical farm configuration is labelled as alternative scenario (ALT). In the present chapter are presented and discussed some examples of application of ValorE both at farm and regional scale. A variety of alternative management options are theoretically implemented and consequences on nitrogen management are highlighted. At farm scale are analysed two example of interventions and two scenarios in which a combination of alternative managements is adopted. At regional scale are first presented some examples of queries with which users can interrogate the database available, then alternative managements in a selected sample of farms are discussed. 56
57 Chapter Application of ValorE at farm scale Selection of the farms Each intended decision on farm management or structures requires a specific objective other than to know the potential implications on technical, agronomic, environmental, energetic, and economic aspects. To provide some examples of application of the tool at farm level four farms have been identified on the basis of technical and production characteristics and of pedoclimatic features. The farms represent four typologies of livestock farms such as dairy farm, beef cattle farm, swine farm and a mixed farm with dairy cows and pigs. All the farms belong to an intensively cultivated area of four different Provinces and their dimension is large enough to guarantee an interesting assessment. Moreover all the farms are located on nitrate vulnerable zone and the high amount of livestock manure produced do not allow to respect the limit of 170 kg per year/hectare of nitrogen from organic fertilisers. The selection of the characteristics of the farms was carried out using the query function. The simulation of the actual farm configuration was done using input data from the regional databases updated at 2011 and from reference information obtained from literature and regional regulations. The principal characteristics of the farms and the results of simulation about N flows highlighted as indicators mainly related to nitrogen managements are summarized in Table


58 APPLICATION OF VALORE DSS In all of the farms maize both for silage and grain is currently cultivated. The forage crops such as silage maize, meadows and alfalfa are cropped in the farm with dairy cows to sustain milk production. None of the farms had a manure treatment plant and two farms usually sold N outside. The software simulated for the actual scenario that ammonia volatilisation occurring along all the 58
59 Chapter 3 manure chain, ranged from 26% to 34 % of the total N excreted by herd. N leaching varied from 26% to 63 % of the N applied on field from mineral and organic fertilisers. All the farms were not in compliance with N limits: the N from organic fertilisers usually distributed per hectare on field was on average almost the double of that allowed. It ranged from 294 to 357 kg N ha -1, However storage limitations were quite always respected Examples of alternative management options Management option 1: reduction of the crude protein content of the animal diets Objective: to reduce the N content of the livestock manure. Description: for each animal category the default data of crude protein content of the diet were reduced. The chosen value is the minimum of the default range for which are not expected relevant variations in terms of meat and milk production. This is consistent with experimental findings: Olmos Colmenero and Broderick (2006) found that diets containing 16.5% of crude protein supported maximal production of dairy cows with minimal N excretion compared with diets with 19.4% of crude protein. Results and discussion: The results of the simulation are reported in Table 3.2. The alternative scenario involved limited effects on N distributed on field. Its reduction was by 5% in swine farm and by 12% in dairy farm but was not enough to be under the amount of 170 kg ha -1. However from an environmental point of view resulted a relevant reduction of ammonia volatilisation from stable and storage facilities. In dairy farm the reduction was by 22%. 59

60 APPLICATION OF VALORE DSS 60
61 Chapter Management option 2: covering of liquid manure stores Objective: to reduce ammonia emission during manure storage Description: Given that a relevant part of the ammonia emission occurred during manure storage the construction of a rigid cover represents the suitable way to get the final objective. For all of the stores available on farm it was simulated the cover. Results and discussion: The results of the simulation are reported in Table 3.3. The cover of the tanks involved a relevant reduction of the ammonia volatilization from 27% to 32% based on livestock type. This determined an increase of available N to apply on field from 10% to 14%. Then a more accurate nitrogen management during field practices to avoid ammonia volatilization and leaching is needed. From an economic point of view the direct construction costs are relevant. However, the reduction of the total manure volume (almost by 24% in beef cattle farm) because rainfall water has been excluded from the system, involves to reduce the transport costs to move manure from farm to fields. Moreover, considering the aids provided by the measure 121 of the current Rural Development Programme applied in the Lombardia region the economic investment could offset by 35-40%. 61


62 APPLICATION OF VALORE DSS 62
63 Chapter Management option 3: reduction of the crude protein content of the animal diets + construction of solid-liquid separator and selling of the solid fraction+ request of adoption of the limit of 250 kg N ha -1 as provided by nitrate derogation Objective: to reduce the amount of N to distribute on fields to get compliancy with nitrate directive Description: The alternative scenario involved the combination of three types of intervention along the manure management chain. It was selected i) the reduction of crude protein content of the diet as done previously, ii) the installation of a liquid-solid separation treatment plant to finally export the solid fraction that is mandatory under nitrate derogation for swine farms and, iii) the request of adoption of the prescription of the nitrate derogation regarding the maximum amount permitted of 250 kg nitrogen per hectare per year from cattle manure and treated pig manure. Results and discussion: The results of the simulation are reported in Table 3.4. The combination of the three management options involved a relevant reduction of the N available on farms that ranged from 20% to 36%. This was due to the lesser amount of N excreted of which the 20% was exported. This resulted in a lower environmental impact as ammonia volatilization and leaching. However, being the amount of organic N available to distribute on fields equal at 230 kg ha -1, to get compliancy with nitrate directive the farmers have to require the adoption of the nitrate derogation. 63

64 APPLICATION OF VALORE DSS 64
65 Chapter Management option 4: changes in crop rotations + changes of manure distribution across time + redistribution of organic N among crops + immediate incorporation of manure Objective: to reduce the amount of N leaching and the ammonia emission from manure distribution. Description: The scenario regarded the adoption of management options at cropping systems level. The first change involved the increases of the area devoted to autumn-winter crops in a double cropping system (two crops harvested in 12 months) with maize, in order to increase N uptake during the period when most leaching occurs. Italian Ryegrass was selected in cattle farms whereas barley was considered in swine farms being more compatible with pigs diet. To increase the apparent N recovery of organic fertilisers applied was simulated the distribution of 66% of manure in the firsts six months and a better redistribution among crops. The last change was the immediate incorporation of manure after spreading to mainly reduce ammonia losses. Results and discussion: The results of the simulation are reported in Table 3.5. The increase of soil cover together with a more efficient use of the N from manure, reduced N leaching (from 23% to 64%). Also ammonia volatilization was substantially reduced. The reduction ranged from 50% to 70%. These advantages from an environmental point of view were obtained maintaining a comparable biomass production per hectare as well as the crop N uptake. 65


66 APPLICATION OF VALORE DSS 66
67 Chapter Application of ValorE at regional scale Examples of databases interrogation As described in paragraph it is possible to interrogate the regional databases using a query function and through a WebGIS interface to visualize a picture of the current state of a specific area. Results are also available into spreadsheets that can be exported in Excel format. The query procedure involves, first, the selection of the aggregation level to finally present the results (i.e. farm, municipality and provinces) and, second, the selection of the geographic areas of interest. These could be municipality, provinces, protected area such as natural parks, hydrologic basin and agrarian regions. The latter derived from the subdivision of the national territory in homogeneous zones deriving from the aggregation of neighboring municipalities, normally built on the base of altimetric threshold values. The first example of free query shows the organic N load aggregated at municipality scale for the Province of Cremona (Figure 3.1). The same parameter is represented in Figure 3.2 for the agrarian region of the province of Cremona named Plain Crema Area while in Figure 3.3 the organic N load is visualized at level of the hydrologic basin of the Adda river. 67


68 APPLICATION OF VALORE DSS 68

69 Chapter 3 69
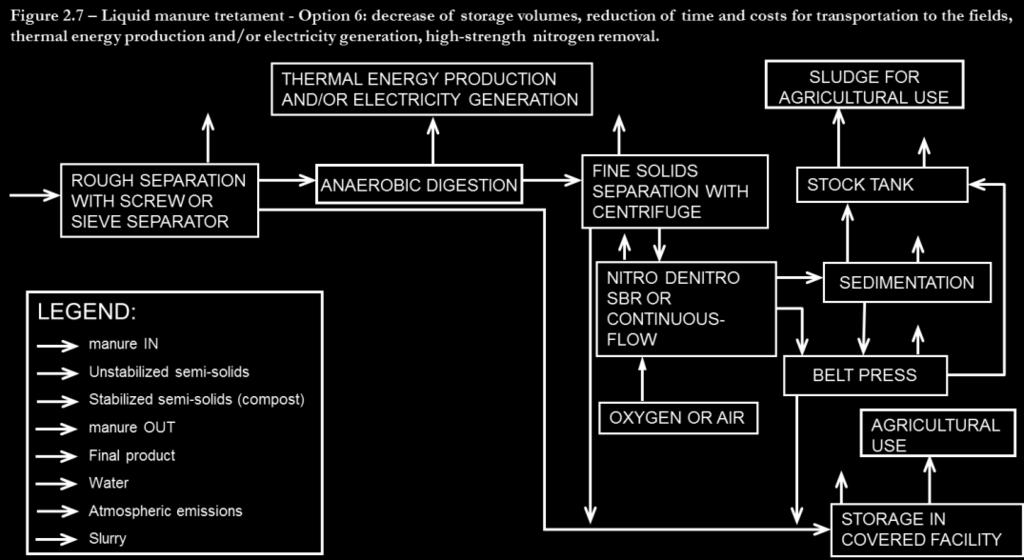
70 APPLICATION OF VALORE DSS Examples of alternative management options Management option 1: nitro-denitro treatment plant with removal of nitrogen Objective: to reduce the amount of N to distribute on fields to get compliancy with nitrate directive Sample area: the area is represented by nine neighbouring municipality localized in the south part of the province of Bergamo. It was chosen because is a nitrates vulnerable area with high organic N load. Within the area, through a query function, were selected only livestock farms, over 50 ha of agricultural utilizable area and that do not respect the limit of 170 kg per year/hectare of nitrogen from organic fertilisers. The sample is composed by 28 farms that could sustain the management and construction costs of the plant also aggregating in a consortium. The organic N load aggregated at municipality level is very high and ranged from 325 to 605 kg ha-1 of UUA (Figure 3.4a) Description: The alternative scenario hypothesized involved the implementation of the nitro-denitro treatment plant with removal of nitrogen. The livestock manure is first separated in a liquid and solid fraction. The liquid fraction enters in the nitro-denitro plant and successively stored in a tank for the final agronomic use. The remaining part is moved to a belt press and stored in covered facility together with the solid fraction obtained from the first separation. This final product could be applied on fields or sold outside farm (Figure 3.5). 70

71 Chapter 3 71
. As reported in Table 3.")

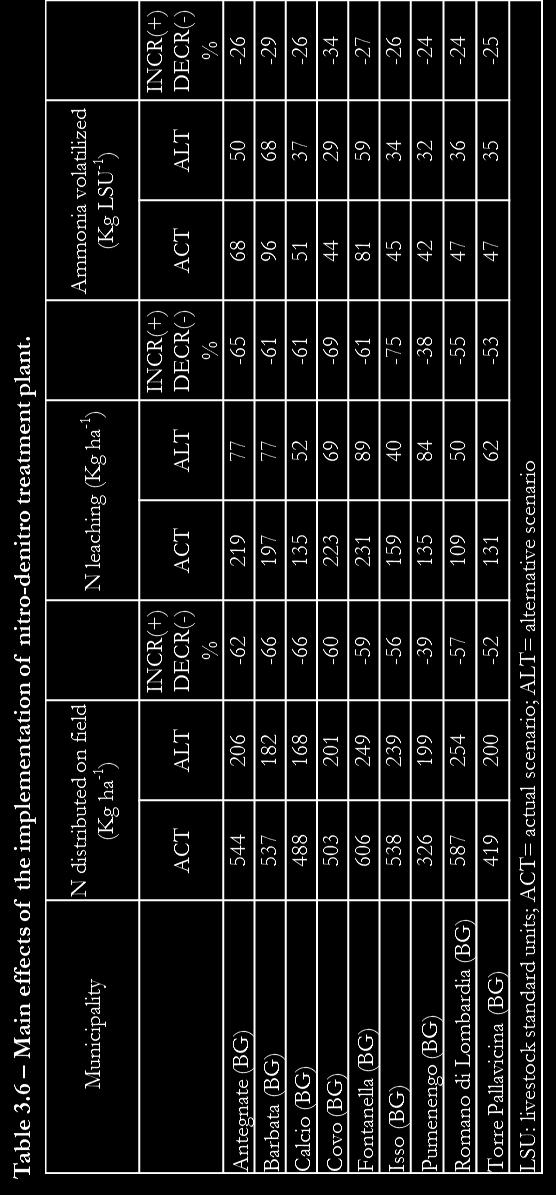
72 APPLICATION OF VALORE DSS Results and discussion: The first positive effect due to the implementation of this management option was the strong reduction of the organic N available to be distributed on fields (Fig. 3.4b). As reported in Table 3.6 the reduction ranged from 39% to 66% demonstrating that nitro-denitro process is a reliable solution to get compliancy with nitrate directive under derogation limits. Moreover as reported, relevant advantages from an environmental point of view can be obtained. N leaching and ammonia volatilisation were reduced from 38% to 75% and from 24% to 34%, respectively (Table 3.6, Figure 3.6 and Figure 3.7). The negative consequence is that the fertilisation value of manure is halved because of the 50% of N is lost as N 2. This implies the reviewing of the nitrogen fertilisation plans. From an economic point of view the direct costs of construction are relevant: for a dairy farm of 130 ha with 55 lactating cows and an annual volume of liquid manure produced of m 3, the expected investment (estimated by the software) is around Euro. However, considering the aids provided by the measure 121 of the current Rural Development Programme applied in the Lombardia region the economic investment could offset by 35-40%. 72

73 Chapter 3 73

74 APPLICATION OF VALORE DSS 74

75 Chapter 3 75
76 APPLICATION OF VALORE DSS Management option 2: covering of liquid manure stores. Objective: to reduce ammonia emission and livestock manure volumes during manure storage Sample area: the sample is composed by 58 livestock farms localised in the province of Cremona having an agricultural utilizable area over 50 ha and that do not respect the limit of storage capacity. Description: the alternative scenario involved the construction of a rigid cover for all of the stores available on farm to mainly reduce a part of the ammonia emission occurring during manure storage. Results and discussion: The effect of covering of manure stores was the strong reduction of ammonia volatilisation that ranged from 8% to 46%. (Table 3.7 and Figure 3.8). At the same time a mean reduction of the total manure volume by 4% (Figure 3.9) occurred due to the exclusion of rainfall water from the system. This could reduce the transport costs to move manure from farm to fields. However, this management option determined a mean increase of available N to applied on field by 7%, then a more accurate nitrogen management during field practices to avoid ammonia volatilization and leaching is needed. As reported in Table 3.7 the required investment could be relevant in some cases. 76

77 Chapter 3 77

78 APPLICATION OF VALORE DSS 78