An Evolving Conservation Model for Africa: Conservation Enterprise for Livelihoods & Conservation
|
|
|
- Gwendolyn Charles
- 5 years ago
- Views:
Transcription
1 An Evolving Conservation Model for Africa: Conservation Enterprise for Livelihoods & Conservation Daudi Sumba MEETING OF THE BOARD OF TRUSTEES May 10-12, 2011, Washington, D.C.
2 AWF Livelihood Approach Conservation Enterprise a commercial activity that meets a conservation objective A. Single Ventures Tourism lodges, campsites Aquatic Farms B. Value Chain ventures Livestock Marketing Agro-enterprises Bio-enterprises
3 Theories of change 1. If landowners who have chosen conservation receive economic benefits, they will adopt land use practices that support conservation 2. Communities/landowners will generate significant benefits if they enter partnerships with private sector for conservation enterprise development 3. Benefits must be significant to improve livelihoods if they are to incentivize conservation 4. Benefits will incentivize conservation if they are well managed and equitably distributed
4 Key Question: Do enterprises work as conservation strategy? What is their impact so far? Criteria for impact assessment Commercial performance Socio-economic Livelihood Impact Conservation Impact Satao Elerai Lodge as Case study
5 Changes measured and indicators Change Changes in economic benefits to communities Changes in types of economic benefits Changes in livelihood diversity and contribution of conservation Changes in management and sharing of benefits Changes in livelihood status of households Indicator Financial benefits to communities/h/hs (income, dividends, salaries, wages in US$) Non-financial benefits to communities/h/hs education, security, capacity building, infrastructure development, Perception of benefits by households/community Types of benefits (financial/non-financial and direct household and community) Perception of benefits by households/community Types of livelihood H/H strategies used Contribution of conservation to household incomes (US$ and %) Amount of direct household/community wide benefits (US$) shared Perceptions of benefit sharing within community Wealth ranking index of households Important sources of income Household asset based score Perception of changes in livelihoods
6 Methods for measuring impact A. PIMA System Systematic monitoring of key impact indicators Commercial performance, employment, benefit distribution etc B. WELD Methodology livelihood impact Mixed methods qualitative and quantitative Socioeconomic surveys h/h questionnaires (n=248) Focus Group Discussions Participatory Wealth Ranking Not used control groups Focuses on intervention NOT site/landscape C. GIS analysis of land use change D. Cross-border aerial census
7 Satao Elerai Lodge: Brief Partnership between Southern Cross Safaris & Elerai Group Ranch Investment = $600, year lease Opened June bed lodge Rates: $530 (peak) - $340 (low) 4350 acres conservation area - corridor & dispersal area to Mt Kilimanjaro Beneficiaries 253 households (1500 people) 30 employees Livelihood activities -Farming, livestock production

8 Satao Elerai Geographical Context
9 Commercial Performance FY2008 FY2009 FY2010 FY2011 FY2012 Total Total Bed nights 982 2,318 2,207 4,006 4,016 13,529 Occupancy 9.6% 23% 22% 39% 39.7% Avg =27% Gross Revenue $96,174 $297,262 $335,970 $600,019 $701,290 $2,030,715 Overheads $92,047 $179,637 $197,955 $322,476 $371,684 $1,163,799 Salaries $75,421 $72,789 $66,700 $71,507 $104,174 $390,591 Income to community $24,332 $51,179 $51,070 $90,863 $92,818 $310,262 Profit ($95,626) ($6,343) $20,245 $115,173 $132,614 $166,063

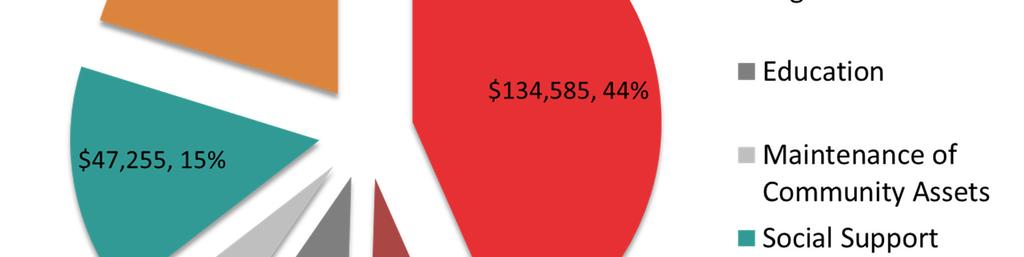

10 Distribution of Community Benefits

11 Changes in income/expenditure Source of Income % of Households Crop production 75.4 Livestock production 42.3 Casual Labor 40.7 Conservation/tourism income 27.5 Formal Employment 19.8 Remittances 19 SME business 19 Expenditure Item Percentage Food 62.5 Hospital 15.6 School fees 21.8 Loan payment 9.4 Crop production inputs 28.1 Livestock production inputs 25.0 Wealth Index Frequency Percentage Very poor Poor Rich Very rich Total

12 Sources of income by wealth group
13 Changes in household assets Household items % Change Transport/ Logistics Motorcycle Car/matatu Bicycle Communication Television Radio Cell phone Anti -Conservation Charcoal Jiko Other Bank account A sewing machine Sofa set Table Mattress Bed Mosquito nets Torch Blanket
14 Contribution of income streams Income Stream Clusters Conservation,crop production Crop production and livestock Cropproduction and business Crop production and employment Conservationand business Mean % Mean % Mean % Mean % Mean % Employment Income Conservation Income , Crops Production Business Income , Livestock Production Average annual income ($64) ($883) ($385) ($2,203) ($1509) N 85 34% 28 11% % 8 3% 6 2%
15 Determinants of livelihood patterns Crops, conservation Crops and livestock Crops and business B Sig Exp(B) B Sig Exp(B) B Sig Exp(B) Wealth Status Very poor Poor Rich * Very rich * * ** Gender Male Female * Marital Status Widowed * Other * * Education Level of HH Head No Formal Complete primary ** Complete tertiary * *10 7 Highest Completed education Secondary ** ** Tertiary * * Age Less than 30 Years Years ** Years ** Distance to conservation area *** * Years lived in community Participation in AWF activities *** ** ***


16 Conservation Impact: Land-use change
17 Land Use Change in Acres Zone Acres Converted (2005) Converted ( ) Total Change % change Calves Grazing Core Conservation 4, Dry Season Grazing Wet Season Grazing 1, , Totals 9,


18 Conservation Impact: Wildlife use
19 Conclusion Lodge performing well, generating substantial benefits for community; slowed land use change; increase tolerance for wildlife Benefits very important for the poor in Elerai Group Ranch Impact monitoring key for designing post deal support Initiated SE monitoring now more cycles required to provide clear picture of livelihood impacts of enterprises Will need control groups to better judge impact Learning key objective for Socio-economic work
20