COACHELLA VALLEY WATER DISTRICT Crop Report
|
|
|
- Beryl Stanley
- 5 years ago
- Views:
Transcription


1 COACHELLA VALLEY WATER DISTRICT 2017 Crop Report
2 Table of Contents Irrigation Method Map... 3 Introduction... 4 Crop Values and Accumulated Values... 5 Acreage and Accumulated Acreage Year History of Crops by Value... 7 Historical Crop Value Charts Year History of Crops by Acreage...13 Historical Crop Acreage Chart...14 Top 10 Charts Value & Acreage...19 Acreage Irrigated Not Harvest...20 Crop Acreage by Irrigation Method Charts...20 Water Consumption by Source Chart United States Bureau of Reclamation (USBR) Crop and Water Data...22 De initions

3 2017 Irrigation Method Map 3
4 Introduction Making every drop count... Since 1918 The 2017 Coachella Valley Water District (CVWD) Crop Report summarizes the crop types, crop acreages, irrigation methods, and the estimated gross value of agricultural production within CVWD s Improvement District 1 (ID1). The CVWD Crop Report also summarizes, on a monthly basis, the metered Colorado River water delivered inside and outside ID1, including all water that is pumped through the Mid-Valley Pipeline and delivered to the Levy Groundwater Replenishment Facility. This report does not report any groundwater production within CVWD s boundary, inside or outside ID1. The values in this report represent the gross value of products and do not reflect costs associated with production, marketing, or transportation. No attempt has been made to reflect the net income, profit, or loss to producers. The acreages in this report represent all seasonal vegetables, permanent crops, non-bearing permanent crops, polo fields, golf courses, and wetlands located inside ID1. The 2017 gross production is valued at, $612,004,853, which represents a 2.79% decrease over the 2016 value of $629,545,933. Gross farmed acreage (primary and secondary) is 66,046 acres, compared to last year s 66,617 acres. The decrease in cropped acreage is attributed to idle farmland in various crop rotations and the removal of some permanent crops such as grapes and citrus trees. The crop values represent only crops grown inside ID1. CVWD provides canal water for seasonal vegetables and permanent crops including, bearing and nonbearing date trees, grapes, figs, mangoes, peaches, and citrus varieties. Other uses of Colorado River water include irrigation for polo fields, golf courses inside ID1, maintenance of wetland areas such as duck ponds, and replenishment of the ground water basin. Because the metered Colorado River Water may only account for a portion of the actual crop water requirement, and may be supplemented by groundwater pumping, this report is not to be used as a benchmark to accurately determine the crop amount of water used per acre. This report also contains the annual US Bureau of Reclamation Crop and Water Data, Form as supplemental data to the CVWD Crop Report. The USBR Form is required of all Colorado River Contractors and is used to document crop acreage, production, price and Colorado River Water used inside and outside ID1 including water to the customers served off the Mid Valley pipeline. A further explanation of the source of data in the USBR form is located in the appendix this report. In 2017, CVWD continued to utilize Geographic Information Systems (GIS) mapping software to identify crops and accurately measure crop acreage in the field. GIS has become an essential part of cropreporting methods. Sincerely, Eric Morales Eric Morales, CVWD Crop Reporter 4


5 2017 Crop Values and Accumulated Values ** * *** * Total Dollars by Crop ** Running Total 5


6 2017 Acreage and Accumulated Acreage * N/B Non bearing * Total Acreage by Crop ** Running Total ** * *** *** 6

7 5 Year History of Crops by Value Crop Description Grapes $130,288,461 $131,852,825 $156,300,300 $145,993,515 $133,659,918 Bell Peppers $79,111,747 $87,891,750 $119,680,501 $77,733,600 $74,192,512 Lemon-Lime $56,516,317 $93,824,406 $104,388,255 $83,531,814 $63,253,079 Golf Course Turf $60,508,404 $80,128,574 $57,366,501 $49,219,329 $51,129,219 Dates $45,486,000 $36,184,900 $41,383,440 $40,138,560 $50,136,000 Carrots $11,750,390 $21,756,480 $27,203,400 $28,632,144 $30,405,510 Lettuce $41,500,003 $28,023,774 $28,344,615 $25,092,600 $25,207,326 Nursery-Trees $28,498,354 $27,778,740 $26,971,420 $18,357,072 $18,953,334 Tomatoes $4,483,945 $3,860,800 $3,028,451 $3,798,320 $12,694,000 Green Bean $9,483,177 $11,583,000 $11,249,005 $7,101,250 $11,240,428 Top Ten Crops $467,626,798 $522,885,249 $575,915,888 $479,598,204 $470,871,326 Other Crops $201,118,566 $207,601,978 $169,789,090 $149,947,729 $141,133,527 All Crops Combined * $668,745,364 $730,487,227 $745,704,978 $629,545,933 $612,004,853 Lettuce Field Grapes * Total Gross Produc on 7

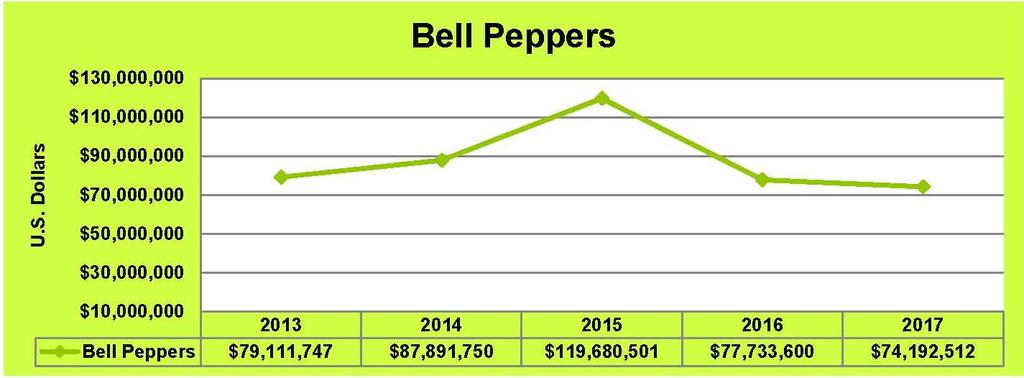


8 Historical Crop Value Charts Grape Harvest Bell Pepper Harvest 8


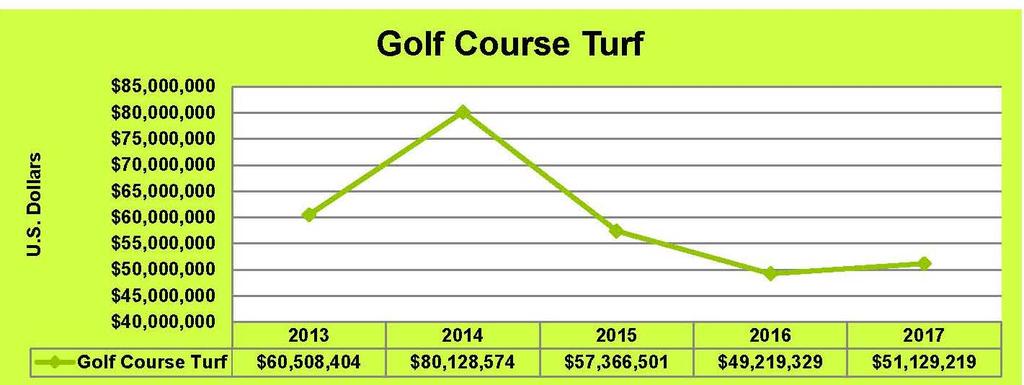
9 Plantation Golf Lemons 9


10 Date Palm Shoots Carrot Field 10


11 Lettuce Harvest Citrus Nursery 11


12 Green Bean Plant Tomatoes 12
13 5 Year History of Crops by Acreage Crop Description Dates Grapes Golf Course Turf Carrots Bell Peppers Lemon-Lime Lettuce Oriental Vegetables Dates - N/B Pasture-Permanent Top Ten Crops Other Crops All Crops Combined * Bell Pepper Field Grapes Bok Choy * Total Acreage Combined (Primary & Secondary Acres) 13


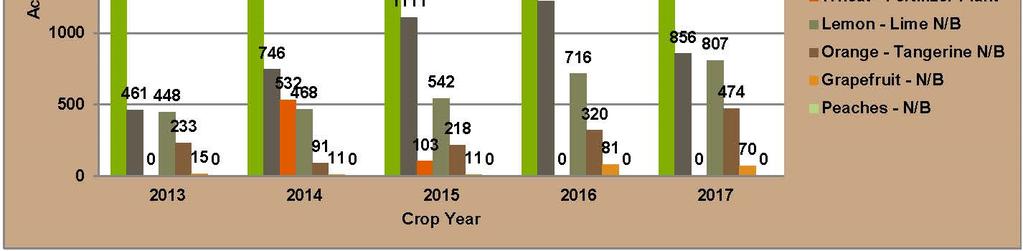
14 Historical Crop Acreage Chart Grapes Date Palm Tree 14


15 Carrot Bunch Toscana Golf Course 15


16 Lemon Grove Bell Pepper Plants 16


17 Lettuce Being Packaged Bok Choy Harvest 17


18 Field of Date Palm Shoots Pasture 18


19 Top 10 Charts Value & Acreage 19


20 Acreage Irrigated Not Harvested Crop Acreage by Irrigation Method Charts 20


21 Water Consumption by Source Chart Rancho LQ Golf Course 21
 service area and Improvement District 1 (ID1).")
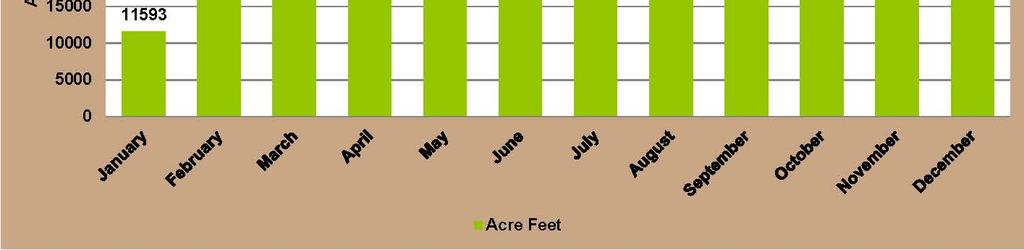
22 Explanation of Data found in Report The 2017 United States Bureau of Reclamation (USBR) Crop and Water Data, form , represent the crop types, crop acreages, estimated crop yield, irrigation method and irrigation water distributed to customers within the Coachella Valley Water District (CVWD) service area and Improvement District 1 (ID1). This report represents only imported Colorado River Water and not groundwater production within CVWD s service area. Sections I and II of form include the total district acres (inside ID1), irrigable acres, commercial acres, non-commercial acres, multiple-cropped acres, acres irrigated, acres irrigated but not harvested, and idle/fallow acreage. The irrigable acres are calculated using GIS mapping technology and field verified three times per year by CVWD staff. Section III of form includes the crop type, crop acreage, and yields per acre and total yields per ton. CVWD staff calculate the crop type and crop acreage with a GIS mapping software and through a field verification process. The crop yield and value data is obtained from the County of Riverside Agricultural Commissioner s Office. Section IV of form monthly water distribution, data includes all Colorado River Water Supply, Operational Spills, Transportation Losses, Non-Agricultural Deliveries (M&I, Wildlife, Misc.), and Water Delivered to Farms. The monthly water delivered section includes all Colorado River Water that is conveyed through the Coachella Canal and sold to CVWD customers. The accounting of this water includes water exported outside of ID1 for Golf Course Use and Groundwater Replenishment. The water used outside of ID1 data is located in the Non-Agricultural Deliveries (M&I, Wildlife, Misc.) columns of form The described uses of this water can be further broken down by: 1. M&I Construction Water and East Valley Groundwater Replenishment 2. Wildlife Water to Dos Palmas Reserve and Wildlife Drinkers. 3. Misc Golf Courses including the Mid Valley Pipeline, Hunting Clubs, Polo Fields, and Fish Farms. All published data on groundwater production collected by CVWD is in the Engineer s Report on Water Supply and Replenishment Assessment You can reference this report in its entirety on the CVWD website, 22

23 23

24 24
25 USBR Form Legend Section I District Information and Section II District Lands in Irrigation Rotation Acreage Formula k. Irrigable Acres = b. Commercial Acres + c. Non-commercial acres + f. Acres irrigated but not harvested + g. Acres not Irrigated Fallow and Idle Section IV Monthly Water Distribution c. Water Supply = Supply from AAC to Coachella Canal minus IID customers usage d. Operational Spills = Measured Regulatory Water e. Transportation Losses = Total Water Supply (Water Sold + Regulatory Water) f. Non Agricultural Deliveries (Class 2 type of User) (1) M&I = Construction Water and East Valley Groundwater Replenishment (2) Wildlife = Water to Dos Palmas Preserve and the Wildlife Drinkers (3) Misc. = Golf Courses, hunting clubs, polo fields, and fish farms g. Delivered to farms = Class 1 type of user commercial agricultural activities. 25
26 De initions The following defini ons of terms are provided to assist you in understanding the categories listed in the Form Total District Acres Irrigable Acres Full Irriga on Service Commercial Acres Non Commercial Acres Mul Cropped Acres Acres Irrigated By Acres Irrigated But Not Harvested This acreage includes all acres within the district boundaries, including, farmsteads, roads, ditches, drains, dry cropped, idle, fallow, and grazed. This also includes all irrigable land for service and irrigable land not for service. The arable land under a specific plan for which water supply is or can be made available and which is provided with or planned to be provided with irriga on, drainage, flood protec on, and other facili es, as necessary for sustained irriga on. Applies to irrigable land now receiving, or to receive, its sole and generally adequate irriga on water supply through works or facili es constructed by or to be constructed by the Bureau of Reclama on. This term also applies to previously irrigated land in non Federal projects where a substan al por on of the facili es has been or is to be constructed, rehabilitated, or replaced by Reclama on. Full irriga on service may be applicable to several types of land, such as regular projects, Warren Act, special contract, leased or water rental lands. All irrigated acres that include harvested cropland and pasture in the irriga on rota on for land classes 1 through 5. Urban, Suburban, and Industrial acres. Nonagricultural irrigable land in residen al, commercial, and industrial uses which include town areas, residen al developments, suburban residences, industrial developments, etc. Acres on which a second or successive crop is grown on the same land during the calendar year. Total acres irrigated by a specific irriga on method including sprinkler, drip, and flood. Crops planted but not harvested due to crop failure, adverse market condi ons, etc. Also includes young non bearing fruit trees and vines. 26
27 Sec on IV Monthly Water Distribu on Type of Service Full service when all lands are provided all irriga on water by Reclama on project, Supplemental water is when irriga on water comes from Reclama on project and non project source, Temporary water service is when irriga on water is provided under a temporary arrangement from Reclama on. Project Water Water Supply Opera onal Spills Transporta on Losses M&I Deliveries Wildlife Deliveries Miscellaneous Deliveries All water deliveries are in Acre feet per month. Total Project water is the amount of water diverted by irriga on district for irriga on purposes. Measured water diversion of project water delivered to the district. Amount of project water lost through opera onal spill, measured regulatory water. The project water lost through seepage, evapora on, and evapotranspira on from plants on the canal bank. Project water delivered for Municipal and Industrial use such as water which is treated for potable use. Project water delivered for wildlife refuges or mi ga on area. Project water delivered to urban and suburban lands, which includes rural residences with less than $1,000 in gross agricultural sales. Non potable water customers in Class 2 type of user (golf course, polo fields, duck club, lakes, etc.) Delivered to Farms Total water delivered to agricultural customers in Class 1 type of user who use canal water for commercial 27
28 Land classes and subclasses of the USBR system Six land classes based on produc on economics are normally recognized. Brief descrip ons are as follows: Class 1 Arable Class 2 Arable Class 3 Arable Class 4 Special use Lands Class 5 Non arable Class 6 Non arable Lands that are highly suitable for irrigated farming, being capable of sustained and rela vely high yield of clima cally adapted crops at reasonable cost. These lands have a rela vely high payment capacity. Lands that have a moderate suitability for irrigated farming. These are either adaptable to a narrower range of crops, more expensive to develop for irriga on, or less produc ve than Class 1. Poten ally these lands have intermediate payment capacity. Lands that have a marginal suitability for irrigated farming. They are less suitable than Class 2 lands and usually have either a serious single deficiency or a combina on of several moderate deficiencies in soil, topography, or drainage proper es. Although greater risk may be involved in farming these lands than those of Class 1 and 2, under proper management they are expected to have adequate payment capacity. Lands which in the USA are only suited to certain special uses (e.g. rice, pasture, or fruit) are classified 1, 2 or 3 (to reflect rela ve payment capacity) along with the appropriate le er designa ng the l and use (crop). This land is temporarily considered as non arable because of some specific deficiency such as excessive salinity, ques onable drainage, flooding, or other deficiency which requires further studies to resolve. The deficiency or deficiencies are of such a nature and magnitude that special agronomic, economic, or engineering studies are required to resolve the costs or effect on the land. Class 5 designa on is tenta ve and should be changed to either Class 6 or an arable classifica on during formula on of the recommended plan of development. Land that is non arable under the exis ng or project economic condi ons associated with the proposed project development. Generally, Class 6 comprises steep, rough, broken, rocky, or badly eroded lands, or lands with inadequate drainage, or other deficiencies. In some instances lands considered to be Class 6 in one area may be arable in another area because of different economic condi ons. In addi on to various physical type deficiencies that result in a nonarable classifica on, lands ini ally classified as arable (poten ally irrigable) on the basis of payment capacity (farm financial analysis) may be found non arable if subsequent economic analysis (benefit analysis) indicates that benefits from such lands are less than their costs in a plan of development. Thus, the lower arable class(es) of lands would be considered non arable and, of course, non irrigable for economic reasons. 28