Application of biochar from coconut shells to different soils in Thua Thien Hue province, Vietnam
|
|
|
- Eugene Herbert Fox
- 5 years ago
- Views:
Transcription
1 Application of biochar from coconut shells to different soils in Thua Thien Hue province, Vietnam Tran Thi Tu 1), Morihiro Maeda 2), Le Van Thang 1), Nguyen Dang Hai 1), Tran Dang Bao Thuyen 1) 1) Institute of Resources, Environment and Biotechnology- Hue University, Vietnam 2) Graduate School of Environmental and Life Science, Okayama University, Japan ABSTRACT We used biochar produced from coconut shells at 500 o C. The objective of the study was to determine the influence of the biochar application to different soils on crop growth and nutrient balances under greenhouse conditions in Thua Thien Hue Province, Vietnam. Pot experiments with Komatsuna (Brassica rapa var. perviridis) were conducted in three different soils: sandy soil with high organic matter content, clay soil, and sandy soil with low organic matter content, collected in Quang Dien district. Chemical fertilizer was applied to the soil at rates of 12 g N/m 2, 10 g P 2 O 5 /m 2, and 12 g K 2 O/m 2. Half of the pots were treated with the biochar at 1,500 g/m 2. Experimental results showed that biochar application changed soil quality, resulted in improving the growth of Komatsuna. We will report differences of nitrogen and phosphorus balances (crop uptake, leaching, retention, etc.) in experimental pots. Our results indicated that the use of biochar from agricultural wastes would be beneficial for farmers, the environment under soil and climatic conditions in Thua Thien Hue province. KEYWORDS Biochar, coconut shells, nutrient, nitrogen, phosphorus INTRODUCTION We evaluate soil application effects of biochar produced from coconut shells at 500 o C. Biochar is preferably produced from local agricultural wastes from viewpoints of treatment and material costs. Coconut shells can be raw materials in rural areas in developing countries because of sufficient and constant supply. Biochar is defined as a solid material obtained from carbonization of biomass. Benefits of biochar application to soil are: increased soil carbon content, improved physical properties (increased water retention and drainage), decreased nutrient leaching, improved fertility (nutrients
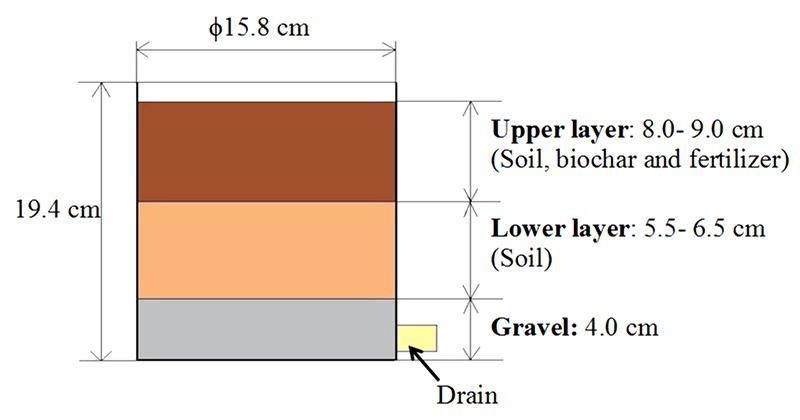
2 release) and reduced emissions of green house gases (Clough and Condron, 2010; Nelson et al. 2011). The purpose of our study is to determine the influence of the biochar application to different soils on crop growth and nutrient balances under greenhouse conditions in Thua Thien Hue Province, Vietnam. Pot experiments with Komatsuna (Brassica rapa var. perviridis) were conducted in three different soils: sandy soil with high organic matter content, clay soil, and sandy soil with low organic matter content, collected in Quang Dien district. Our results indicated that the use of biochar from coconut shells would be beneficial for farmer, the environment under soil and climate conditions in Thua Thien Hue province. MATERIALS AND METHODS 1. Biochar materials used Coconut shells were collected from dumping garbage near Dong Ba market in Hue city, Vietnam in September Feedstock was dried at the temperature 110 o C for 3 hours. Pyrolysis of coconut shells was performed using a muffle furnace for 60 minutes at the temperature 500 o C with a rise rate of 10 o C/min in a nitrogen flow of 1L/min for 2 hours to remove any oxygen remaining in the furnace. This biochar was produced in Okayama University, Japan (Maeda et al., 2012; Uddin et al., 2012). 2. Pot experiments We used three different soils (sandy soil (S) and clay soil (C) with low organic matter content, sandy soil with high organic matter content (O)) which were collected in Quang Dien district, Thua Thien Hue province, Vietnam in May Komatsuna was grown in Wagner s pots with 200 cm 2 area and 20 cm deep, in which 2.7 kg soil (14 cm high) on 1 kg of gravel (4 cm high) was packed, in a greenhouse at Center for Application and Technology Transfer, Institute of Resources, Environment and Biotechnology- Hue University (Phu Vang district, Thua Thien Hue province, Vietnam) from 12 June to 18 July Total N and P contents in initial soils were both detectable. As shown in Table 1, experimental treatments include no addition of biochar and additions of coconut shell biochar (1,500 g/m 2 each) in triplicate. The biochar materilas were mixed in the top layer (0-9 cm). Chemical compounds were applied to the top layer just before sowing of Komatsuna seeds (3-4 seeds in each pot) at rates of 12 g N/m 2, 10 g P 2 O 5 /m 2 and 12 g K 2 O/m 2. Irrigation was applied according to schedule following: 12 and 13 June: 1,000 ml/ 2 days, from 15 June to 03 July: 400 ml/ 3 days, from 06 July to 15 July: 600 ml/ 3 days, 17 and 18 July: 1,000 ml/ day.
 g/pot g/pot g/pot (NH 4 ) 2 SO 4 KH 2 PO 4 KCl SN1 No Char- Poor 0 1.131 0.384 0.169 Sandy soil SB2 Biochar- Poor 30 1.131 0.384 0.169 Sandy soil CN3 No Char- Fertilizer 0 1.")
 is applied as KCl. Effects of soil types: 6 treatments x 3 replicates= 18 pots.")
3 Table 1 Experimental design of the study in Thua Thien Hue province, Vietnam Biochar P K from N fertilizer fertilizer Treatment coconut fertilizer (In shells 12 g N/m 2 10 g 12 g* Sample triplicates) 1,500g/m 2 P 2 O 5 /m 2 K 2 O/m 2 Soil (g/pot) g/pot g/pot g/pot (NH 4 ) 2 SO 4 KH 2 PO 4 KCl SN1 No Char- Poor Sandy soil SB2 Biochar- Poor Sandy soil CN3 No Char- Fertilizer Clay soil CB4 Biochar- Fertilizer Clay soil ON5 No Char- More Organic soil Fertilizer OB6 Biochar- More Fertilizer Organic soil * 6.63 g K 2 O/m 2 is applied as KH 2 PO 4 ; the rest (5.37) is applied as KCl. Effects of soil types: 6 treatments x 3 replicates= 18 pots. East Irrigation mL/ 3 days Komatsuna In Greenhouse, to limit rain Biochar M Biochar= 30g/ 1 pot (1,500g/m 2 ), H Bio+Soil= 8-9 cm Soil M Soil= 2.7 Kg, H Soil= 14 cm Leachate Gravel 1.0 Kg, H gravel= 4cm Hbl= 50cm Leachate Bottle Door (South) ϕ15.8 cm 20.0 cm Upper layer: cm (Soil, biochar and fertilizer) Lower layer: cm (Soil) Drain Gravel: 4.0 cm Fig. 1 Pot experiments in Thua Thien Hue province, Vietnam
4 3. Chemical analysis The drainage of pots was collected in a 500 ml polyethylene bottle for few hours after every irrigation event. The weight of the leachate was measured. The samples were kept at 0-2 o C until the analysis of total N, nitrate (NO 3 -N) and total P by using UV- VIS spectrophotometer (V530, JASCO, Japan). Harvested Komatsuna vegetable was separated into above and root parts, immediately weighed and dried at 70 o C for 1 week. Total N and P contents were determined after the Kjeldahl digestion. After the harvest of Komatsuna vegetable, soil samples were destructively collected from two layers: the upper (0-9 cm) and lower layers (9-14 cm). Total N and P contents in soils were determined after the digestion (3 ml H 2 SO 4 and 3.5 ml H 2 O 2 at 300 o C). Those concentrations in extracts were analyzed with Kjeldahl system and UV-VIS spectrophotometer. 4. Statistical analysis Microsoft Excel was used to calculate and process sample results. RESULTS AND DISCUSSION 1. Nutrient uptake by Komatsuna Both biochar applications increased the uptake of P (Fig. 2 and 3) and N (Fig. 4 and Fig. 5) in roots and leaves by Komatsuna. This is probably because soil water retention was improved with the incorporation of biochar materials. The uptake of P and N by Komatsuna in clay and organic soils was better than the uptake of nutrients in sandy soil. Besides, dry matter yields in soils with biochar were higher than it is in soils without biochar (Fig. 6 and Fig. 7). 2. Nutrient leaching and retention Most of total P leached was in the form of PO 4 -P. Biochar application reduced significantly total P. The amount of leaching losses of total P during the experiment in organic soil was particularly better than it is in clay and sandy soils. After the harvest of Komatsuna, total P content in the upper layer was the highest in organic soil. Soils with biochar retained more P, resulting in reduced P leaching (Fig. 8, Fig. 10 and Fig. 11).
5 0.10 Roots 2.0 Leaves Uptake P (g/m2) 0.05 Uptake P (g/m2) SN1 SB2 CN3 CB4 ON5 OB6 Fig. 2 Phosphorous in roots absorbed by Komatsuna 0.0 SN1 SB2 CN3 CB4 ON5 OB6 Fig. 3 Phosphorous in leaves absorbed by Komatsuna Roots 0.20 Leaves Uptake N (g/m2) Uptake N (g/m2) SN1 SB2 CN3 CB4 ON5 OB6 Fig. 4 Nitrogen in roots absorbed by Komatsuna Dry matter weight (g/m2) Roots SN1 SB2 CN3 CB4 ON5 OB6 Fig. 6 Dry matter weight in roots 0.00 SN1 SB2 CN3 CB4 ON5 OB6 Fig. 5 Nitrogen in leaves absorbed by Komatsuna Dry matter weight (g/m2) Leaves SN1 SB2 CN3 CB4 ON5 OB6 Fig. 7 Dry matter weight in leaves TP leaching (g/m2) TP leaching (g/m2) /15/2012 6/18/ /15/2012 6/18/2012 6/21/2012 6/21/2012 6/24/2012 6/27/2012 6/30/2012 7/3/2012 7/6/2012 7/9/2012 7/12/2012 7/15/2012 7/18/2012 6/24/2012 6/27/2012 6/30/2012 7/3/2012 7/6/2012 7/9/2012 7/12/2012 7/15/2012 7/18/2012 Time Time SN1 SB2 CN3 CB4 TN leaching (g/m2) TN leaching (g/m2) /15/ /18/2012 6/21/2012 6/24/2012 6/27/2012 6/30/2012 7/3/2012 7/6/2012 7/9/2012 7/12/2012 7/15/2012 7/18/2012 6/15/2012 6/18/2012 6/21/2012 6/24/2012 6/27/2012 6/30/2012 7/3/2012 7/6/2012 7/9/2012 7/12/2012 7/15/2012 7/18/2012 Time Time SN1 SB2 CN3 CB4
6 TP leaching (g/m2) /15/2012 6/18/2012 6/21/2012 6/24/2012 6/27/2012 6/30/2012 7/3/2012 7/6/2012 7/9/2012 7/12/2012 7/15/2012 7/18/2012 Time Fig. 8 Leaching loss of total phosphorous during the experiment TP left in soil (g/m2) Upper ON5 OB6 SS SN1 SB2 CS CN3 CB4 OS ON5 OB6 Fig. 10 Total P left in upper layer TN left in soil (g/m2) Upper SS SN1 SB2 CS CN3 CB4 OS ON5 OB6 Fig. 12 Total N left in upper layer TN leaching (g/m2) /15/2012 6/18/2012 6/21/2012 6/24/2012 6/27/2012 6/30/2012 7/3/2012 7/6/2012 7/9/2012 7/12/2012 7/15/2012 7/18/2012 Time Fig. 9 Leaching loss of total nitrogen during the experiment TP left in soil (g/m2) Lower ON5 OB6 SS SN1 SB2 CS CN3 CB4 OS ON5 OB6 Fig. 11 Total P left in lower layer TN left in soil (g/m2) Lower SS SN1 SB2 CS CN3 CB4 OS ON5 OB6 Fig. 13 Total N left in lower layer Most of total N leached was in the form of nitrate (NO 3 -N). The amount of total N losses during the experiment was the greatest in organic soil. After the harvest of Komatsuna, total N content in the upper layer changed unclearly in every soil. Total N content increased in the upper layer with sandy and organic soils; however it decreased in the upper layer with clay soil. Soils with biochar retained more N in sandy and organic soils, resulting in reduced N leaching in those soils (Fig. 9, Fig. 12 and Fig. 13). 3. Inputs and outputs of nutrients Inputs and outputs during the experiment is shown in Table 2. Recovery rates of P were 71-96% of each input (Table 2). Total P in the initial soil was comparable to the standard application rate of P fertilizer. More than 90% of input P remained in soil after the harvest of Komatsuna. The amount of P leached smaller than the total P inputs in soil.
7 Recovery rates of N were 19-93% of each input (Table 2). In clay soil, the amounts of unknown N were smaller than in other soils. The unknown fraction of N was large in sandy and organic soils and may have released nitrous oxide during the processes of nitrification and denitrification (Clough and Condron, 2010). Therefore, we should further study the N dynamics in soil treated with biochar materials. Table 2 Inputs and outputs of nutrients during the experiment Treatment (g/m 2 ) P inputs SN1 SB2 CN3 CB4 ON5 OB6 Fertilizer Soil Biochar Total P outputs Soil Leaching Plant uptake Total Unknown P N inputs SN1 SB2 CN3 CB4 ON5 OB6 Fertilizer Soil Biochar Total N outputs Soil Leaching Plant uptake Total Unknown N CONCLUSIONS AND PERPECTIVES We examined the effect of biochar application to different soils on crop growth, phosphorus and nitrogen balances under greenhouse conditions in Thua Thien Hue Province, Vietnam. Results showed that: (1) Komatsuna growth in sandy soil less than clay and organic soils. Biochar improved crop yield in clay and organic soils, but it did not improve in sandy soil. (2) Biochar increased P and N uptake in leaves and roots in clay and organic soils. (3) Biochar reduced P leaching; furthermore biochar reduced TN leaching in organic soil. Besides, biochar reduced NO 3 -N leaching in clay and organic soils. We further study the N dynamics in soil treated with biochar materials.
8 REFERENCES Cough, T.J and L.M. Condron, Biochar and the nitrogen cycle: Introduction. J. Environ. Qual. 39(4), (2010). Maeda, M., K. Miyamoto, U.M. Azhar, S. Hayashi, and R. Yokoyama, 3-3 Characteristics of biochar materials produced from coconut shells and rice husks for soil application, The Annual report of FY 2011 Practical Research and Education of Solid Waste Management Based on the Partnerships among Universities and Governments in Asia and Pacific Countries, Waste Management Research Center, Okayama University, (2012). Nelson, N.O., S.C. Agudelo, W. Yuan, and J.Gan, Nitrogen and phosphorous availability in biochar amended soils, Soil Sci. 176(5), (2011). Azhar, U.M., and R. Ichita, 3-2 Development of technologies for the utilization of agricultural and forestry wastes: preparation of biochar form coconut husk hand rice husk, The Annual report of FY 2011 Practical Research and Education of Solid Waste Management Based on the Partnerships among Universities and Governments in Asia and Pacific Countries, Waste Management Research Center, Okayama University, (2012).


9 L/O/G/O FY 2012 Debrief Meeting of Practical Research and Education of Solid Waste Management Based on the Partnership among Universities and Governments in Asia and Pacific Countries Application of Biochar from coconut shells to different soils in Thua Thien Hue province, Vietnam Tran Thi Tu 1, Morihiro Maeda 2, Le Van Thang 1, Nguyen Dang Hai 1, Tran Dang Bao Thuyen 1 1. IREB- Hue University, Vietnam 2. Okayama University, Japan Okayama, Feb. 02,
10 CONTENTS - Purpose - Biochar from coconut shells (production in Japan) - Research in Hue city Conclusions 2

 were conducted in three different soils: sandy soil with high organic matter content, clay soil, and sandy soil with low organic matter content,")
11 PURPOSE Using Biochar produced from coconut shells at 500 o C. Research determines the influence of the biochar application to different soils on crop growth and nutrient balances under greenhouse conditions in Thua Thien Hue Province, Vietnam. Pot experiments with Komatsuna (Brassica rapa var. perviridis) were conducted in three different soils: sandy soil with high organic matter content, clay soil, and sandy soil with low organic matter content, collected in Quang Dien district. Our results indicated that the use of biochar from coconut shells would be beneficial for farmer, the environment under soil and climate conditions in Thua Thien Hue province. 3
12 POT EXPERIMENTS IN HUE CITY Materials and methods: + Biochar: Coconut shell (at 500 o C, 60 minutes) + Soil: Sandy soil (S) and Clay soil (C) with low organic matter content, Sandy soil with high organic matter content (O) collected in Quang Dien district, Thua Thien Hue province, Vietnam. Soil (M Soil = 2.7 Kg) + Gravel (M gravel = 1.0 Kg) + Wagner pot (Size: 200 cm 2, 20 cm deep) + Plant: Komatsuna (Brassica rapa var. perviridis; shin- Komatsuna) + Growth period: 12 June 18 July, 2012 (1 month) + Fertilizer: N: (NH 4 ) 2 SO 4 ; P: KH 2 PO 4 ; K: KH 2 PO 4, KCl + Irrigation: 12 and 13 June: 1,000 ml/ 2days 15 June- 03 July: 400 ml/ 3 days July: 600 ml/ 3 days 17 and 18 July: 1,000 ml/ day + Analysis: Leachate (Total P, Total N and NO 3 -N), Plant and Soil (Total P and Total N). 4
13 BIOCHAR FROM COCONUT SHELLS (PRODUCTION IN JAPAN) Raw materials: Coconut shells Drying: 110 o C, 3h Loading into the Pyrolysis reactor (N 2 purging for 2 hours) Biochar Pyrolysis: - N 2 flow, 1.0 L/min. - Target temperature: 500 o C - Heating Rate: 10 o C/min. - Pyrolysis time: 60 min. 5
; collected in Quang Dien district, Thua Thien Hue province, Vietnam on May 17, 2012. S O C 6")
14 LOCATION OF SOIL SAMPLING Three different soils: Sandy Soil (S) and Clay Soil (C) and with low organic matter content, Sandy soil with high organic matter content (O); collected in Quang Dien district, Thua Thien Hue province, Vietnam on May 17, S O C 6
15 POT EXPERIMENTS IN GREENHOUSE - Location: Center for Application and Technology Transfer- IREB (Phu Vang district, Thua Thien Hue province, Vietnam) 7

16 8


17 LIMIT DIRECTLY SUNSHINE INTO HOUSE cover with black mesh layer and cover surrounding by mesh to limit insects and directly sunshine 9
18 EXPERIMENTAL DESIGN Chemical fertilizer was applied to the soil at rates of 12g N/m 2, 10g P 2 O 5 /m 2, and 12g K 2 O/m 2. Half of the pots were treated with the biochar at 1500 g/m 2. Table 1. Experimental design in Hue city Effects of soil types: 6 treatments x 3 replicates= 18 pots 10
19 Experimental pots 11
20 RESULT AND DISCUSS 1. Komatsuna growth (dry matter weight) 2. P uptake by Komatsuna 3. N uptake by Komatsuna 4. Leaching (TP, TN, NO 3 -N leaching) 5. TP and TN in soil after the experiment 6. P input and output 7. N input and output 8. Water balance 12

21 Komatsuna growth at the end of the experiment 13
22 1. Komatsuna growth (dry matter weight) Leaves Dry matter weight (g/m2) (g/m 2 ) Dry matter weight (g/m 2 ) Drymatter weight (g/m2) SN1 SB2 CN3 CB4 ON5 OB6 Roots SN1 SB2 CN3 CB4 ON5 OB6 - Sandy soil (S) < Clay soil (C) < Organic soil (O) - Biochar improved crop yield in Clay soil and Organic soil, but did not improve it in Sandy soil. 14
23 2. P uptake by Komatsuna Roots 0.10 Uptake P (g/m2) 2 ) Uptake P (g/m 2 ) Uptake P (g/m2) SN1 SB2 CN3 CB4 ON5 OB6 Leaves SN1 SB2 CN3 CB4 ON5 OB6 Biochar increased P uptake in leaves and roots in Clay soil and Organic soil. 15
24 3. N uptake by Komatsuna Roots Uptake N (g/m2) 2 ) Uptake N (g/m 2 ) Uptake N (g/m2) SN1 SB2 CN3 CB4 ON5 OB6 Leaves SN1 SB2 CN3 CB4 ON5 OB6 Biochar increased N uptake in leaves and roots in Clay soil and Organic soil. 16
25 4. Total P leaching TP TP leaching (g/m2) 2 ) /15/2012 6/18/2012 6/21/2012 6/24/2012 6/27/2012 6/30/2012 7/3/2012 7/6/2012 7/9/2012 7/12/2012 7/15/2012 7/18/2012 Time SN1 SB2 TP TP leaching (g/m2) 2 ) CN3 CB4 Biochar reduced TP leaching 6/15/2012 6/18/2012 6/21/2012 6/24/2012 6/27/2012 6/30/2012 7/3/2012 7/6/2012 7/9/2012 7/12/2012 7/15/2012 7/18/2012 Time TP TP leaching leaching (g/m2) (g/m 2 ) /15/2012 6/18/2012 6/21/2012 6/24/2012 6/27/2012 6/30/2012 7/3/2012 7/6/2012 7/9/2012 7/12/2012 7/15/2012 7/18/2012 Time ON5 OB6 17
26 4. Total N leaching TN leaching (g/m2) 2 ) TN (g/m2) TN leaching (g/m2) TN leaching (g/m 2 ) TN leaching (g/m 2 ) /15/ /15/ /15/2012 6/18/2012 6/21/2012 6/18/2012 6/21/2012 6/24/2012 6/27/2012 6/18/2012 6/21/2012 6/24/2012 6/27/2012 6/24/2012 6/27/2012 6/30/2012 6/30/2012 7/3/2012 7/3/2012 7/6/2012 7/6/2012 7/9/2012 7/9/2012 7/12/2012 7/12/2012 7/15/2012 7/15/2012 6/30/2012 7/3/2012 7/6/2012 7/9/2012 7/12/2012 7/15/2012 7/18/2012 7/18/2012Time 7/18/2012 Time Time ON5 OB6 SN1 SB2 CN3 CB4 Biochar reduced TN leaching in Organic soil. 18
27 4. NO 3 -N leaching NO NO NO3-N 3 -N leaching 3 leaching (g/m (g/m (g/m2) 2 2 ) /15/2012 6/18/2012 6/21/2012 6/24/2012 6/27/2012 6/30/2012 7/3/2012 7/6/2012 7/9/2012 7/12/2012 7/15/2012 7/18/2012 Time SN1 SB2 NO3-N (g/m2) NO NO 3 -N leaching (g/m 2 3 -N leaching (g/m 2 NO3-N (g/m2) 3 -N leaching 2 3 leaching 2 ) ) /15/ /18/2012 6/15/2012 6/18/2012 6/21/2012 6/24/2012 6/27/2012 6/30/2012 7/3/2012 7/6/2012 6/21/2012 6/24/2012 6/27/2012 6/30/2012 7/3/2012 7/6/2012 7/9/2012 7/12/2012 7/15/2012 7/18/2012 7/9/2012 7/12/2012 7/15/2012 7/18/2012 Time Time CN3 CB4 ON5 OB6 Biochar reduced NO 3 -N leaching in Clay soil and Organic soil. 19
28 5. Total P left in soil after the experiment Upper TP left in in Soil Soil (g/m2) (g/m 2 ) TP left in Soil (g/m 2 ) TP left in soil (g/m2) SS SN1 SB2 CS CN3 CB4 OS ON5 OB6 Lower SS SN1 SB2 CS CN3 CB4 OS ON5 OB6 Biochar retained more P in the upper layer. 20
29 5. Total N left in soil after the experiment Upper TN left in soil (g/m2) TN TN left in Soil (g/m2) 2 ) TN left in Soil (g/m 2 ) SS SN1 SB2 CS CN3 CB4 OS ON5 OB6 Lower SS SN1 SB2 CS CN3 CB4 OS ON5 OB6 Biochar retained more N in the upper layer (Sandy and Organic soils). 21
 Output: P uptake by Komatsuna, TP leaching, TP left in soil and")
30 6. P input and output Output P (g/m2) P (g/m 2 ) Input Input P (g/m2) P (g/m 2 ) SN1 SB2 CN3 CB4 ON5 OB6 SN1 SB2 CN3 CB4 ON5 OB6 Soil Fertilizer Unknown TP left in soil Leaching Komatsuna Input: Fertilizer and soil mineral P, Biochar (NA) Output: P uptake by Komatsuna, TP leaching, TP left in soil and Unknown 22
31 7. N input and output 25 Output N (g/m2) Output N (g/m 2 ) Input N (g/m2) 2 ) SN1 SB2 CN3 CB4 ON5 OB6 SN1 SB2 CN3 CB4 ON5 OB6 Soil Fertilizer Unknown Komatsuna Leaching TN left in soil Input: Fertilizer and soil mineral N, Biochar (NA) Output: N uptake by Komatsuna, TN leaching, TN left in soil and Unknown 23
32 8. Water balance during the entire experiment Water balance mm SN1 SB2 CN3 CB4 ON5 OB6 Evapotranspiration Increase of soil water Discharge - Discharge: S > O > C - Increase of soil water: S > O > C - Evapotranspiration: C > O> S --> Biochar kept soil moisture content higher in Sandy soil and Organic soil. 24
33 CONCLUSIONS We examined the effect of biochar application to different soils on crop growth, P and N balances under greenhouse conditions in Thua Thien Hue Province, Vietnam. Results showed: 1. Komatsuna growth in Sandy soil (S) < Clay soil (C) < Organic soil (O). Biochar improved crop yield in C and O soils, but did not improve in S soil. 2. Biochar increased P and N uptake in leaves and roots in C and O soils. 3. Biochar reduced P leaching. 4. Biochar reduced TN leaching in O soil. Biochar reduced NO 3 - N leaching in C and O soils. 25
34 THANK YOU FOR YOUR ATTENTION! 26