Market Outlook. David Reinbott.
|
|
|
- Simon Price
- 5 years ago
- Views:
Transcription
1 Market Outlook David Reinbott Agriculture Business Specialist P.O. Box 187 Benton, MO (573)
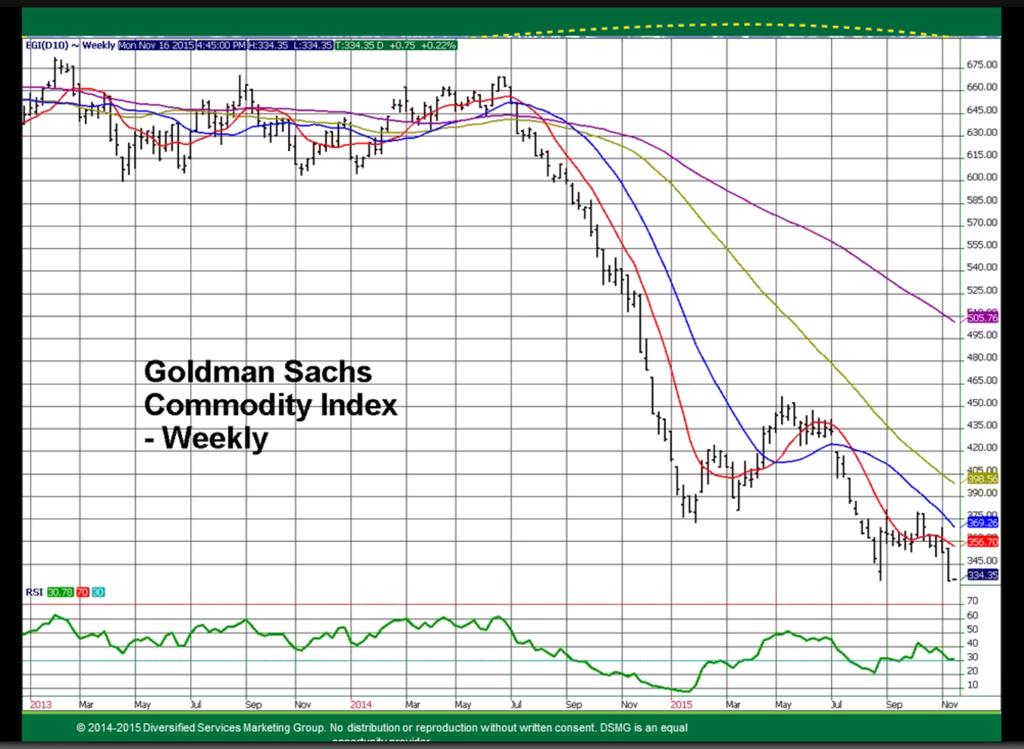
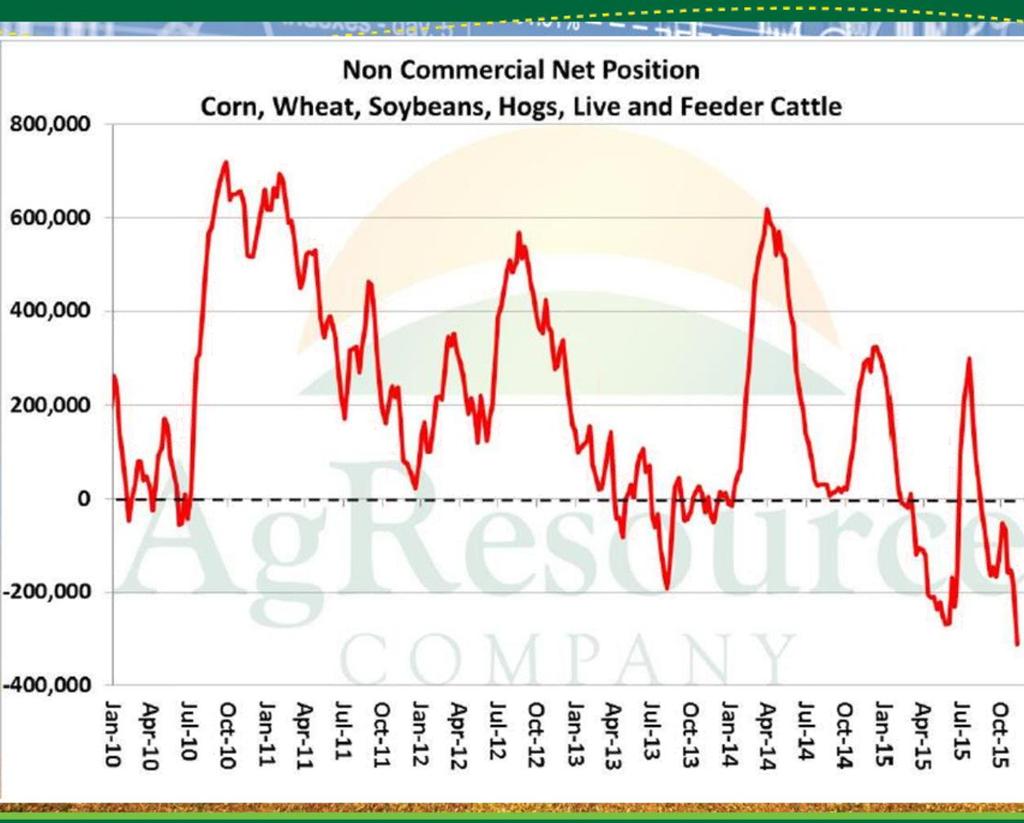
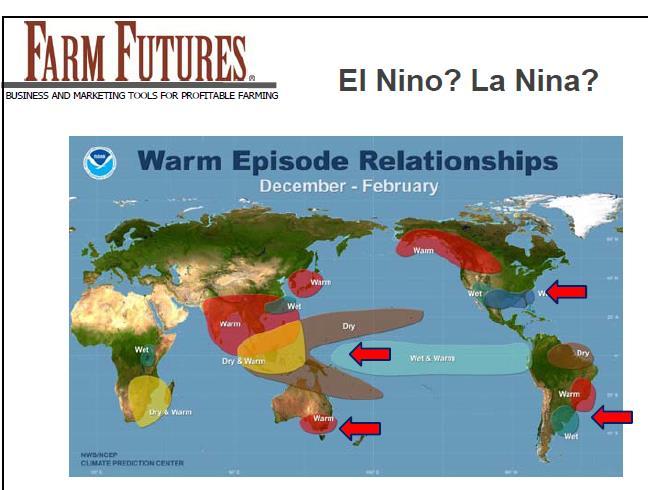
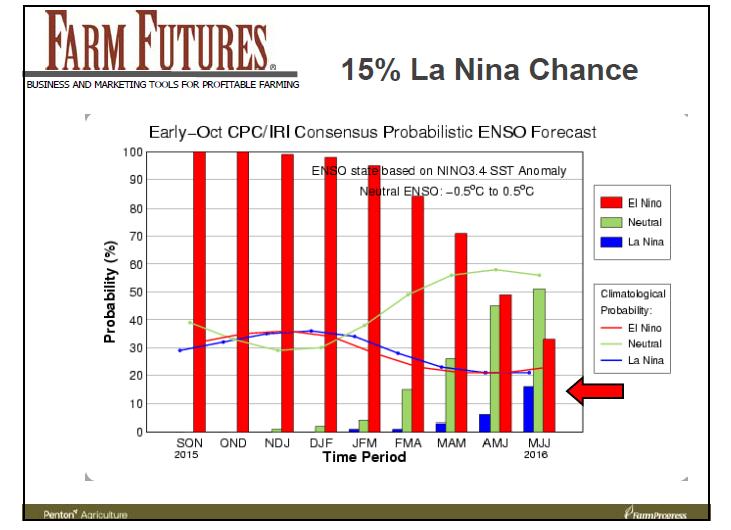
2 Trending Issues Volatile World Uncertain Chinese Growth Rattled Emerging Markets Burdensome Crop Supplies Weakening Livestock Markets El Nino Weather Threat Lower Incomes Funds Existing Ag Markets Strong U.S. Dollar $
3 Trending Issues Jan 12 Report bigger crop World Production Increasing World Demand Steady World Ending Stocks - Increasing
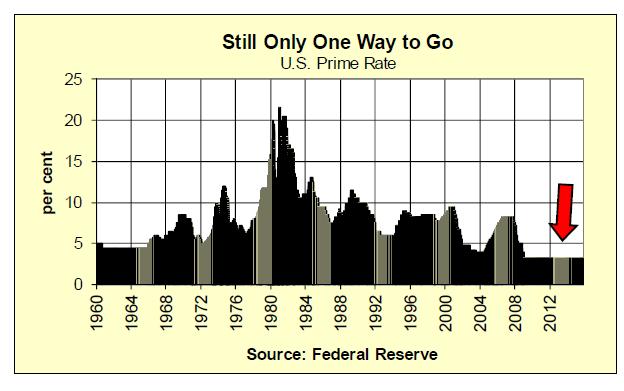
4 U.S., world economic growth expected to continue Lower energy prices provide a boost to consumer spending, reduce production costs Strong dollar has affected agricultural trade Interest rates likely to increase


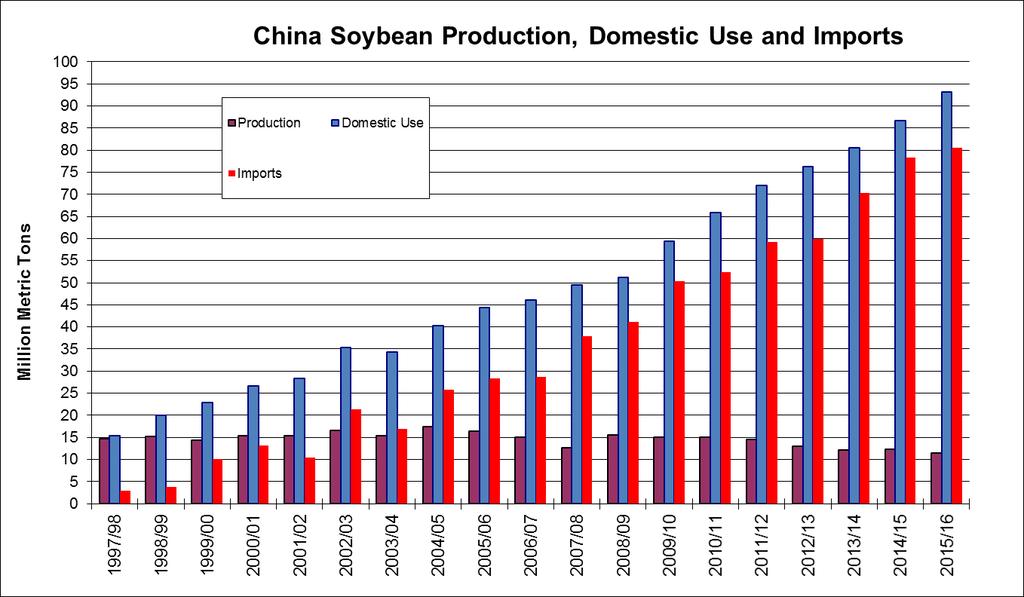
5 Increase in China s consumption from : 49 mmt Total U.S. consumption in 2015: 36 mmt Source: USDA s PSD Online, November 2015


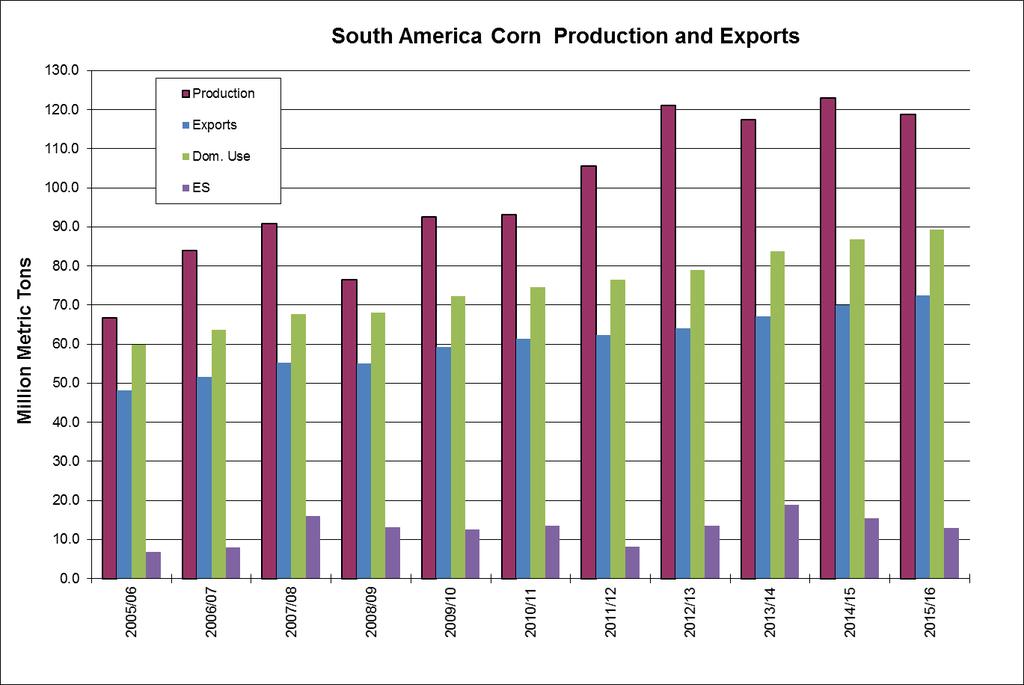
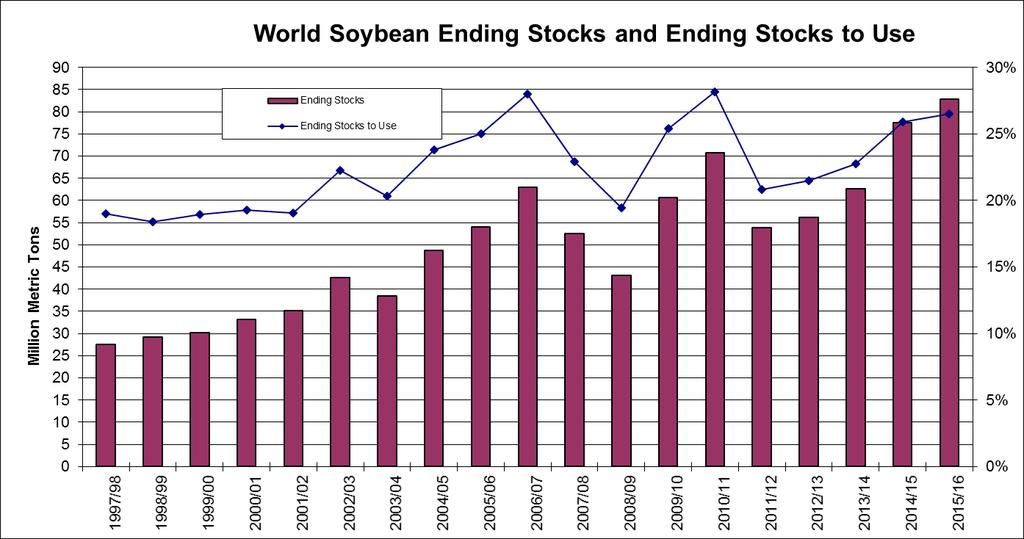
6 Source: USDA s PSD Online, November 2015
7 Final EPA rule requires more biofuel use than earlier proposal Possible impacts A little more production and use in 2016 Slightly higher corn and bean prices, all else equal Pattern for future? Court action likely New Administration??? Bllion gallons As announced: Total RFS Advanced Biodiesel Cellulosic Conventional May proposal Total RFS Advanced Biodiesel Cellulosic Conventional
8
9 U.S. Dollar Index - Monthly
10
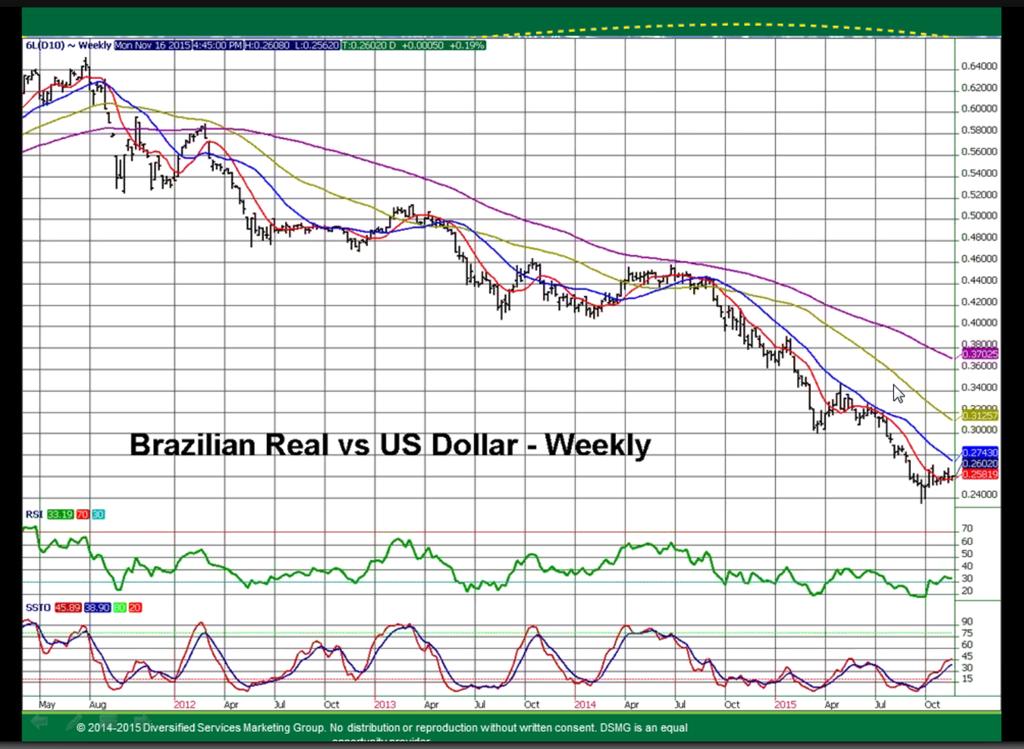
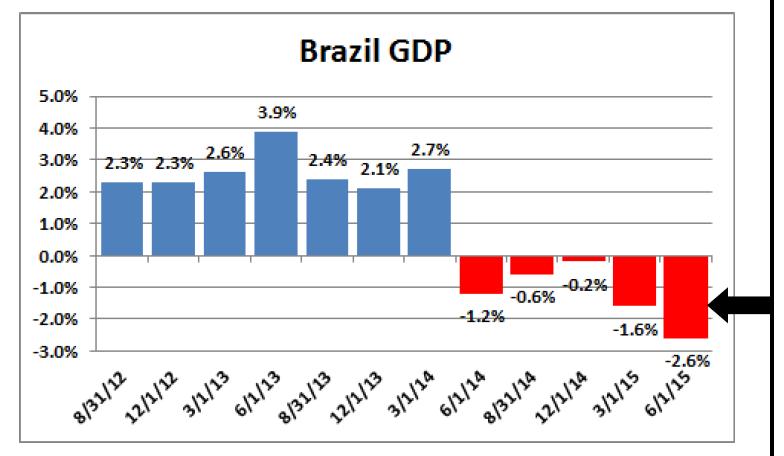
11 Brazilian Real - Monthly
12
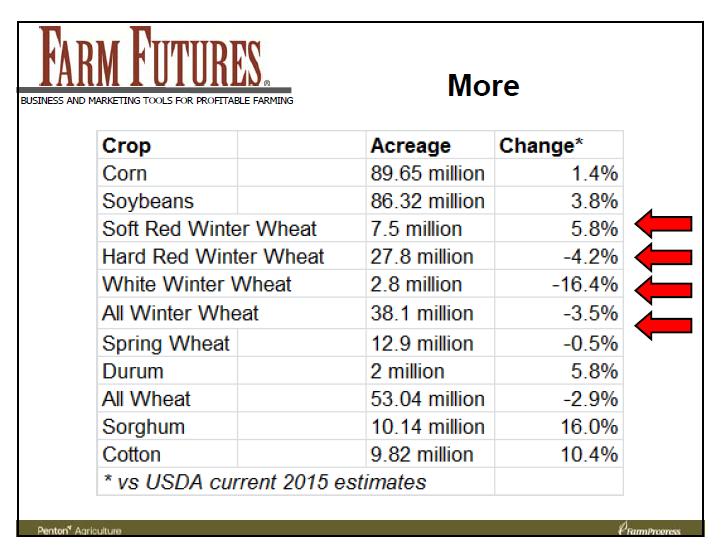
13
14

15 David Reinbott November 23, 2015
16
17 Monthly Corn Futures $3.18
18 March 2016 Corn Futures $4.12 $3.65
19 Nov. WASDE 2014/15 Nov. WASDE 2015/16 Nov. FAPRI 2015/16 Nov. FAPRI 2016/17 Area planted (mil. a.) Area harvested (mil. a.) Yield (bu./a.) Supply & use (mil. bu.) Production 14,216 13,654 13,654 13,595 Feed & residual use 5,315 5,300 5,329 5,339 Ethanol & coproducts 5,209 5,175 5,187 5,212 Other domestic use 1,359 1,380 1,374 1,369 Exports 1,864 1,800 1,784 1,776 Ending stocks 1,731 1,760 1,742 1,670 Price per bushel $3.70 $3.35-$3.95 $3.64 $3.75
20 U.S. New Crop Balance Sheets - Corn Balance Sheet U.S. Corn: Supply & Use New Crop New Crop New Crop 2016/ / /17 Planted Acres Harvested Acres Yield Ending Stocks 1,994 1,577 1,329 Stocks/Use 14.5% 11.4% 9.6% Ave Farm Price $3.50 $4.00 $4.25
21 U.S. New Crop Balance Sheets - 1 Million 1 Million 1 Million Corn Balance Sheet less acres less acres less acres U.S. Corn: Supply & Use New Crop New Crop New Crop 2016/ / /17 Planted Acres Harvested Acres Yield Ending Stocks 1,831 1,423 1,179 Stocks/Use 13.3% 10.3% 8.6% Ave Farm Price $3.65 $4.20 $4.65
22

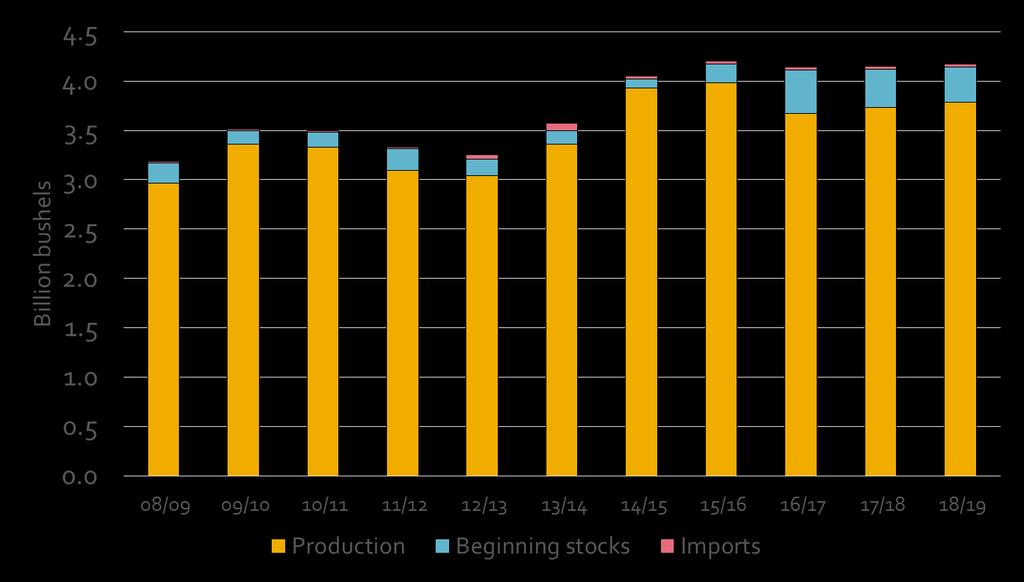
23 Source: USDA PSD Online, November 2015
24
25
26
27

28
29
30

31 David Reinbott November 23, 2015
32
33


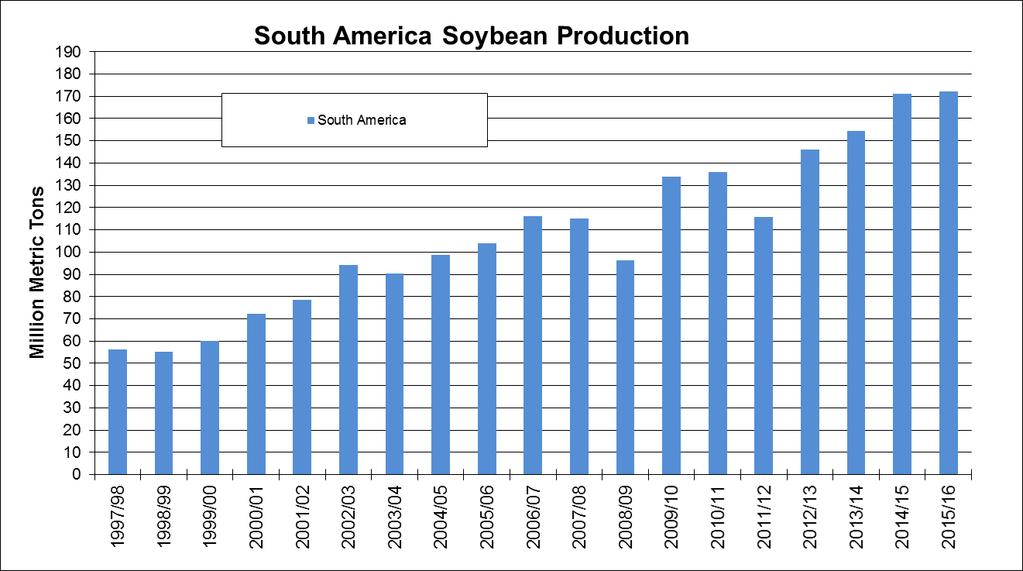
34 Source: USDA s PSD Online, Nov. 2015

35 Source: USDA PSD Online, November 2015
36 Nov. WASDE 2014/15 Nov. WASDE 2015/16 Nov. FAPRI 2015/16 Nov. FAPRI 2016/17 Area planted (mil. a.) Area harvested (mil. a.) Yield (bu./a.) Supply & use (mil. bu.) Production 3,927 3,981 3,981 3,669 Crush 1,873 1,890 1,891 1,884 Other domestic use Exports 1,843 1,715 1,730 1,736 Ending stocks Price per bushel $10.10 $ $8.86 $8.87
37 U.S. Soybean: Supply & Use New Crop New Crop New Crop 2016/ / /17 Planted Acres Harvested Acres Yield Total use 3,797 3,797 3,797 Ending Stocks Stocks/Use 18.2% 12.6% 6.0% Ave Farm Price $8.00 $8.50 $10.00
38 Soybean Balance Sheet 1 Million U.S. Soybean: Supply & Umore acres 1 Million more acres 1 Million more acres New Crop New Crop New Crop 2016/ / /17 Planted Acres Harvested Acres Yield Total use 3,797 3,797 3,797 Ending Stocks Stocks/Use 19.4% 13.8% 7.1% Ave Farm Price $7.50 $8.25 $9.50
39

40
41
42 March 2016 Soybean Futures $9.22 $8.55


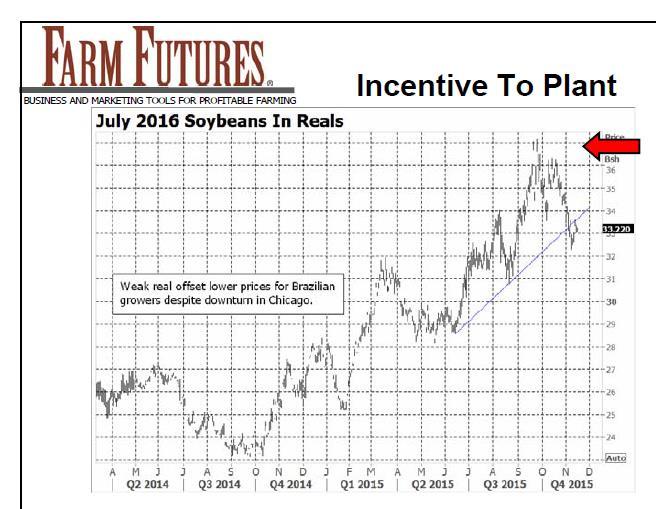
43 Source: FAPRI-MU collaborators at the University of Nevada, Reno, November 2015
44
45
46
47
48
49

50 +17% vs % vs Source: USDA s Foreign Agricultural Service Oilseeds: World Markets and Trade, various issues and author calculations using monthly exchange rates reported by
51
52
53
54
55
56

57 David Reinbott November 23, 2015
58
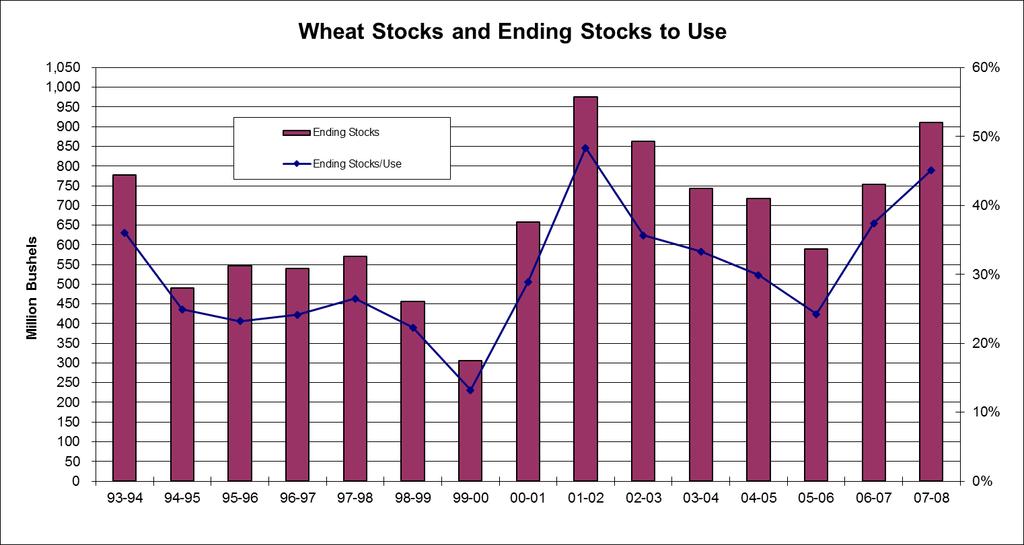
59 Monthly Wheat Futures
60 Nov. WASDE 2014/15 Nov. WASDE 2015/16 Nov. FAPRI 2015/16 Nov. FAPRI 2016/17 Area planted (mil. a.) Area harvested (mil. a.) Yield (bu./a.) Supply & use (mil. bu.) Production 2,026 2,052 2,052 2,063 Feed & residual use Food use Exports Ending stocks Price per bushel $5.99 $4.80-$5.20 $4.98 $4.96
61

62

63 David Reinbott November 23, 2015
64 $4.50 Dec 2016 Corn Futures $4.20 $3.85
65 $9.85 Nov 2016 Soybean Futures $9.20 $8.60
66 $6.28 July 2016 Wheat Futures $5.40
67 Projection for USDA FAPRI-MU Futures Next year 12.5% 15.0% 19.0% 2 years ahead 17.7% 20.4% 25.1% 3 years ahead 22.9% 22.3% 23.6% 4 years ahead 26.2% 26.1% 24.2% 5 years ahead 29.7% 28.9% 26.9% Average of above 21.8% 22.5% 23.8% Sources: USDA and Futures estimates by Scott Irwin and Darrell Good in a FarmDoc piece posted Feb. 4 ( FAPRI-MU estimates compiled by FAPRI-MU and reported in a FarmDoc piece by Pat Westhoff on Feb. 12 (

68 David Reinbott November 23, 2015
69
70

71 David Reinbott November 23, 2015
72 Revenue Southeast Missouri Non-Irrigation Crop Budgets 2016 Corn GMO Soybean Roundup Ready D. C. Grain Sorghum Cotton Wheat Soybean R.R. Estimated Yield (Bu/Acre) A Estimated Price ($/Bushel) B $3.65 $8.90 $3.60 $0.59 $5.00 $8.90 Estimated Gross Revenue ($/Acre) $ $ $ $ $ $ Total Variable Cost $ $ $ $ $ $ Fixed Costs Fixed Machinery Cost Fixed Buildings & Bins Cost Total Costs (Excluding Land) $ $ $ $ $ $ Land Real Estate Taxes Land Interest Total Cost $ $ $ $ $ $ Estimated Returns Returns Above Variable Costs $ $ $71.91 $32.08 $50.59 $ Returns Above Mach & Buildings $40.27 $ $6.91 ($77.92) $13.59 $70.00 Returns Above Total Costs ($129.84) ($58.13) ($163.19) ($248.02) ($71.46) ($15.05) Breakeven Price $4.52 $10.14 $5.08 $0.88 $6.19 $9.28
73 Revenue Corn GMO Soybean Roundup Ready Grain Sorghum Pop Corn Cotton Rice Convent. Wheat D. C. Soybean R.R. Estimated Yield (Bu/Acre) A Estimated Price ($/Bushel) B $3.65 $8.90 $3.60 $0.11 $0.59 $5.40 $5.00 $8.90 Estimated Gross Revenue ($/Acre) $ $ $ $ $ $ $ $ Total Variable Cost $ $ $ $ $ $ $ $ Fixed Costs Fixed Machinery Cost Fixed Buildings & Bins Cost Fixed Irrigation Cost Total Costs (Excluding Land) $ $ $ $ $ $ $ $ Land Real Estate Taxes Land Interest Total Cost $ $ $ $ $ $ $ $ Estimated Returns University of Missouri Extension Southeast Missouri Irrigation Crop Budgets 2016 Returns Above Variable Costs $ $ $ $ $ $ $50.59 $ Returns Above Mach & Buildings ($20.88) $76.47 ($25.74) ($15.37) $5.74 $ $13.59 $39.82 Returns Above Total Costs ($190.98) ($93.63) ($195.84) ($185.47) ($164.36) ($18.22) ($71.46) ($45.23) Breakeven Price $4.66 $10.54 $5.00 $0.15 $0.73 $5.52 $6.19 $9.80

74 David Reinbott November 23, 2015

75 Source: USDA Economic Research Service, November 2015 and unpublished FAPRI-MU projections
76

77 Family Living Exp. - NE