Food Security and Agriculture Cluster. Kabul- Afghanistan 16 th November 2016
|
|
|
- Amberly Gray
- 5 years ago
- Views:
Transcription
1 Food Security and Agriculture Cluster Kabul- Afghanistan 16 th November 2016
 4. Partners update (MEDAIR and Mission East) (20 minutes) 5. Presentation on Global Hunger Index (30 minutes) 6.")
2 Agenda 1. Introduction of the participants and action points from the last meeting (10 minutes) 2. Presentation of final SRP 2017 (20 minutes) 3. Discussion on monitoring plan and cluster response guidelines (15 minutes) 4. Partners update (MEDAIR and Mission East) (20 minutes) 5. Presentation on Global Hunger Index (30 minutes) 6. Presentation on current Agro climatic condition of Afghanistan (15 minutes) AOB: FSAC partners presence 3w map Proposal and report writing training in Hirat Next Meeting
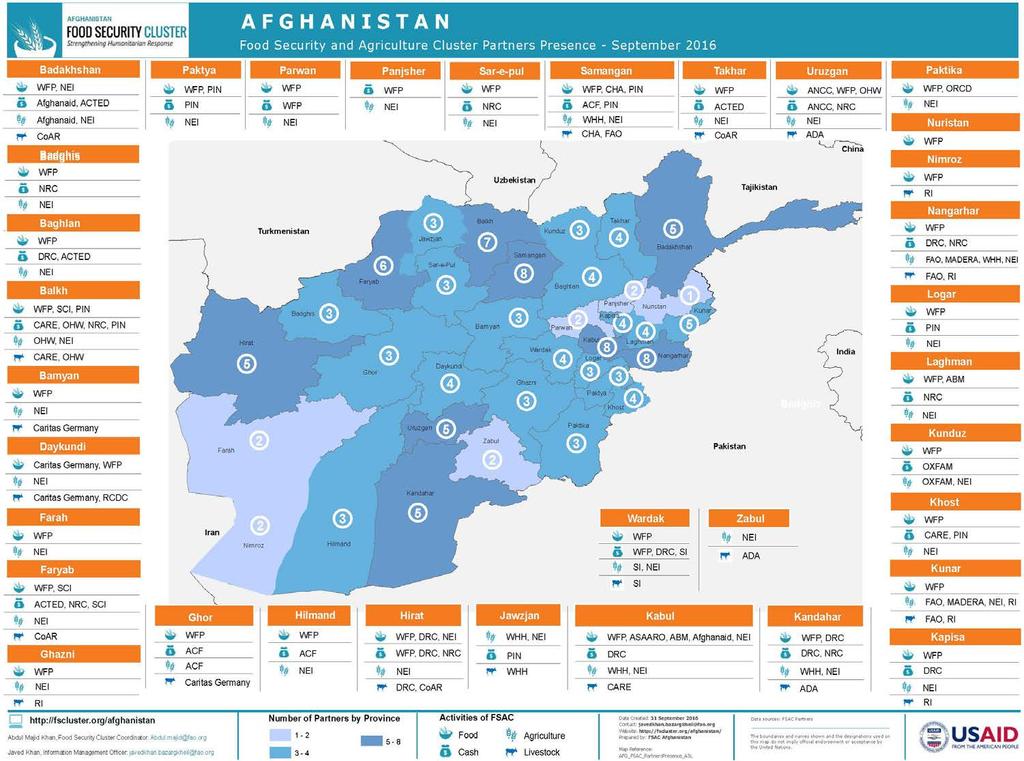
3 Action Points from the last meeting S/No ACTION POINTS RESPONSIBLE PARTY TIMELINE Status 1 To organize a meeting with SAG members to discuss response plan for To share the draft 3W & partners presence map with all FSAC partners for their comments 3 Partners to provide returnees response update to FSAC 4 To organize an early warning meeting and share the early warning information key messages with all partners FSAC November Achieved FSAC November Achieved Partners November Achieved FSAC ASAP In process
4 Cluster response plan 2017
5 This image cannot currently be displayed. SRP FSAC 2017 Food Assistance Livelihoods assistance No of No of S.No Type of benif Target Unit cost months Total Target Unit cost months Total 1 Undocumented Returnees from 333,000 Pakistan & Iran (75%) ,962,000 85, ,700,000 2 Documented returnees from 137,500 Pakistan and Iran (25%) ,450,000 35, , ,000 3 Conflict affected IDP's (100%) ,100, , ,250, ,000 4 Natural disaster affected (80%) ,080, , ,400,000 Pakistani refugees (28%) 35, ,980, Prolong IDP's (75%) 6 288, ,972, , ,900,000 Severely food insecure Afghans (70%) 7 550, ,166, , ,010,000 Cost of the coordination for FSAC (100%) , , ,954,75 Budget for food and livelihoods 1 109,520,000 1,048,000 20,960,000 Total Budget for 2.5 million target 130,480,000 % Budget Food assistance % 84 Livelihoods assistance % 16
6 Documents already shared with partners - FSAC part of humanitarian need overview. - FSAC excel table on number of people in need and number of people targeted. - FSAC response log frame with objective, activities, indicators, targets and budget. - FSAC response plan 2017 (narrative for HRP) - FSAC activity wise budget and targets, activity cost and implementation plan.
7 Monitoring plan and detailed response strategy
8 Next year planning What need to done! Monitoring plan for Frequency of the reporting (monthly or quarterly) - Output indicators and outcome indicators both need reporting so how partners will collect data against it. - Do we need to harmonize assessment tool and monitoring tools to capture that data at baseline and in PDM s. - Are we satisfied with the indicators in response plan. - Beneficiary targeting criteria Cluster response guidelines: - Agreement on updates food basket cost - Agreement on livelihoods package cost. - Agreement on the target areas as mentioned in HNO. - Agreement on the activities
9 Partners update (MEDAIR and Mission East)
10 Medair Medair Project Update Rina Mattinson, Medair Project Coordinator November 2016
11 Project Overview: Food security support for farmers affected by flooding and wheat crop losses in Bamyan Province Project dates 1 st Oct 2016 to 30 th June 2017 Cash transfer: $150 for 2 months food Agricultural package Winter wheat, Urea & DAP Agricultural package Spring wheat, Urea & DAP Agricultural training 4 sessions Wheat rust affected farmers Panjab and Waras 1100 X X X incl 550 women Landless / female headed households Panjab and Waras 200 Flood affected families Panjab and Waras 230 Flood affected families Bamyan Central, Sayghan, Yakawlang, Khamard and Shibar 170 Total: 1700
 Survey for flood affected farmers commenced Panjab: Meetings with DAIL, the District Governor and 53 community FGDs 430 farmers affected by wheat rust registered and paid 100")
12 Activity Status Waras: Meetings with DAIL, the District Governor and 27 community FGDs 558 farmers affected by wheat rust registered and paid 83 vulnerable households registered and paid (additional 17 identified) Survey for flood affected farmers commenced Panjab: Meetings with DAIL, the District Governor and 53 community FGDs 430 farmers affected by wheat rust registered and paid 100 vulnerable households identified Survey for flood affected farmers commenced Other Districts Meetings and surveys to commence next week

13 Methods: HEAT and Assessment via Digital Data Collection HEAT Survey used for 10% of Household Assessments Modified shorter version of HEAT used for remaining 90% of surveyed households. Agriculture and vulnerability questions added to both for determining beneficiary selection criteria HEAT, Verification, and Registration all completed on tablets using ODK


14 Methods: Registration, Distribution and Verification

15 Benefits of Digital Data Collection Efficiency and speed of data collection, translation, and entry giving project staff time to focus on project quality Reduces errors in data entry Fast turn-around time from assessment to beneficiary selection which is relevant for emergency response Improves reporting and accountability Drives faster decision making based on more reliable data. Engaging for Stakeholders (donors, partners, HQ, etc.)

16 Challenges of Digital Data Collection Using offline system and managing battery life in remote areas with no reliable internet/power sources HEAT Survey more relevant for displaced populations and relevancy of questions/wording New use of technology for Medair in Afghanistan Ensuring protection of beneficiary data Maintaining awareness or security & cultural issues with tablets


17 Survey Results: Crop Losses


18 Survey Results: Number of Complete Meals per day

19 Survey Results: Current Food Stocks


20 Survey Results: Distance to Market and Access Market Access Market Access all Year


21 Thank you Medair
22 Mission East short information about 3 remote districts of Baghlan province - 3 remote districts are not accessible from Baghlan side asking National FSAC partners if they are interesting to work in these districts. - Security situation in all 3 districts is good and stable. - Market: The prices of materials are about 20-30% higher than Taloqan city because of transportation cost. - Hazard & disaster: all 3 districts are prone to natural disaster like an avalanches, flash flood & drought. In 2014/2015 flood badly affected Guzargah-e-Nur & Freng - ME recommends conducting of food security survey in all 3 districts to identify their short term and long term needs. - NGOs activities: ME is the only NGO currently active in all three districts.
23 Presentation on Global Hunger Index

24 Global Hunger Index 2016 Presenter Golam Sarowar Talukder Project Advisor Deutsche Welthungerhilfe e.v. Kabul, Afghanistan 16 November, 2016


25 Content Global Hunger Index-GHI How are the GHI scores calculated? What are the main results of the 2016 GHI? Hunger and Nutrition Commitments Index Getting to Zero Hunger: Policy recommendations Using the GHI at country level
26 Global Hunger Index (GHI) The Global Hunger Index (GHI) is a tool designed to comprehensively measure and track hunger globally, regionally, and by country. It is a multi-dimensional statistical tool used to describe the state of countries hunger situation. The GHI measures progress and failures in the global fight against hunger. The GHI is updated once a year. The Index was adopted and further developed by the International Food Policy Institute (IFPRI). First published in 2006 with the Deutsche Welthungerhilfe e.v., a German non-profit, international development organization. Since 2007, Concern Worldwide, Irish NGO, joined the group as copublisher.

27 HOW IS THE GHI CALCULATED?

28 Composition of Global Hunger Index GHI MEASURES THREE DIMENSIONS FOUR COMPONENTS OF HUNGER

29 Child under-nutrition Normal height for age NORMAL WASTED Low weight for height STUNTED Low height for age
30 The GHI Severity Scale 9.9 low moderate serious alarming 50.0 extremely alarming This calculation results in GHI scores on a 100-point scale, where 0 is the best score (no hunger) and 100 is the worst. In practice, neither of these extremes is reached. An increase in a country's GHI score indicates that the hunger situation is worsening, while a decrease in the score indicates improvement in the country's hunger situation. The scale shows the severity of hunger from low to extremely alarming The 2016 Global Hunger Index (GHI) has been calculated for 118 countries for which data are available for the four indicators.

31 RESULTS


32 The 2016 Global Hunger by Countries The GHI was calculated for 118 countries this year 29 percent reduction globally since countries still suffer from serious levels of hunger No countries had extremely high scores this year for the second year in a row
33 Major Findings from GHI-2016 The level of hunger in the developing world has declined by 29 percent since BUT.still long way to go 795 million people still facing hunger roughly one in four children affected by stunting 8 percent of children affected by wasting. Afghanistan ranks 111 out of 118 countries in the GHI-2016
34 Global Hunger Index Scores GHI-2016: collected data from 118 countries Afghanistan ranks 111 globally, and 6 in South Asian Countries Ranks Country Nepal Sri Lanka Bangladesh India Pakistan Afghanistan Maldives Bhutan

35 Progress in reducing GHI scores % changed 2016 compared with 2000 GHI Progress has been made in all countries 22 countries GHI scores by 50% or more. 70 countries showed considerable reductions, between 25% and 49.9%. 22 countries decreased their scores by less than 25%. Rwanda, Cambodia, and Myanmar have seen the largest percentage reductions
36 Bad News: Getting To Zero Hunger RANK 2016 RANK 2015 COUNTRY GHI SCORE 1 1 Central African Republic Chad Zambia Haiti Madagascar Yemen Sierra Leone 35.0 Seven countries still suffer from levels of hunger that are alarming. The high hunger levels in these countries is due to conflict and fragile states Haiti and the Republic of Yemen also have alarming levels of hunger.

37 Sustainable Development Goal: Getting To Zero Hunger
38 Getting To Zero Hunger Sustainable Development Goal (SDG)-2 envisages Zero Hunger by 2030 Goal 2: To end hunger, achieve food security and improved nutrition, and promote sustainable agriculture. Global Hunger Index provides systematical analysis of data annually on gradual progresses and failures towards achieving SDG -2
39 Hunger and Nutrition Commitments Index (HANCI)-2016 The Hunger and Nutrition Commitment Index (HANCI) ranks government on their political commitments to tackling hunger and under-nutrition. High Commitment Moderate Commitment Low Commitment 1. Peru (38) 2. Guatemala (38) 3. Malawi (38) 4. Madagascar (35) 5. Brazil (35) 6. Philippines (35) 7. Burkina Faso (35) 8. Nepal (34) Very Low Commitment 30. Pakistan (23) 31. Zambia (23) 32. Cambodia (22) 33. Liberia (22) 34. Congo, DR (21) 9. South Africa (33) 10. Indonesia (31) 11. Rwanda (31) 12. Senegal (31) 13. Vietnam (31) 14. Bangladesh (31) 15. Gambia (31) 16. Mali (30) 17. Ghana (30) 18. India (30) 19. Tanzania (29) 20. Kenya (29) 35. Togo (19) 36. Mauritania (18) 37. Burundi (18) 38. Afghanistan (17) 39. Lesotho (16) 21. Benin (28) 22. Uganda (28) 23. Niger (27) 24. Cote d Ivoire ((26) 25. Ethiopia (26) 26. Sierra Leone (25) 27. China (25) 28. Mozambique (24) 29. Cameron (23) 40. Nigeria (16) 41. Myanmar (15) 42. Yemen (15) 43. Angola (12) 44. Sudan (12) 45. Guinea-Bissau (11)
40 How can we achieve Zero Hunger? By ending rural poverty and empowering women By transforming agriculture and food systems in a way that makes them inclusive, resilient, and sustainable; and By preserving ecosystems and natural resources.
41 Policy Recommendation-1 Make a Whole-of-Government Commitment to Zero Hunger Integrate actions to deliver Zero Hunger into national development plans. Coordinate across key sectors and programs, including agriculture, nutrition, health, social protection, education, and WASH. Promote healthy, diversified, and sustainable diets through agricultural, environmental, and social policies that influence what food is produced and consumed.
42 Policy Recommendation-2 Transform Our Food Systems to Transform Our World Sustainably increase the agricultural productivity of smallholder farmers by securing access to land, markets, knowledge, and financial services Improve infrastructure, technology, transportation, and distribution systems to minimize food loss, and develop effective policies to reduce food waste and conserve natural resources. Prioritize agricultural production for food and nutrition security over the production of biomass for energy and material use in all agricultural policies.
43 Policy Recommendation-3 Leave No One Behind Ensure national and international policies and programs are designed to improve the food and nutrition security of the most excluded population groups. Strengthen the political, economic, and social participation of women and other excluded groups. Address the structural inequalities that exist within international trade and financial systems
44 Policy Recommendation-4 Measure, Monitor, and Hold to Account International organizations and governments must support the collection of independent fully disaggregated data. In industrialized countries, indicators need to be developed to assess the impact of their policies at a global level, particularly in the Global South. International and civil society must hold governments to account by holding participatory and transparent follow-up and review processes.


45 Thank you! Welthungerhilfe For a world without hunger 45
46 Presentation on current Agro climatic condition of Afghanistan


47 Famine Early Warning Systems Network Agroclimatic Updates November 16, 2016 / FSAC Meeting Kabul, Afghanistan
48 OUTLINE 1. CURRENT AGROCLIMATIC CONDITIONS 2. WEATHER FORECAST 3. ASSUMPTIONS FAMINE EARLY WARNING SYSTEMS NETWORK 48
49 CURRENT AGROCLIMATIC CONDITIONS FAMINE EARLY WARNING SYSTEMS NETWORK 49


50 Dry Start of the wet season 30-Day Precipitation 30-Day Precipitation Anomaly FAMINE EARLY WARNING SYSTEMS NETWORK 50
51 Poor start of wet season delayed cultivation FAMINE EARLY WARNING SYSTEMS NETWORK 51

52 Poor start of wet season delayed cultivation FAMINE EARLY WARNING SYSTEMS NETWORK 52
53 Observations from field North Region: Wheat cultivation in irrigated areas started Rainfed areas have not been cultivated so far due to lack of precipitation Northeast Region: Wheat cultivation in irrigated areas started Rainfed areas have not been cultivated so far due to lack of precipitation FAMINE EARLY WARNING SYSTEMS NETWORK 53
54 Observations from field West Region: Wheat cultivation in irrigated areas started Rainfed areas have been cultivated but less compared to normal years due to lack of precipitation Southwest Region: Wheat cultivation in irrigated areas started Southcentral Region: Wheat cultivation in irrigated areas started FAMINE EARLY WARNING SYSTEMS NETWORK 54
55 Observations from field Central Highland Region: Wheat cultivation in irrigated areas started East Region: Wheat cultivation in irrigated areas started In conflict affected areas wheat cultivation has not taken place yet FAMINE EARLY WARNING SYSTEMS NETWORK 55
56 WEATHER FORECAST LONG TERM FAMINE EARLY WARNING SYSTEMS NETWORK 56

57 December-February Precipitation Forecast FAMINE EARLY WARNING SYSTEMS NETWORK 57

58 December-February Temperature Forecast FAMINE EARLY WARNING SYSTEMS NETWORK 58
59 March-May Precipitation Forecast FAMINE EARLY WARNING SYSTEMS NETWORK 59

60 March-May Temperature Forecast FAMINE EARLY WARNING SYSTEMS NETWORK 60
61 WEATHER FORECAST SHORT TERM FAMINE EARLY WARNING SYSTEMS NETWORK 61


62 Dry Next Two Weeks Week 1 Forecast Week 2 Forecast FAMINE EARLY WARNING SYSTEMS NETWORK 62
63 ASSUMPTIONS FAMINE EARLY WARNING SYSTEMS NETWORK 63
64 Assumption 1 Due to below-average SSTs in the eastern equatorial Pacific and above-average temperatures in the western Pacific, cumulative precipitation in Afghanistan is expected to be average to belowaverage for the October 2016 to May 2017 wet season, particularly in southern and eastern parts of the country. This is expected to lead to below-average snowpack for irrigation of winter wheat and below-average rainfall for rainfed spring wheat in most regions, with the exception of areas in the northcentral part of the country. FAMINE EARLY WARNING SYSTEMS NETWORK 64
65 Assumption 2 During the beginning of the wet season from November - January, average to below-average precipitation is expected throughout Afghanistan. FAMINE EARLY WARNING SYSTEMS NETWORK 65
66 Assumption 3 During the peak of the wet season from February through April 2017, there remains an elevated probability for average to below-average precipitation in southern and eastern Afghanistan. However, average to above-average precipitation is expected in northern Afghanistan during this period. FAMINE EARLY WARNING SYSTEMS NETWORK 66
67 Assumption 4 Due to climate change, temperatures in recent years in Central Asia are typically above the long-term average. However, nearsurface air temperatures throughout the outlook period (November 2016 May 2017) are also likely to be above the short-term average of recent years. This could have varying impacts depending on the region, including the possibility of a mild winter. However it could also drive below-average snowpack and early spring melting, with possible increased chances of flooding from February-April FAMINE EARLY WARNING SYSTEMS NETWORK 67

68 Thanks for being with us. FAMINE EARLY WARNING SYSTEMS NETWORK 68
69 AOB FSAC partners presence 3w map Proposal and report writing training in Hirat Next Meeting
70


71 AOB Proposal and report writing training in Hirat Next Meeting