Wisconsin Report. Victor E. Cabrera
|
|
|
- Jessie Cross
- 5 years ago
- Views:
Transcription

1 Wisconsin Report Victor E. Cabrera
2 Daily Markov Chain for Repro Evaluation Compare economic and reproductive performance of programs combining timed artificial insemination and different levels of AI estrus detection. Giordano, J. O., A. Kalantari, P. M. Fricke, M. C. Wiltbank, and V. E. Cabrera A daily herd Markov-chain model to study the reproductive and economic impact of reproductive programs combining timed artificial insemination and estrous detection. Journal of Dairy Science 95:
3
4 Cows Pregnant (%) TAI1 TAI+ED 4 TAI+ED 10 TAI+ED DIM
5 Net Value Difference ($/cow per yr) % CR % CR Reproductive Program % CR
6 A Heifer balance 300 DIM cutoff New cutoff DIM 35% CR Net Value ($/cow per yr) % TAI 25% CR 30% CR
7 Daily DP and Daily MC Determine the effect of reproductive performance under optimal replacement policies. Herd Value = herd s average retention pay-off (RPO). Kalantari, A. S., and V. E. Cabrera The effect of reproductive performance on the dairy cattle herd value assessed by integrating a daily dynamic programming with a daily Markov chain model. Journal of Dairy Science 00: In Press.
8
9
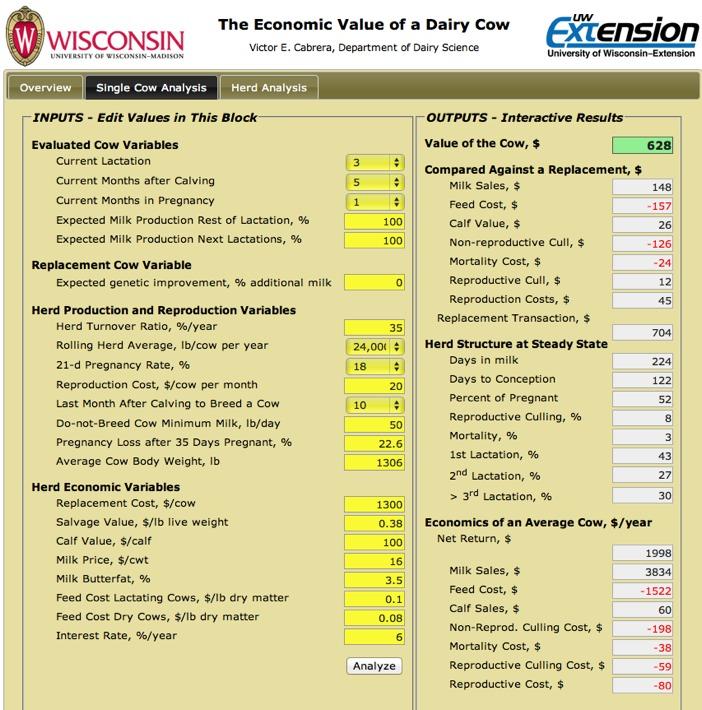
10 Simple Formulation of Cow Value Find a simple algorithm to calculate the cow value and apply it to a decision support system. Cabrera, V. E A simple formulation and solution to the replacement problem: A practical tool to assess the economic cow value, the value of a new pregnancy, and the cost of a pregnancy loss. Journal of Dairy Science 95:

11 MIM How to calculate the cow value? Markov chains to simulate herd dynamics PAR b dnb MIP Replacement Cow Cow Value Cabrera, 2012

12

13 $300 Cow Replacement PAR=3, MIM=5, MIP=1 $225 Cow Value = $625 $150 $75 $0 Months in the future
14 Earlier Chemical Pregnancy Test Assess the economic value of decreasing the interval between services and the impact of inaccuracies of earlier chemical tests Giordano, J. O., P. M. Fricke, and V. E. Cabrera. Accepted. Economics of resynchronization strategies including chemical tests to identify non-pregnant cows. Journal of Dairy Science 00:00-00.
15
16
17 Specificity (%) Sensitivity (%) AIED (%)
18 Animal Density and Green House Gas Test the impact of animal density on GHG on 3 different dairy production systems in Wisconsin Dutreuil, M., V. E. Cabrera, R. Gildersleeve, C. A. Hardie, and M. A. Wattiaux Impact of animal density on predicted greenhouse gas emission on selected conventional, organic, and grazing dairy farms in Wisconsin. Journal of Animal Science 00 (E-Suppl. 1):00.
19 Farm system type Non organic or grazing Organic Grazing Density Current Double Current Double Current Double Number of cows Stocking, cow/ha Milk, kg/cow/year 25,725 25,544 10,480 10,480 11,002 11,002 Forages, ha Alfalfa, ha Grass, ha Corn, ha
20 read input start Integrated Farm System Model machinery file farm parameters till crop initialization setup machinery harvest grazing storage cows feed weather data read weather data spring operations crop growth crop harvest storage cow feeding fertilizer soil manure milk cow management manure handling output files yes another year? no fall operations economic analysis results
21 Farm system type Non organic or grazing Organic Grazing Density Current Double Current Double Current Double PGHGE (kg CO2 eq /kg milk) (% total PGHGE) Housing Manure Feed Grazing CO Fuel Secondary sources
22 Profitability Cluster Analysis Characterize and understand main factors associated with profitability on Wisconsin dairy farms Dutreuil, M., V. E. Cabrera, R. Gildersleeve, C. A. Hardie, and M. A. Wattiaux A cluster analysis to describe profitability on Wisconsin dairy farms. Journal of Animal Science 00 (E-Suppl. 1):00.
23 Factors Affecting Profitability C CG C CO O OG C GC C CO C CG C C Distance Cluster 2 Cluster 3 Cluster 1 0:1:4 3:1:2 1:2:6
24 Cluster 1 Cluster 2 Cluster 3 Total acres Age of the respondent Number of cows Milk production (lbs/cow/year) 15,517 23,630 9,104 Fat content (%) Protein content (%) SCC (x1,000 cells/ml) Milk price ($/cwt) % milk not sold Total DMI in winter (lbs/cow/day) % grass/legume silage in winter % hay in winter % corn silage in winter % concentrates in winter % vitamins and minerals in winter IOFC in winter ($/cow/day)
25 Cluster 2 Productive efficient, $8.09 IOFC Large land and herd size Highest milk productivity Highest concentrate in diet Poorest milk composition Lowest milk price Cluster 1 Intermediate, $5.97 IOFC Largest land base Intermediate milk productivity, composition and price, highest DMI Intermediate levels of ingredients Cluster 3 Low input, $5.22 IOFC Smallest land and herd size Lowest milk productivity Lowest DMI Best milk composition Best milk price


26 Thanks 2011 Wisconsin Milk Marketing Board, Inc.