FAO International Technical Consultation on Low Levels of GM Crops in International Food and Feed Trade
|
|
|
- Branden Chapman
- 5 years ago
- Views:
Transcription


1 FAO International Technical Consultation on Low Levels of GM Crops in International Food and Feed Trade FAO, Rome March 2014
2 Global market context Short term market movements Medium term projections Policy challenges Trade policy and global market impacts Analyzing the effects of LLP/AP on trade flows Patterns of LLP/AP incidents Econometric analysis Looking forward Further research needs
3


4 Market assessments Market indicators Major policy developments
5
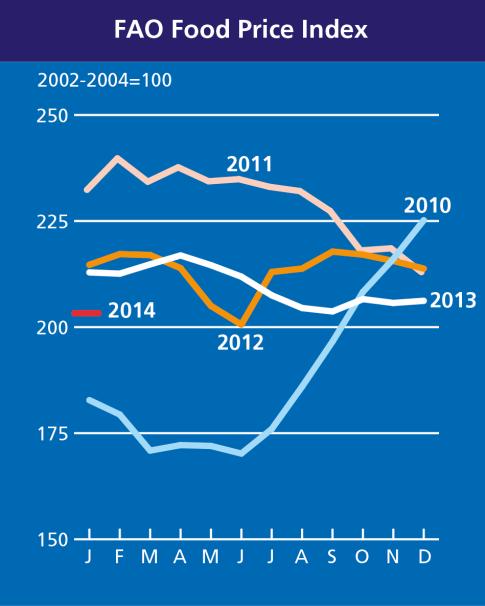
6 FAO Food Price Index Nominal Price Index Deflated Price Index 0.0 6

7 Joint OECD-FAO report Model based projection, not forecast 10 year horizon Major temperate commodities Global coverage
8 GDP growth Recovery at different paces Population growth Urbanisation, changing diets Oil prices Exchange rates Market and trade policy Trends, assumptions

9 20% 10% 0% -10% -20% -30% -40% -50% -60% -70% Projected change between 2010/ Egypt South Africa Brazil Japan EU India China Rus. Fed. Indonesia Argentina 9
10 Growth in global agricultural production is slowing - projected at 1.5% annually in coming decade Consumption increasing But response to income growth is low in many countries Strong prices (expected to remain firm) are prompting investments into production capacity and technology (but not by all) Constrained by structure of agriculture, high energy costs, limitation on land and water, tighter environmental regulations Emerging economies remain agricultural growth leaders 10
11 Index = 1 in W.Europe N.America Oceania E.Europe&C.Asia N.Afr&M.East SSA O.Asia L.America 0.8 Index based on constant dollars

12 2000 = OECD BRICS LDC RestofWorld China Index of consumption based on constant 12

13 90% 80% 70% 60% 50% 40% 30% 20% 10% 0% 1% 81% 66% 42% 41% 37% 35% 15% 9% 11% 6% 8% 9% 8% 6% 2% OECD BRICS LDC Rest of World Consumption change Income change Consumption change Income change
14 USD /t Rice Coarse Grains Wheat Oilseeds 14

15 Billions of Constant $ N.America L.America Oceania W.Europe E.Europe&C.Asia SS Africa MENA Other Asia -60
16 USD million Cereal import bill 2001/ /14 e LDCs NFIDCs /14e 2012/13e 2011/ / / / / / / / / / /02 Commercial cereal import and food aid volumes 60 (NFIDC+LDC) 50 % / / / / / / / / / / / /13e 2013/14e Food aid (% total imports) Commercial Imports (% change over 2001/02)
17 Food security Availability, access and stability concerns. Greater focus on domestic markets in pursuit of national FS objectives Exporters: Export restrictions to moderate domestic price increases Importers: Tackling higher food import bills Productivity increases/food self-sufficiency more in focus Enabling higher response by smallholders more in focus Importance of stage of development now recognized But trade policy is not just about Food Security - Minimizing rural-urban income differentials - Export led growth: getting the balance right And trade barriers are not just tariffs Food safety TBT
18 Impact on global markets determined by: Way in which increase in production handled by producing country Size of any surplus that finds its way onto the international market Characteristics of that market... Extent to which other countries are affected by a change in global market conditions depends on their own trade status: Food exporter country s exporting firms may face reduced prices with implications for the farmers from which they source Food importer fall in price may be positive development if the country is in a structural deficit for agroclimatic reasons; but may be less positive for a country with ag potential
19

20 Number Linseed Rice Rice Cracker and noodle Maize Papaya Petfood Soybean and Soybean Products Soybean Canola and oil seed Other
21 Gravity-type bilateral export flow model: Assumes that bilateral trade between partner countries increases with size (income, population) and closeness Cross-sectional data Introduce GMO regulation index and LLP threshold lne ij = lnα + β 1 lny i + β 2 lny j + β 3 lnd ij +β 4 lnreg-index j +β 5 lnllp j +ln ɛ ij

22 GMO regulation index of importing country - Reg-Index j existence of food, feed, and environmental regulation safety risk assessment labelling requirement LLP test requirement traceability requirement socio-economic assessment existence of zero tolerance for unauthorized GM crops food, feed, and environmental safety assessments to international guidelines restrictiveness of authorization policy testing requirement form exporting country technical capacity to detect GMOs detection methods utilized LLP threshold of the importing country - LLP j Model 3 - LLP variable takes either the value 0.1, or 10 for countries that do not have the threshold. Model 4 - LLP threshold takes into account reported threshold levels and combination of factors - zero tolerance and existence of GMO regulation. Model 5 - LLP variable takes the value 0.1 for the EU members, and 1 for other countries, controlling for EU internal trade.

23 Norway Austria Bulgaria Cyprus Denmark Estonia Finland France Germany Ireland Italy Latvia Luxembourg Netherlands Slovakia Slovenia Spain Sweden Czech R. Samoa Mongolia Canada Namibia Hungary Togo Argentina Japan Malaysia New Zealand Mozambique Thailand Croatia Australia Lao PDR Brazil Colombia Cuba Philippines US Costa Rica Mali Bangladesh Gambia Lithuania Sudan Bolivia Iran Madagascar Ecuador DR Congo Honduras Jamaica Botswana Barbados Myanmar Qatar Cape Verde Niger Seychelles Bahamas Cambodia Dominican R. El Salvador Somalia GMO Regulation Index
24 Variable [Model 1] (GMO regulation impact) Constant ( 3.43***) Ln-Y i 1.00 (10.20***) Ln-Y j 0.84 (9.23***) Ln-GDPC i 1.70 ( 7.72***) Ln-GDPC j 0.56 ( 3.43***) [Model 2] (GMO regulation impact) ( 3.43***) [Model 3] (LLP impact) [Model 4] (LLP impact) [Model 5] (LLP impact) ( 3.99***) ( 3.98***) ( 1.89*) 0.69 ( 3.76***) 0.69 ( 4.08***) 0.68 ( 3.94***) 0.64 ( 3.68***) 0.28 (2.10**) Ln-P i (10.21***) (10.47***) (10.23***) (6.62***) Ln-P j (9.23***) (9.39***) (9.44***) (8.80***) Ln-D ij ( 8.68***) ( 8.68***) ( 8.20***) ( 8.35***) ( 7.17***) Ln-Reg-Index j ( 1.70*) ( 1.70*) Ln-LLP j ( 1.48) ( 1.48) ( 2.10**) R F 28.21*** 28.21*** 32.63*** 33.10*** 26.03*** Schwarz B.I.C N
25 Regulation variable is negative and significant at the 10 percent level. Implies that a more restrictive GMO regulation has a deterrent effect on maize trade flow. Models 3 and 4 indicate that LLP does not have a significant impact on trade flows Model 5 (lower threshold) suggests that the impact of LLP on trade flows may be significant, but not necessarily trade distorting. The inclusion of fixed effects yielded similar results for the regulation index, but the LLP variable became positive (but significant only at the 10 percent level).
26
27 Numbers
28 Improved datasets required on: policies on GMOs existing between trading partners different timings for approvals etc Further studies examining the impacts of regulations and threshold levels on global trade in the context of multiple products When limitations of datasets overcome, impact of regulations should be analyzed in a dynamic setting