Drought Prediction San Diego Meeting April 29 - May 1, 2013
|
|
|
- Richard Page
- 5 years ago
- Views:
Transcription
1 Drought Prediction San Diego Meeting April 29 - May 1, 2013 Potential Interstate Cooperation on Irrigation Scheduling Data Kent Frame Program Manager II California Department of Water Resources (DWR) Division of Statewide Integrated Water Management Water Use & Efficiency Branch 1
2 Problems In California Population is projected to increase to 59.5 million by Urban water demand is estimated to increase. Agricultural water demand is expected to decline slightly because of a reduction in agricultural acreage. Environmental water demand is expected to increase. Short Supplies 2
3 Implications? There will be an increase in demand and competition for limited water supplies. Water conservation, an efficient use of water by avoiding unnecessary and wasteful uses, can mitigate the problem. Planning water management planning and WUE can help prepare and mitigate 3

4 Evapotranspiration ET loss of water to the atmosphere by the combined processes of evaporation (E) and transpiration (T). The California Water Plan Update estimates that 65% of the average 200- maf annual precipitation in California is consumed through ET. That is why DWR, in cooperation with UC Davis, developed CIMIS in the 1980s. 4

5 What is CIMIS? CIMIS a network of over 140 fully automated weather stations that collect weather data and provide estimates of reference evapotranspiration (ETo) to the users. Reference Evapotranspiration - ET from standardized grass (ETo) and/or alfalfa (ETr) surfaces. 5
6 GERBER STATION CIMIS California Irrigation Management Information System 6

7 7

8 8

9 9

10 10

11 Weather Station 11
12 12
13 13
14 14
15 15
16 16
17 17
18 18
19 19
20 Lightning Rod Wind Direction Sensor Wind Speed Sensor Data Logger Power Supply ENC 12/14 Enclosure Rain Gauge 20
21 21
22 22
23 23
24 24
25 25
26 26
27 27
28 28

29 29
30 Li-Con Silicon Pyranometer L1200x Gill Radiation Shield Temperature and Relative Humidity Probe 30
31 31
32 32

33 33

34 Solar Panel Grounding Rod 34

35 35

36 36

37 37
 and Kc or Plant Factor")


38 Reference Evapo-transpiration (ETo) and Kc or Plant Factor Water Use Classification of Landscape Species 38 (WUCOLS)

39 For What Purposes? Irrigation scheduling. Pest management. Air quality monitoring. Engineering designs. Weather forecasting. Research. Planning. Drought monitoring & Mitigation. Water use billing 39
 Crop production efficiency - crop/drop (Tons per acre-foot applied water) Increased 38% (32 crops 1980-2000) Economic efficiency -- $/drop (Adjusted $ per acre-foot applied")
40 Describing Ag Water Use Efficiency Reduction in water use -- AW or NW Ag AW decreased 14.5% ( ) Crop production efficiency - crop/drop (Tons per acre-foot applied water) Increased 38% (32 crops ) Economic efficiency -- $/drop (Adjusted $ per acre-foot applied water) Increased 11% ( ) Increased 115% ( ) Quantifiable Objectives & Targeted Benefits 40 40

41 Registered Primary Users. Registered CIMIS Data Users Over 2 million requests for data per month in


42 CIMIS station locations & Network Spatial data gaps exist. 42
. Geostationary Operational Environmental Satellites (GOES) were selected.")
43 The Spatial CIMIS CIMIS initiated a project with the UC Davis to explore the potential for using remotely sensed data for the estimation of ETo (to mitigate the spatial data gap). Geostationary Operational Environmental Satellites (GOES) were selected.
44 ETo Estimation (cont.) ETo Equation ( Rn G) u2( es ea) ETo T 273 (1 0.34u ) 2
 at")

45 Spatial CIMIS System Statewide ETo and Solar Radiation (Rs) at a 2km resolution. Request data by Coordinate, Address, or Zip Code.
 Spatial CIMIS")
46 CIMIS Data Providers CIMIS Weather Station Network (WSN) Spatial CIMIS System (SCS)

47 Data Types by Data Provider

48 An application programming interface (API) is a protocol intended to be used as an interface by software components to communicate with each other
49 Opportunities CIMIS is now ready to explore expanding Spatial CIMIS Is there interest and the market? Opportunities for data sharing? Propose pilot project with neighboring states shared regional interests 49
50 Some Possible Partnerships Minute 319 to the 1944 Treaty with Mexico USBR Water Smart Basin Studies NIDIS WSWC, WGA AZMET, AgriMet, and NICE
51 Potential Benefits Established Infrastructure Is a production model (not experimental) Resource Sharing Standardized data protocols and technology Utilization of data dissemination prototype 51

52 Mexicali, Yuma, Blythe Regions CIMIS/AZMET

53 Reno & Minden Valleys Truckee Carson Basins CIMIS/NICE

54 Klamath River Basin CIMIS/AgriMet

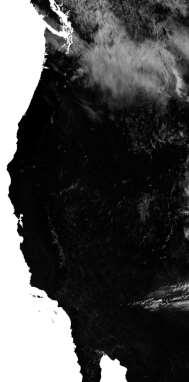

55 Clouds


56 Cloud Daily Aggregation :00 12:00 16:00 Aggregation

")

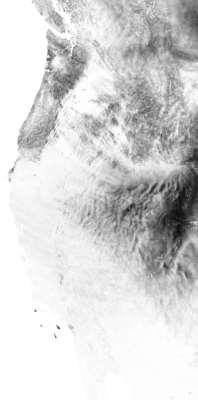
57 Clear Sky Factors (Bright = clear)

58 Solar Radiation
59 Solar Radiation Using 3 years worth of data for comparison, the GOES Rs was higher by only 2% with an R 2 of

60 USBR Pacific Northwest, Mid Pacific, Upper & Lower Colorado Regions AgriMet/NICE AZMET/CIMIS
61 Issues to be addressed for Interstate Data sharing CIMIS is currently funded by California tax payers. What will be the justification for DWR to get involved in such a project? Expanding Spatial CIMIS requires more resources (man power, hardware, software, etc). Who will be responsible for the additional resources? Once developed, who maintains the system? How is it presented to end users, in a centralized way or each state will be on its own? Who pays for continuous maintenance? What is the status of the weather station networks in each state? How about the station siting? Do they have plans to expand ground stations? Data formats. How do we plan to handle future refinements? Each state separately or together?
62 CIMIS Current & Future Plans. ETo forecasting, precipitation maps. Crop-coefficient (Kc) maps Tops-Sims cooperation with NASA. Terrestrial Observation and Prediction System (TOPS), The Satellite Irrigation Management Support (SIMS) Actual ET (ETc) maps. Interactive (web services) data delivery with improved features to automatically deliver data to any type of end user (ET controllers, data bases, PDA s, & etc..) Standard data prototype CIMIS Web API\ET - XML 62


63 TOPS-SIMS Overview Terrestrial Observation and Prediction System (TOPS), The Satellite Irrigation Management Support (SIMS) Objectives: Build data processing systems required to integrate data from satellites and surface observation networks in real-time to map crop coefficients and basal crop ET Develop new information products to support growers in managing irrigation Develop new information products to support water managers in making decisions about scheduling of water deliveries Approach: Builds on CIMIS and VSIM, and integrates satellite Kc maps with CIMIS ETo maps Standard approach for incorporating weather information into irrigation management practices ETcb = ETo * Kcb CIMIS satellite Processing Steps At sensor radiance LEDAPS Surface reflect. NDVI Fractional cover Kc * ETo ETc Satellite CIMIS Site info. Web browser Mobile TOPS Spatial CIMIS ET 0 March 31, Integration of satellite and surface observation networks


64 Satellite Imagery Landsat 5/7satellites pass over California every 8 days; daily overpass by MODIS Collect data at 30m/250m resolution Landsat 8 launched in 2013


65 From Bryla et al., 2010; Grattan et al., 1998; Hanson & May, 2006; Lopez-Urrea et al., 2009; Allen & Pereira, 2009 Deriving Indicators of Crop Conditions from Satellite Data R 2 = 0.96 USDA studies provide basis for linking NDVI to fractional cover, and fractional cover to crop coefficients for multiple crops Johnson & Trout, in review; Trout et al., 2008 Additional studies ongoing in collaboration with CSU Fresno and UC West Side Research & Extension Center R 2 = 0.90


66


67 Data Services Accessible via Excel
, Runtime = estimated irrigation runtime (hrs.")
68 Information Products: Summary Reports Sample TOPS-SIMS Report ETo = reference ET (in.), ETcb = crop water use (in.), Kcb = basal crop coefficient, SWB = soil water balance (in.), Runtime = estimated irrigation runtime (hrs.) to restore neutral soil water balance Currently obtaining input from growers on system design Will consider weather, soil texture, crop type, root depth, precipitation, prior irrigation amounts, method of application, and application rate. Parameters to include measures of within-field variability. Summary reports planned for delivery via text messages / PDFs sent to mobile devices.
69 User Requirements for Information Products Requirements for Kc/ETc mapping (from workshops with growers): Timely: available within hours of satellite overpass (system must be fully automated) Frequent: ETc updated daily, Kc updated at least every 8-16 days High resolution: must provide multiple measurements per field for fields 5 acres or larger Accessible: quantitative information available via web browers, mobile phones Easy to use: must be convertible to run-times for irrigation systems; compatible with other irrigation scheduling software
70 Validation Strategy 1) Comparison against other satellite-based estimates 2) Comparison against ET estimates from surface renewal stations 3) Use of wireless sensor networks to calculate a water balance and track relative changes in soil water content and soil water potential 4) Weighing lysimeter experiments 5) Grower interaction and feedback
71 Contacts Department of Water Resources Water Use Efficiency Office 901 P Street, Third Floor P.O. Box Sacramento, CA Kent Frame (916) kframe@water.ca.gov Bekele Temesgen (916) 651- btemesgen@water.ca.gov 71

72 Questions? THANK YOU 72

73 What is Currently Available? Daily ETo & Rs data map sets of CA Archived data from Feb kilometer resolution Data available through web services, CIMIS web site, or automated reports Can request data by geographic coordinate, address or zip code CIMIS Web API/ET-XML web services 73