2. NASA LCLUC: Mapping LCLUC and sensor fusion in South Asia
|
|
|
- Coral Harmon
- 5 years ago
- Views:
Transcription

1
: Support global food security programs, disaster management, and commodity markets with fused rice")
 and landscape accounting tools Presentation Outline A.")
2 Background Synergistic projects 1. NASA SBIR (NNX14CS01C).: Rice Decision Support System (RiceDSS): Support global food security programs, disaster management, and commodity markets with fused rice info from EO, weather, and crop models 2. NASA LCLUC: Mapping LCLUC and sensor fusion in South Asia 3. USAID: Developing GHG Monitoring, Reporting, and Verification (MRV) and landscape accounting tools Presentation Outline A. Multiscale rice mapping with snapshot examples in S. Asia and USA B. Modeling rice greenhouse gas (GHG) application in Red River Delta (RRD), Vietnam


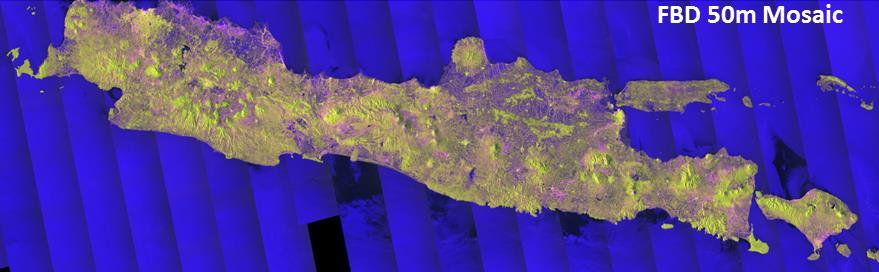
3 Red River Delta Multiscale Imagery HR / Google Earth Sentinel-1 IW Landsat 8 OLI PALSAR-2 WB1
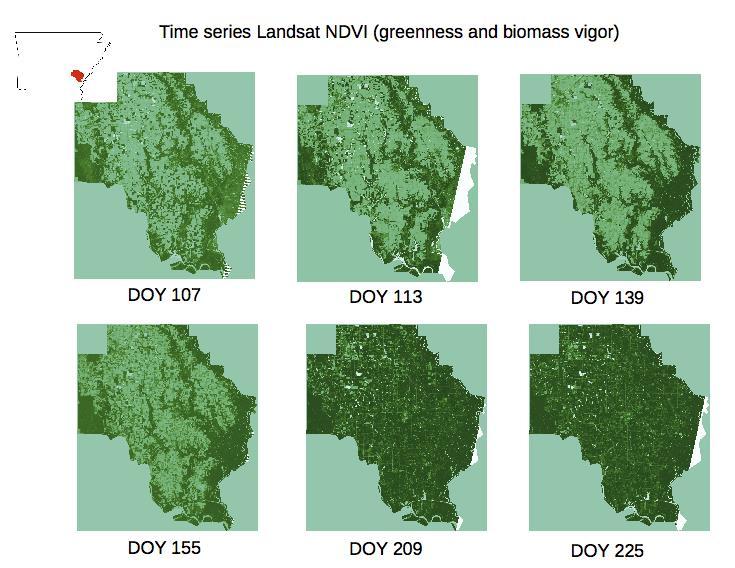
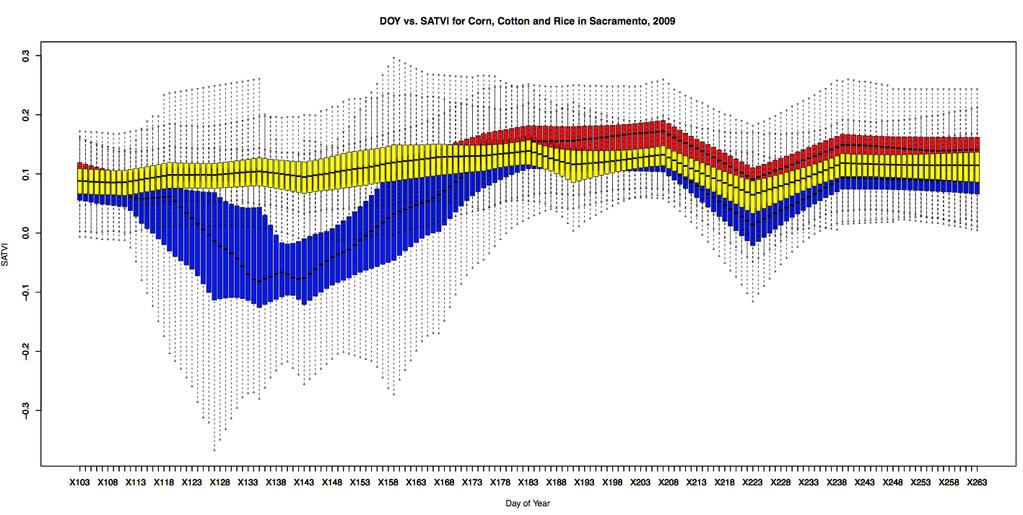
4 Multi-temporal remote sensing key for rice monitoring

5 Multi-scale Earth Observation integration work flow


6 Collecting field training data for cal val, Ground Truth, surveys Mobile Apps for Geofield photos; U. Oklahoma, Xiangming Xiao
7

8
9

10
11 Near real time comparisons against NASS Annual Producer Accuracy (left) and User Accuracy / Reliability (right) of real-time rice extent mapping routine using Landsat imagery from compared against NASS CDL for California.

12


13

14 The DNDC Model [gramp.org.uk] Background DNDC stands for DeNitrification-DeComposition DNDC is a soil biogeochemical model that has been used for quantifying GHG emissions from agricultural DNDC is a process (as know as mechanistic) model that simulates the biogeochemical processes to drive C and N cycling in agricultural soils. Long history of peer-reviewed publications (well over 200 publications). Use for Rice Emissions Modeling 1. What is the rice GHG footprint in RRD? 2. How can multiscale RS improve parameterization and spatiotemporal drivers? DNDC can simultaneously simulate anaerobic (flooded) and aerobic (non-flooded) conditions in soils. DNDC can model both Methane and Nitrous Oxide emissions: critical for rice agroecosystems. DNDC has been extensively validated for rice globally.
15 Rice: CH 4 production and emission (REDOX < -100 to -200 mv) DNDC Models 3 Pathways Plant mediated transport Ebullition, diffusion Soil out gassing CO 2 CH 4 CH 4 Ebulation CH 4 CH 4 CH 4 CH 4 +2O 2 CO 2 +2H 2 OCH 4 Methane oxidation Water Soil Methanogenesis CH 4 CH 4 CH 4 Labile C CO 2 +4H 2 CH 4 +2H2O source CH 3 COOH+H 2 CH 4 + CO 2 Slide from Will Horwath 15


16 Crops Tillage Irrigation Soils Fertilizer Manure Weather DNDC


17 Driving DNDC with Earth Observations for GHG Assessment LULC / Rice Extent Crop calendar (1st crop planting DOY) Legend 1st_crop_pd median Hydroperiod Intensity

18 RRD 2015 Rice CH 4 Emissions CH 4 (GgCH 4 -C/y) CH 4 GWP (GgCO 2 /y) DNDC ,515 mean ,788 IPCC low 243 8,087 Tier 1 high ,508
19 Summary PALSAR-2, Sentinel-1, Landsat 8 fusion high LULC accuracy Multitemporal required for mapping rice attributes Suite of parameters: extent, hydroperiod, intensity, calendar RRD GHG footprint characterized and uncertainty reduced with EO compared to IPCC Tier 1 approach Tuning & evaluating forecasts for select hot spots this upcoming year Open source tools, tech transfer, Decision Support Tools Transition research to operational domain github.com/applied-geosolutions Web-mapping, mobile, cloud,


20 Please let me know if you are interested in applications & coordination Thanks to our hosts, NASA SBIR, NASA LCLUC program. Questions?