Price. Rabi Crops THE MARKETING SEASON Commission for Agricultural Costs and Prices
|
|
|
- Clare Malone
- 5 years ago
- Views:
Transcription
1
2 Price policy for Rabi Crops THE MARKETING SEASON Commission for Agricultural Costs and Prices Department of Agriculture and Cooperation Ministry of Agriculture Government of India New Delhi July 2011 Vol. I
3


4 CONTENTS SECTION Page No. Summary of Recommendations i- iv I. An Overview 1-12 II. Six Rabi Crops in the Domain of MSP III. Costs, Profits, Inter-crop Price Parity and Terms of Trade IV. Recommendations for Price Policy for Rabi Crops Marketing Season 75-84
5
 move towards getting the markets right so that natural evolution of efficient functioning of markets is restored.")
6 Summary of Recommendations In recommending its price policy, the Commission is guided by two major considerations: (1) getting the prices right that can incentivize the farming community to adopt major technological change, boosting yields, and cutting down costs in due course; (2) move towards getting the markets right so that natural evolution of efficient functioning of markets is restored. In doing so, the Commission has kept in mind its basic terms of reference such as looking at the overall demand and supply of the commodity under question, its costs of production, domestic and international price situation currently prevailing and likely to be in the near future, inter-crop price parity, terms of trade between agriculture and non-agriculture and finally, the likely implications of price policy recommendations on the cost of living of the people, especially the poor. Price Policy Recommendations: After due deliberations, the Commission recommends the following MSP for the rabi crops to be marketed in season
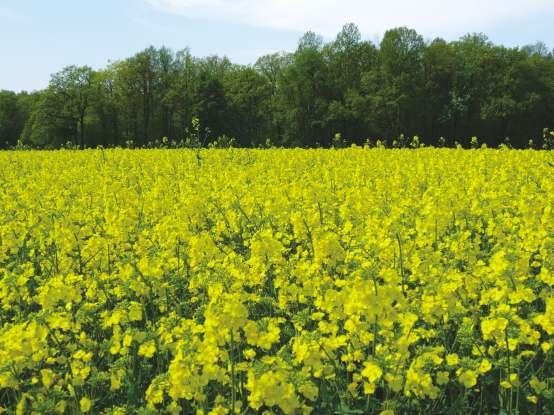
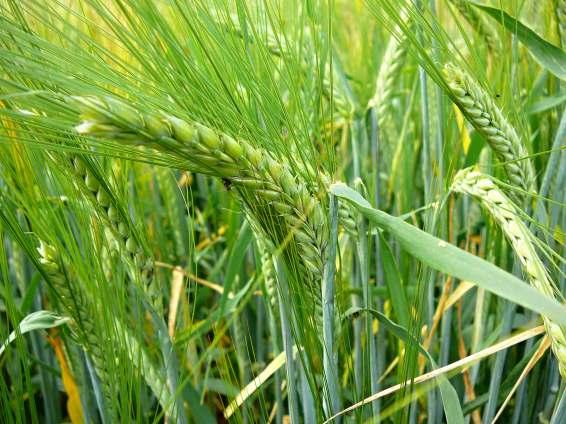
7 Crops Recommended Remarks and Rationale MSP (Rs/quintal) Wheat 1350 This recommended price is including all costs of acquisition (taxes, mandi fee, commissions, etc). It is presumed that these costs will be rationalized at a maximum of 5 percent, and a minimum net support price of Rs 1285/quintal will be passed on to the farmer Barley 980 This will bring about parity with other nutri-cereals like jowar, bajra and maize whose MSP is already at Rs 980/quintal Gram 2800 To bring it nearer to the MSP of Kharif pulses, which are already between Rs 3200 for tur to Rs 3500 for moong. Lentil 2800 To bring parity with MSP of gram, and bring nearer to MSPs of kharif pulses Rapeseed Mustard Edible oils imports crossed Rs 29,000 crores in , and global prices of edible oils went up by more than 45 percent. Rapeseed-mustard, our biggest oil crop, needs major increase in incentives. Groundnut and sunflower MSP already at Rs 2700/q and Rs 2800/q respectively. Safflower 2500 Bringing parity with rapeseed-mustard It is important to note the remarks, especially those tagged to the recommended MSP for wheat. The recommended MSP for wheat at Rs 1350/quintal is inclusive of all costs of acquisition such as purchase tax, mandi fee, artiha's commission, or any cess imposed. The Commission presumes that these costs are kept at a maximum of 5 percent, and the farmers will get at least a minimum of Rs 1285/quintal, which is roughly 10 percent above the price paid (Rs 1170/quintal (Rs )) in the last season. This would entail some revenue loss to some states who are imposing unduly high taxation on a primary commodity like wheat which the poorest of the poor is supposed to consume. The Commission recommends that the Centre should get engaged with the state governments, most notably Punjab and Haryana, on this issue and compensate them for the loss in revenue through a separate channel. High taxes and commissions (Punjab at 14.5 percent and Haryana at 10.5 percent) on MSP for wheat have driven the private sector literally out of the markets in these states, and the costs of procurement by public agencies are becoming prohibitively high. This is not a healthy sign, the Government needs to restore the efficient functioning of markets where there is ample competition. This recommendation, if accepted, will go a long way in getting the markets right. Another point to be noted is in case of Rapeseed-Mustard and Gram. In case of edible oils, our ii
8 imports crossed Rs 29,000 crores in and pulses imports touched Rs 7000 crores. Rapeseed- Mustard is our biggest oil crop and Gram is our biggest pulse. Both need major revision in MSP to incentivize our farmers to produce more of edible oils and pulses so that import bills are contained within reasonable levels. And this needs to be done keeping in mind our comparative advantage visà-vis imports. The Commission believes that currently both these commodities are reasonably competitive and their competitiveness can be further strengthened with adoption of better technology, and luckily better technologies (seeds) are available on the shelf. What is needed is a better incentive environment on the pricing and marketing front for these technologies to spread on a wider scale. Non-Price Recommendations: The Commission further recommends that (1) The MSP policy of the Government can have credibility only when it has an effective and supporting procurement mechanism. The last season saw market prices of wheat going below MSP in several states by a margin of 10 to 15 percent, most notably in Bihar, eastern Uttar Pradesh and many parts of Gujarat. The government procurement machinery was either absent or very slow, and the private sector did not come forward in any major way given the ban on exports of wheat and stocking limits in several states. At the end, farmers suffered. The Commission, therefore, recommends that (a) exports of durum wheat (like basmati rice) be always kept open; (b) FAQ wheat up to 3 million tonnes could be kept open for exports; (c) Cooperative societies, private sector companies, and NGOs working in rural areas can be invited to procure on government behalf, wherever govt agencies find it difficult or expensive to reach for providing a floor price to farmers; (d) these agencies can be invited to massively and quickly scale up the warehouse receipt system under PPP mode. This can take the pressure off the procurement agencies; and finally (e) those farmers in Bihar, eastern UP and Saurashtra region of Gujarat who sold their wheat at percent below the MSP should be given cash compensation through the National Food Security Mission to the tune of Rs 2500/hectare. Modalities of this can be worked out once the recommendation is accepted by the government. This will help re-establish the credibility of government's MSP policy. For providing effective price support to oilseeds and pulses, which are our biggest import items in agri-basket, NAFED's role has to scale up several times in conjunction with cooperatives, private sector and NGOs. This has to be prepared well in advance for the coming season. (2) Given that edible oil imports have crossed Rs 29,000 crores, Palm oil cultivation has to be taken up on a very high priority. Business as usual may not deliver. It needs to be noted that Palm oil is the only oil crop which can give 4 tonnes of oil per hectare, which is a multiple of iii
9 what other oilseeds can give. But this crop has a gestation lag of almost 4-6 years. Small holders need support in the intervening years. The Commission feels that (a) small holders be given appropriate cash support on per hectare basis of palm cultivation for the first 4 years at least. Also, (2) palm oil be declared as a plantation crop so that private sector corporates can enter this crop sector with long term investments. Malaysia and Indonesia, who dominate the palm oil market, have exploited the strength of the private corporate sector in bringing about a sea change in this. India can learn this important lesson. And (3) Government should think of an MSP for fresh fruit bunches (FFB) of Palm oil to give it due incentive. (3) The analysis in the report reveals that productivity augmentation is the key to efficient and sustainable growth in agriculture. It further points out that seed replacement rate in conjunction with irrigation is the prime driver in boosting agricultural productivity. This needs not only much higher allocations in agri-r&d and irrigation, but also major institutional reforms to deliver on fast track. Only then Indian agriculture can achieve good degree of resilience and high growth in the face of climate change. The Government needs to give special attention to this. **************** iv
10 Chapter 1
11
12 An Overview Rainfall and Overall Production The onset of monsoon which wields a critical influence over the prospects of Indian agriculture, has been ahead of its normal date of arrival in Whereas the south-west monsoon normally sets in over Kerala around 1 st of June, this year it appeared three days earlier on 29th May, Thereafter, the advance of monsoon has been rapid, and by July 9 covered the whole country. Rainfall during the period 1st June to 6th July, 2011 has been 1 percent above the LPA. Out of the 36 meteorological sub-divisions in the country, rainfall was excess/normal in 27, and deficient/scanty in 9 sub-divisions. The water storage level of 81 major reservoirs in the country monitored by the Central Water Commission, for the week ending on , has been 29 per cent of FRL, which is 195 percent of the level last year and 148 percent of the average of past 10 years level. As per the IMD s long range forecast update for the 2011 south-west monsoon season (June to September), rainfall for the country as a whole is most likely to be below normal (90-96 percent of LPA). 1.2 During the year , because of timely rains, there has been increase in the area sown. Barring oilseeds, the area sown increased for all crops, even compared to Relative to , during , for foodgrains the area increased from to million ha., for cotton from 9.41 to million ha., and for sugarcane from 4.42 to 4.95 million ha. The most significant increase has been in respect of pulses, from to million ha. As discussed in details later, the relatively timely and adequate rainfall alongwith the better area response would explain, to a great extent, the elevated production and output of several crops. Rainfall most likely to be below normal Increase in area sown, particularly for pulses 01
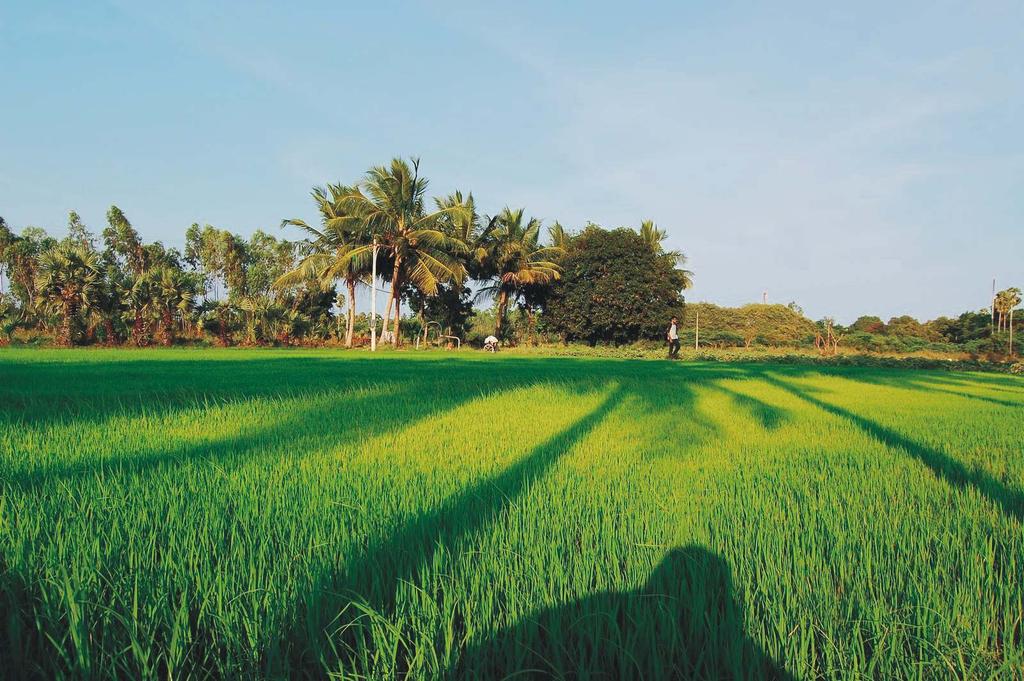
13 Record production of cereals pulses and oilseeds; yet, except pulses, below targets. Record production of wheat, maize, bajra, gram, urad, and moong. 1.3 According to the Fourth Advance Estimates, released on 19 th July, 2011, by the Directorate of Economics and Statistics (DES), Ministry of Agriculture, the total foodgrains production for the year has been estimated at million tonnes. Even though about 3 million tonnes lower than the target of million tonnes set for the year, this is crossing the previous record of million tonnes registered during the year Similarly, there is expected to be record production of cereals, from the peak of million tonnes in to million tonnes in However, this is below the laid down target of million tonnes. For coarse cereals as a whole also, the total output of million tonnes ( ) is establishing a new record above the previous peak of million tonnes ( ). Still, this is marginally below the target of million tonnes laid for the year. The total pulses production in is estimated to set all-time record at million tonnes. This is one of the crop categories where the output achieved would be outstripping the targetted level of million tonnes. The category of total nine oilseeds is expected to generate another record in production at lakh tonnes ( ), an increase of lakh tonnes over the output in But the estimated output is still below the set target of lakh tonnes. 1.4 In respect of individual items, as regards foodgrains, the output of both rice and wheat is estimated to increase, relative to the preceding year. However, the total output of rice at million tonnes in would remain below the record production of million tonnes in as well as the targetted level of million tonnes ( ). As regards wheat, the production would establish a new record in at million tonnes, that is exceeding the laid down target of million tonnes. Among the category of coarse cereals, the production of maize and bajra are setting new records in at and million tonnes, respectively. Within pulses, the estimated output of Gram, Urad, and Moong would be exhibiting new records in ; Gram at 8.25 million tonnes, Urad at 1.74 million tonnes, and Moong at 1.82 million tonnes. 1.5 Among oilseeds, the year is expected to witness new
14 records in output for castor seed at lakh tonnes, sesamum at 8.76 lakh tonnes, and soyabean at lakh tonnes, above the respective set targets of 11.39, 7.50 and lakh tonnes. However, there is anticipated to be decline in production for the following oilseeds mainly because of area decline: linseed, safflower, and sunflower. Among the commercial crops, cotton would be hitting a new record in production at lakh bales ( ) vis-à-vis lakh bales in There would be improvement in the production of sugarcane also, from lakh tonnes ( ) to lakh tonnes ( ). The only depressing scenario is in respect of jute and mesta where the level of production would dip from lakh bales ( ) to lakh bales ( ). 1.6 On the whole, crop sector in the country is exhibiting encouraging indications. The favourable weather factors that prevailed in the past year alongwith the encouraging price levels for agricultural items, would have played up the performance. However, it needs to be kept in view that the enhanced production is mainly obliged to the expansion in area during this period, rather than productivity improvement. In some areas, the improvement arose out of increased inter-cropping. For instance, reportedly, tur was planted as an inter-crop in the soyabean fields of Maharashtra and Madhya Pradesh, and urad was sown alongwith sugarcane in Uttar Pradesh. Hence, the critical task is to put the current production increase on a sustainable growth path, through raising yields. New records for castor, sesamum and soyabean; cotton and sugarcane improves, jute declines Output increase mainly from area increase and weather factors; raising yield important Management of Rice/Wheat Procurement and Distribution 1.7 The procurement of wheat during (as on July 20, 2011) was million tonnes. The quantum of procurement is a record, as against the procurement of million tonnes achieved during The substantially high production alongwith the higher MSP could have enabled this high level of procurement. Out of the total market arrival in registered mandis of million tonnes of wheat (as on ), million tonnes have been procured by the Government agencies, and only about percent of the arrivals have gone into the private hands. The high level of taxes/ Procurement: wheat as well as rice improves; godowns overflowing 02 03
15 levies prevalent in the traditional procurement states of Punjab and Haryana must have crowded out the private players. With the export window yet to be opened, and the domestic market failing to inspire them, this marginal role of the private sector has to happen. As regards the procurement of rice/paddy, in terms of rice, the total procurement during (as on ) has been million tonnes, as against million tonnes in the corresponding period of The remarkable procurement of these two foodgrains, particularly wheat, has made their stock position more than adequate, and the godowns are overflowing. Now, the question confronting the Government is the effective deployment and disposal of foodgrains without undergoing deterioration. Offtake of foodgrains marginally higher 1.8 The offtake of foodgrains (rice and wheat) from the Central Pool during was marginally higher by about 6.34 percent compared to the offtake during Relative to the increase in respect of wheat from million tonnes ( ) to million tonnes ( ), that of rice was from million tonnes to million tonnes. The total stock of foodgrains with the Food Corporation of India (FCI) and other Government agencies as on 1st April, 2011 was million tonnes, which was higher than the buffer stock norm of million tonnes stipulated for that date. By 1st July, 2011, the stock level of rice and wheat with FCI has further increased to 64 million tonnes. Price Scenario Price level: generally increased, foodgrains at slower pace 1.9 During the year , there has been increase in the price level of almost all categories of items, viz., all commodities, foodgrains, and agricultural commodities. However, the increase in respect of foodgrains has been at a relatively slower pace. As against a rise in the index ( =100) by 9.9 percent in the case of all commodities, the increase for foodgrains has been only by 4.9 percent. However, for agricultural commodities as a whole, there has been a drastic increase of 17.0 percent. The quantum of increase has been consistently looking up in respect of agricultural commodities, viz., 9.9 per cent ( ), 13.1 percent ( ) and 17.0 percent ( ). A substantial increase has occurred in
16 respect of fruits and vegetables, that increased 16.4 percent in as against 9.6 percent in During this period, while the increase for vegetables has been from 14.0 to 13.0 percent, that for fruits has been from 5.5 to 19.8 percent. This indicates the drivers of inflation under agricultural items Within foodgrains, barring ragi, the lowest rate of price increase during has been recorded by wheat at 3.0 per cent. For rice, the rate of increase has come down to 5.9 per cent. Similarly, for cereals as a whole, the annual rate of increase declined to 5.3 per cent. Within the category of foodgrains, earlier pulses used to be driving the price increase. However, during , this has been changed. For pulses as a whole, as against 22.4 percent increase during , the corresponding increase during came down to 3.2 percent. For oilseeds as a whole, there has been moderate increase in the price level from 2.9 percent ( ) to 4.7 percent ( ) On the whole, while there has been increase in the overall level of inflation in the country during , the price increase in respect of foodgrains has come down. However, the inflation among other agricultural commodities has remained high. While the poor still depend on staples like rice and wheat, the expanding middle class is increasingly switching over to high-value items such as fruits and vegetables, milk, eggs, meat and fish. Hence, alongwith increasing the production of staples, the agriculture sector should expand in terms of high-value categories. Price rise: higher for rice than wheat; moderate for pulses, oilseeds To contain prices, high-value agri -items should increase Global Situation 1.12 As per FAO s latest forecast (June, 2011), the global cereal production in is expected to set a new record at million tonnes, a rise of 3.5 percent vis-à-vis the one percent decline in Still, the ending stocks in are expected to be only marginally higher by 0.8 percent at million tonnes. The FAO cereal price index ( = 100) that was 174 (2009) and 183 (2010) sharply increased to 256 during January-May 2011, an increase of 59.8 percent over the corresponding period of The international prices are likely to stay high, especially for wheat and coarse grain. Global cereal production sets new record; still prices likely to stay high 04 05
17 International wheat prices remain volatile Favourable outlook for coarse grains; but supply-demand balance tight World rice production rises to a new record; moderate increase in oil crops The global wheat output is forecast to be million tonnes in , an increase of 3.2 percent over that registered during , but perceived as inadequate to meet the expected demand. The uncertain production outlook and weather concerns have rendered the international wheat prices highly volatile. The benchmark US No.2 Hard Red Winter, f.o.b., averaged USD 362 per tonne, down slightly from April but up 6.5 per cent since the start of the year. The aforesaid factors are telling upon the wheat futures in Chicago. The winter wheat futures are 75 per cent above the corresponding period last year. Prices are expected to remain high during the period till December, Regarding coarse grains, the world production is forecast to register a new record at million tonnes in , 3.9 percent above the level recorded for Anticipated to be just sufficient to meet utilization in the year, the tight supply and demand balance, particularly for barley and maize, has been raising international prices. In May 2011, maize export prices were about 80 per cent above that of the corresponding period in May 2010, while barley (feed) prices were above 50 to 100 per cent. The benchmark US maize prices (yellow, No.2, f.o.b.) averaged USD 309 per tonne in May, an increase of 18 percent within four months. By late May, the Chicago maize futures for September delivery (old crop) went up to USD 287 per tonne, a rise of 90 per cent above the corresponding period in The global rice production is estimated to have risen by 1.8 percent to a new record in 2010 at million tonnes, and for 2011, the crop is expected to grow by 2.6 percent. With supply expansion, rice prices have been either stable or on the decline, since December, The benchmark Thai white rice 100% B was quoted in Thailand at USD 500 per tonne in May, 2011, as against USD 542 in January. In the US, the price of US N. 24% rice dropped by 14 percent between January and May, 2011 to USD 518 per tonne. As regards oil crops, production in is expected to increase only 2 percent at million tonnes. Prompted by tight global supplies alongwith resumption of demand growth, prices in the oilseeds complex were on the uptrend from Only after February 2011, the prices eased, because of lowered demand and
18 improved production prospects for soyabean and palm oil as well as for rapeseed and sunflower seed. Key Issues Raising Agricultural Growth Rate 1.16 India s agriculture sector has been under-performing for several years. Against the target of 4 per cent production growth that was laid down for agriculture in the Tenth Plan, the actual achievement has been only about 2.5 per cent (at prices). During the first four years of the Eleventh Plan, as against the targetted overall agricultural growth of 4 per cent, the actual growth is estimated to be 2.87 percent (at prices). Hence, the critical task is to elevate this pace of growth and make it sustainable. Constrained by the limited scope for expanding area under cultivation, the emphasis has to be invariably on increasing the productivity in the sector. But in respect of several crops, the yield levels remain as low, mainly because of poor agronomic practices. There are wide gaps, horizontal and vertical, across crops and regions in the country. For instance, during , for wheat the yield level ranged from 918 (Karnataka) to 4462 (Punjab) kgs/ha., for Gram from 429 (Himachal Pradesh) to 1412 (Andhra Pradesh) kgs/ha., for rapeseed & mustard from 154 (Delhi) to 1738 (Haryana) kgs/ha., and for safflower from 200 (Chhattisgarh) to 1000 (Bihar) kgs/ha. (source: Agricultural Statistics at a Glance, 2010, DES). As the ultimate benchmark for farmers is net returns, they may not grow a crop, even at high prices, if poor yield makes it a losing proposition. There should be better technological and policy interventions to reduce the yield gaps and maximize profit margins As rightly brought out in the Agricultural Price Policy Long Term Perspective, 1986, Ministry of Agriculture, three of the basic foundations needed for building a sound agricultural economy are a productive technology package, efficient delivery services along with remunerative and stable market prices for produce. Special attention needs to be given to the seeds sector. Still, farm saved seeds substantially cater to the requirement of farmers. While enhancing the seed replacement rate, the thrust should be towards increasing supply of quality seeds at reasonable price, and varietal Elevate pace of agricultural growth; minimize yield gaps Prioritise supply of quality, hybrid seeds, and varietal replacement 06 07
19 replacement. Particularly, the wheat crop varieties currently under cultivation should give way to new varieties fit to face the climatic adversities and also provide higher yield. For pulses, promotion of short duration, high yielding and disease resistant varieties, is the need of the times. In respect of oilseeds such as rapeseed & mustard, development and popularisation of hybrids hold the potential for yield enhancement. In fact, expanded use of hybrids suiting the varied agro-climatic requirements could greatly contribute towards bridging the yield gaps observed across the country. Second Green Revolution Eastern India carries potential for Second Green Revolution; focus not only on rice but also wheat 1.18 The Government has launched a Second Green Revolution, focused on the country s eastern region comprising Bihar, Chhattisgarh, Jharkhand, Eastern Uttar Pradesh, West Bengal, and Orissa, with an additional allocation of Rs. 400 crores ( ). The strategy intends for a shift of rice cultivation from the North West to East of the country. Eastern India, currently endowed with adequate water resources, carries the best potential for ushering in the Second Green Revolution. This revolution should have a wider coverage of interventions. Cultivation of important crops such as paddy in the Eastern region carries considerable scope. At present, rice yield levels in the region are only about half of those in the former green revolution states. Hybrid rice as well as early maturing rice varieties hold great potential for the region. The high ground water potential there should facilitate the cultivation of these crop varieties. Similarly, the yield levels of wheat in the region, particularly in the States of Assam, Chhattisgarh, Jharkhand, and Orissa are far below the national average. Wheat cultivation also should receive a boost in the region as part of the second green revolution through improved technology practices and input delivery system The endeavours for the second green revolution should focus not only on improving productivity but also assured marketing of the produce. High yielding plant varieties resistant to pest and diseases, and tolerant to adverse weather conditions, are to be widely adopted. Further, and significantly, the aspect of marketing tie-ups has not been incorporated into the structure of the programme.
20 The region is devoid of adequate marketing infrastructure and procurement operations are weak. Since the farmers should not get disincentivised in the absence of marketing arrangements after their attempts at enhanced production, this crucial requirement has to be adequately addressed. The allocation of Rs. 400 crores this year is too meagre. Keeping in view the tasks and requirements involved, the allocation has to be multiple of this. Second Green Revolution should stress on productivity, marketing, with greater fund allocation Tackling Challenge of Edible Oils 1.20 Currently, the oilseeds sector presents a great challenge before the country. Its domestic production is short by about 50 percent, as compared to the demand. The import of edible oils has costed the country more than Rs. 29,000 crore in Edible oil consumption in the country has been consistently on the rise. The trigger for this is from the increasing income levels and the emerging dietary changes that drives increasing use of edible oils. A major issue in the country s oilseeds sector is the low productivity of oilseed crops. In this context, an advisable option is the promotion of oil palm cultivation, considered as the richest source of oil, with diversity of uses for both food and non-food products. It is the most productive vegetable oil crop, yielding more oil per hectare than any other major oilseed. World demand for the relatively low-priced palm oil has soared. It is widely expected that oil palm would remain as an important source of raw material for food, oleochemical and biofuel industries. During (November- October), India imported MT of crude palm oil at an estimated cost of Rs crore (source:sea). The quantity imported amounted to about 59 percent of the country s import of vegetable oils in the year The palm oil cultivation in the country was promoted under the Technology Mission on Oilseeds and Pulses (TMOP) set up in 1986 by the Government. The Chadha Committee Report has identified potential area of 10,36,500 ha. in 9 states for oil palm cultivation. Currently, oil palm cultivation is promoted under the Integrated Scheme for Oilseeds, Pulses, Oil Palm and Maize (ISOPOM). There are 12 States identified for growing oil palm, vz., Andhra Pradesh, Karnataka, Tamil Nadu, Gujarat, Goa, Orissa, Kerala, Assam, Tripura, West Bengal, Mizoram, and Maharashtra. Oilseeds sector posing a challenge; promote oil palm cultivation Oil palm cultivation promoted under ISOPOM; area coverage too little 08 09
21 While the States of Assam, Tripura, and West Bengal have not implemented the Oil Palm Development Programme, Maharashtra has started its implementation from The total area under oil palm has been estimated at ha., as on Promote large scale oil palms, by ensuring basic requirements 1.22 Oil palm cultivation is a long-term investment. Its success requires timely replanting operations. To cater to this, it has to be ensured a steady supply of high quality hybrid seeds, seedlings, and young palms. Private sector participation in government land including waste lands should be encouraged, with proper safeguards against any misuse of the land. The country should take advantage of the fact that several companies including multinational companies have evinced interest in India s oil palm production with possible induction of improved technology. The need of the times is to raise large scale oil palm plantations However, from large areas under oil palm cultivation, farmers themselves had uprooted the palms particularly during This was mainly because of low palm oil prices, and farmers opted for more remunerative crops. The government policies that allowed almost free import of palm oil to India dented the domestic sector that had grown under government protection and assured higher domestic palm oil prices. The indigenous oil palm cultivation is afflicted by factors such as low yield, lack of suitable seedlings and processing facilities proximate to oil palm growers, fluctuating edible oil prices, changes in trade policies, and absence of appropriate incentives. Barring a few areas, there are no visible results for the attempts at promoting oil palm cultivation in the country. The programme for oil palm development should endeavour to eliminate these deficiencies. Given the relatively longer gestation period and the limited capacity of individual cultivators, it would be appropriate to declare oil palm as a plantation crop so that the corporate sector could also enter that could impart a timely boost to the sector. The import duty structure on edible oils should be well calibrated and periodically adjusted according to requirements so that the growers get remunerative prices. Oil palm (FFB) requires to be brought under the ambit of MSP mechanism to provide better and steady price support to the cultivators. The experience of Malaysia, a global leader in palm
22 oil production, should also enlighten the Indian initiatives. Their thrust on downstream activities, R&D and extension services and yield improvement, boosted the expanded cultivation of oil palm as a profitable long-term investment
23
24 Chapter 2
25
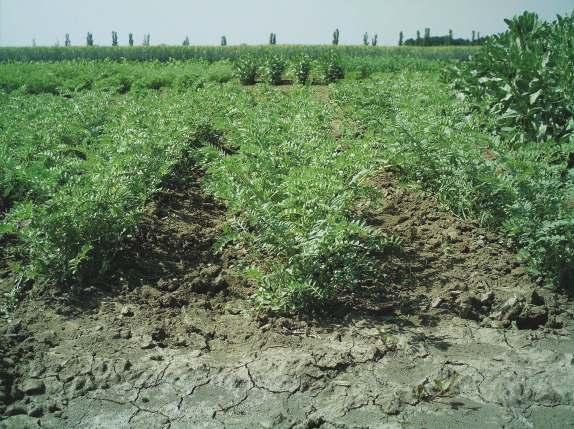
26 Six Rabi Crops in the Domain of MSP Wheat Production of wheat has been steadily increasing, more than the overall demand in the country, generating some marginal surplus. Given the high prices in the international market, some quantity of wheat can be exported. However, the possible impact of enactment of the National Food Security Bill on wheat requirement is still not clear, the finer details of which are still under deliberation. Supply needs to keep increasing as overall demand will increase due to population pressure, despite decline in the per capita direct consumption. 2.2 Per capita demand for cereals for direct human consumption has declined from kg in to kg in and further to kg in in the rural areas. In the urban areas, it has declined from kg in to 9.94 kg in and to 9.68 kg. in ( source: NSSO). The above demand trend could be attributed to shift in consumption pattern of the individuals from basic cereals to high value products as income rises. Across expenditure classes also, the same pattern could be seen (chart 2.1), except in case of the bottom 5 percent of the income classes, where the monthly per-capita consumption of cereals has increased by 2.1 percent and 3.8 percent in rural and urban areas respectively, between and Decline in per capita monthly consumption of cereals 13
27 Chart 2.1: Percent change in monthly per capita cereal consumption in rural and urban India: 1993/94 and 2004/05 Per capita consumption of wheat increased in urban areas and declined in rural areas. 2.3 The decline in the per capita direct consumption of cereals was brought about mainly by coarse cereals, to a lesser extent by rice and marginally by wheat (in rural areas only), as indicated in chart 2.2. However, the total demand for wheat (and all other cereals also) is likely to increase due to pressure of population increase. Demand for wheat, calculated on the basis of demand disappearance (production+ net import change in stock) has shown increase along the plan periods from million tonnes during IX Plan to million tonnes during X plan to million tonnes in Chart 2.2: Monthly Per capita consumption in Rural and Urban areas Source: NSSO Report: Household consumption expenditure in India
28 2.4 On the supply side, wheat production during is projected to bounce back to its rising trend, after a severe drought in , to million tonnes, an increase of 6.35 percent over the production of (Fourth estimates of production by DES). The year also witnessed increase in wheat area and yield by 2.8 and 3.5 percent respectively over Normal rainfall, favourable weather conditions, large procurement by government agencies in the previous year etc have played major part in achieving the record area and production. Wheat production during projected to bounce back to its rising trend, to million tonnes. 2.5 All-India area, production and yield have shown increase in recent years as shown in Chart 2.3. Chart 2.3: All-India Area, Production and Yield of Wheat Source: Directorate of Economics and Statistics, Ministry of Agriculture. 2.6 One striking feature in chart 2.3 is the steep yearly increase in yield and consistent increase in production and area since Is it the higher annual hike in MSP during the period which has incentivized the farmers to take up investment in the field? Or is it the better agronomical practices in states like Haryana, Punjab, Western U.P and Rajasthan in terms of HYV use, assured irrigation, SRR etc? It may be of relevance to commission a study to understand the behavior of the crop. However, the country is still significantly below the technological frontier of 7 tonnes per hectare, with the existing technologies. Steep yearly increase in yield of wheat since Also there is immense potentiality in emerging wheat growing states like M.P and Bihar to increase productivity through 14 15
29 enhancing SRRs, increasing the use of HYVs and optimum use of fertilizers (Table 2.1). Table 2.1: State-wise use of HYV Seeds, Irrigation, Fertilisers and Seed Replacement Rate. State Wheat Area under HYVs (%) ( ) Wheat area under irrigation (%) ( ) Fertliser use per (kg/ha) ( ) Seed replacement rate( ) Productivity T.E (qtl./ ha) Uttar 95# Pradesh Punjab Haryana Rajasthan M.P Bihar Gujarat West Bengal Source: Average for all crops. # refers to from state reply. 2.7 In the technology front, the semi-dwarf High Yielding Varieties (HYVs) of seeds introduced into the system in 1966 was well accepted by the farmers and presently, the HYV coverage in states ranges between 100 percent in Punjab to 61 percent in M.P. Research on technology would need to address abiotic stresses like global warming and climate changes. Mycorrhizal technology is reported to increase nutrition and yield of crops by 25% and reduce use of chemical fertilizer by 50%. 2.8 The novel Mycorrhizal biofertiliser technology developed by The Energy and Resources Institute (TERI) is reported to enhance nutrition and yields of crops upto 25 percent and curtail the use of chemical fertilizer inputs by 50 percent, as shown by field trials conducted by TERI. Since the country is grappling with the problem of soil fertility and enhancing cost of fertlisers, Government may incentivize and consider the feasibility of using Mycorrhizal bio-fertliser technology on a mass scale in the farms through demonstration programmes and incentives, in consultation
30 with ICAR. This will go a long way to cut down high costs and subsidies on fertilizers. 2.9 Considering requirements of increasing the supply of wheat, government in has started the National Food Security Mission (NFSM)- Wheat in 143 districts in the states of Bihar (25), Gujarat (6), M.P (30), Maharashtra (8), Punjab (10), Rajasthan (15), U.P (38), West Bengal (4) and Maharashtra (13). The deliverables are increase in production of wheat by 8 million tonnes by , increase in productivity at individual farm levels and increase in employment opportunities. If is taken as the base year, then by , there has been an increase of wheat production by 7.4 million tonnes. An independent evaluation at the end of Rabi may need to be undertaken to see the contribution of the project districts towards the increase in production and to evaluate the increase in productivity at the individual farm levels, compared to the base year. An independent evaluation of NFSM-wheat at the end of Rabi recommended to study the contribution of project districts towards increase in production and increase in productivity at the individual farm level. Implementation of MSP 2.10 MSP implementation of wheat during the current Rabi Marketing Season (RMS) brought to front major structural inefficiencies and lacunae in the system which calls for urgent changes so that the farmers get at least the MSP that the Government has announced. Except for Punjab and Haryana, where procurement machinery has evolved over years, other major wheat producing states like Eastern UP, Bihar and Gujarat, are not fully geared to take up procurement operations, in terms of agencies and stocking facilities. Food Corporation of India (FCI), which is the central agency for coordinating and taking up procurement operations, has its own limitations in expanding further. Thus, there is a vacuum in procurement operations in the above states, as a result of which farmers suffer with market prices in many markets hovering below MSP. The existing situation with regard to procurement in Bihar and Eastern U.P can jeopardize the policy of the government to usher in green revolution in these states, since farmers will not be incentivized to take up production of food grains unless there is assured market. Due to lack of scientific storage facilities, stocks are likely to face large scale spoilage. If FCI and other state agencies are found not in a position to meet the requirements Absence of procurement in Bihar and Eastern U.P can jeopardize the policy of the govt. to bring in second green revolution in these states
31 of MSP operations, the government should consider the option of bringing in other players to procure on the government s behalf, also on same terms and conditions as given to the FCI. These agencies could be cooperatives like IFFCO, agricultural NGOs like BAIF or private sector companies like ITC, Hariyali Kisan Bazar etc. Further, policy actions of states like Punjab and Haryana to keep exorbitant local / mandi taxes have completely crowded out private traders from the market, which need immediate correction so that market forces come to play and government intervention gets limited. Markets where wheat prices have gone below MSP during RMS is given at Annexure-II During the current RMS, , the Commission held talks with farmers at Gaya, Patna, Sasaram, Samastipur and Muzaffarpur in Bihar, Hardoi, Nautanwa, Bansi, Muzaffar Nagar and Shaharanpur mandis in UP and Dhoraji, Junagadh, Jetpur and Kadi mandis in Gujarat and found that farmers were selling at below MSP prices at many places, mainly due to absence of procurement agencies. In the mandis visited in U.P, during the current season, up to April end 2011, a sizeable percentage of farmers (above 40 percent) sold their produce at below MSP. Farmers indicated that FCI s presence was almost negligent and in many cases they had started procurement much later, forcing farmers to sell their produce at below MSP rates. In the Gujarat mandis visited, about 80 percent of the wheat brought till last week of April was sold below MSP at prices in the range of Rs.950 to 1050/quintal. All the states reported absence of storage facilities, which was hampering procurement. In Jetpur mandi at Gujarat, procurement officials were found not procuring in the absence of orders for procuring. In Bihar, absence of Krishi Upaj Mandi all over the state and lesser involvement of state agencies were stated by the farmers as the biggest problems in disposing of the grains. The state cooperatives in Bihar (PACs) face an acute problem of storage and in addition, lack of working capital. Hence, the prevailing price in Sasaram was in the range of Rs to Rs.1100/- per quintal, while the minimum support price comes to Rs.1170/- per quintal including the bonus Procurement is still concentrated in Punjab and Haryana as clearly indicated in chart 2.4.

32 Chart 2.4: State-Wise Share in Total Procurement ( ) 2.13 While it is true that Punjab and Haryana had contributed the maximum towards wheat procurement in the green revolution years, over the years other states have also emerged as significant players in wheat production in the country. However, FCI s operations are still concentrated in Punjab and Haryana (chart 2.5). Chart 2.5: Number of Purchase centres operated by FCI during RMS to While in case of Madhya Pradesh, decline in FCI centres did not create procurement problems due to active cooperative societies, in Bihar, Gujarat, and U.P, in the absence of pro-active state agencies, farmers got hit with lower than MSP prices. Hence, FCI s withdrawal from procurement should be done in consultation with 18 19
33 the state governments and may be carried out only when the states/ other agencies are ready with other options, so that the farmers do not suffer. A joint coordinated effort between the FCI and the state governments in procurement is lacking, which is affecting procurement and farmers adversely, which needs to be corrected Proper storage facilities with FCI and other state procurement agencies are abysmally inadequate, which is also affecting procurement. FCI, as on 31st March 2011, has a total storage capacity of 30.7 million tonnes, which includes owned and hired from various sources. The FCI storage capacity in states like Bihar, Jharkhand and Orissa is very low at 6.6, 1.3 and 6.2 lakh tonnes respectively. In Bihar, state agencies have another 1.5 lakh tonnes of storage capacity, while the requirement is about 3 million tonnes. Even in Madhya Pradesh, which has transformed into the third highest wheat procurement state, the Commission saw large quantities of wheat kept in the open in the visited districts of Harda and Itarsi, faced with the risk of damage from rodents/insects, rain and pilferage. In M.P, Covered and Plinth (CAP) storage facility was widely used, however the Commission was highly skeptical of the strength of these structures to withstand rains and attack from rats/insects and leakage. Urgent need to bring in private sector under PPP mode in procurement 2.16 Solution to both the above problems, however, does not lie in further expansion of FCI. The whole chain of procurement of FCI, which includes procurement, stocking and distribution has expanded/increased over time, both physically and financially. During the last six years, the economic cost of procurement of wheat to FCI has increased by about 50 percent. In Punjab, FCI functions with the assistance of about 40,000 commission agents, who charge about 2.5 percent commission charges. It is reported that there are sections of unskilled labourers, who are involved in loading and unloading of grains, who cost between Rs. 30,000-40,000 per month. Hence, there is an urgent need to bring in private sector under PPP mode in procurement Another issue which is developing as threat to the sustainability of MSP operation of wheat is the very high local/mandi taxes levied by the state governments like Punjab and Haryana on the commodity (Table 2.2).
34 Table 2.2: Mandi Charges (incl. of purchase tax, market fees, arthia commission etc) in various states: (as percentage of MSP) State/UT Purchase/ sales Tax/ Trade Tax/ VAT Market fee Arthia Commission Other charges Total Bihar Gujarat Haryana (RD 10.5 cess) M.P (nirashrit Shulk) Punjab (R.D 14.5 ID Rajasthan U.P Uttarkhand Source: FCI High prevailing mandi taxes in Punjab tend to drive out private traders, add to food inflation and make wheat from the state uncompetitive for export, hence need immediate correction Since both Punjab and Haryana are high procurement states, prevalence of high taxes would increase drastically the cost of procurement to FCI. During the current season, FCI is liable to pay about Rs crores towards tax alone to the state government of Punjab for its procurement operations and the corresponding amount for Haryana is Rs crores. One also cannot rule out the possibility of other states following suit and increase the levies and also procurement, which may make the whole system of procurement financially an expensive operation, and perhaps unsustainable. The high levies in Punjab and Haryana have also distorted the market by driving out private traders from the market place. In Punjab, during RMS, (as on July 20, 2011), the purchases by private traders accounted for only 1.2 percent of the arrival, while in Haryana, it was only 0.06 percent. Such high levies will also make the Punjab wheat uncompetitive in the world 20 21
35 market, in case the commodity gets open for export. The state government, on its part, considers it as a form of revenue. There is an urgent need for Government of India to initiate discussions with the state government of Punjab and Haryana (A.P for rice), so that natural process of market evolution is not disturbed. Direct transfer of procurement payments to farmers bank accounts, as done in M.P, may be followed by FCI and other states Farmers in all the states visited (Bihar, M.P, Gujarat and U.P) complained of delay in payments, ranging from 1week to 3 months. The delayed payment is largely a result of non-lifting of food grains by the procurement agencies. The delayed payment is forcing the farmers to take loans from informal sources at exorbitant interest rates, as high as about 50 to 60 percent per annum. In Madhya Pradesh, payments to farmers on the crop procured are directly deposited in the farmers bank account, which may be followed by FCI and other states also, to bring in transparency Madhya Pradesh is experimenting with innovative methods of procurement like sending SMS regarding the date on which the farmers can bring the produce to the market (Box 2.1), which reportedly has streamlined the operation The policy of M.P government on MSP is an interesting case study, where the state government has opted for De-Centralised Procurement (DCP) and intervened in the market in a big way to ensure MSP (chart 2.6). Announcement of an additional state bonus of Rs. 100/quintal over the MSP and the bonus announced by the union government during the current year and the previous year has also shot up the procurement in the state and during the current RMS , as on June 20, 2011, procurement has touched 4.9 million tonnes out of an anticipated production of 7.1 million tonnes. While the state government should be complemented for its proactive action on procurement, announcement of state bonus over the MSP may not be sustainable. Such high prices will crowd out private players from the market leading to market distortions. It is reported that in the past, the requirement of private trade of western and southern India was met by transportation of wheat from M.P, which has become unviable due to higher procurement price of wheat in the state. The storage problem can get worsened
36 Box 2.1. Innovations in procurement: Harda district, Madhya Pradesh Experiment. At Harda district in M.P, since infrastructural support system at APMC market yard could not handle the wheat procurement during the busy harvest season, which resulted in 2-3 days waiting by the farmers, the district administration has put in place a new system of mobile registration from the current wheat marketing season, Under this system, farmers register at the beginning of the season and given a number. Subsequently, farmers are informed through SMSes about the date when they should bring their produce at the mandi for sale. Two objectives are met through this new system: (i) farmers are not burdened with long waiting time and extra expenses on lodging, food etc. and (ii) law and order problem and exploitation of farmers by intermediaries are eliminated. The Harda experiment can be emulated by other similarly placed districts also, with some provisions whereby the farmers who get a call for sale at a later date, say after a month of harvesting, are compensated accordingly for their expenses/risk in storing at farm level. and also the large farmers tend to benefit more than the small and marginal farmers. Also this can lead to inter-crop distortions with the farmers opting for the crop which gets a bonus over MSP. The Commission is of the view that such additional bonus may not achieve the efficiency objectives in price policy front and a better option would be direct transfer of money as an investment incentive to all farmers, across crops, for purchase of inputs etc, with a cap on such assistance at 20 acres or so of irrigated land and 50 acres of unirrigated land
37 Chart 2.6: Wheat Procurement as Percentage of Production-Madhya Pradesh New buffer stock norms may be required, given the commitments under National Food Security Bill The total stock (rice and wheat) in central pool, as on January 1, 2011 was lakh tonnes as against a buffer stock norm of 250 lakh tonnes. Such piling up of grains is not an efficient proposition in a country like India, which has serious storage problems. The Commission, in its last report had emphasized the need to liquidate the stock in a phased manner, both in the domestic market and through exports. A decision on opening up exports of rice and wheat is still pending.in the meantime, this excess inventory valuing more than Rs. 50,000 crores has been costing the nation, without giving any meaningful economic returns. This only speaks of high levels of economic inefficiency of India s food management system, and gives an idea about how much could be saved in case of a rational and faster decision making process. In the changed scenario of an impending implementation of the National Food Security Bill (NFSB), there is a need to set up an Expert committee to work out new buffer stock norms, given the commitments under NFSB The blanket ban on export of wheat, brought into effect in 2007 as a reaction against rising prices and supply fears, both domestically and globally, still continues, though concerns on both the fronts have receded drastically. Opening up the exports, if required with some quantitative restrictions, would help the domestic sector (Table 2.3) as also ease the global supply fears.
38 Table 2.3: Export Parity of Wheat from Various markets in India, through Kandla Port, as on April 2011 Rs. per Qtl Items Punjab Haryana Gujarat (Rajkot) Madhya Pd. Bihar (Patna) Uttar Pd. US Gulf (FOB) (US Dollar/ tonnes) Int l Prices (converted to Rs.) Freight Charges to Kandla Local Transportation Misc. handling expenses Transit losses 1% Mandi expenses Total International Reference Price(Export Parity) (for farmers and Mandi) Avg Market Price (April,2011) Nominal Protection Coefficient (NPC) Source: 1. International Prices- UNCTAD 2. Directorate of Economics & Statistics, Ministry of Agriculture 3.Avg. Market Price for Bihar and Gujarat are taken from State Replies 2.24 In April 2011 US Gulf (FOB) for wheat at US$329, exports from Gujarat, Bihar and UP would have been possible. Punjab and Haryana had lost out due to high mandi charges and M.P due to state bonus. International price (US Gulf (FOB) has since declined and it stood at US$ 229 in June, at which price export from any of the major mandis may not be possible. (However, international prices are highly volatile and situation can reverse). Thus delayed action has spoiled our farmers chances of getting a higher price. Also, any decision on export now will benefit traders only, since farmers have mostly sold their wheat produce in the current season. Barley 2.25 Barley, a coarse cereal, is basically used as raw material in beer industry, which is growing at about percent per annum
39 Success story of PPP approach in Barley cultivation in India. Beer manufacturers like SAB Miller and UB Group already have reportedly successful contract farming arrangements with the barley farmers in Rajasthan, Punjab and Haryana. SAB Miller India, in , has initiated the Saanjhi Unnati Programme, a malt barley development programme, in the districts of Jaipur and Sikar in Rajasthan and presently covers about 6250 farmers and a barley area of 25,000 acres in the states of Rajasthan, Haryana, Punjab and Uttarakhand. Under the programme, the company makes available certified seeds at subsidized rates to the farmers, provides them scientific inputs relating to various agronomic practices and soil testing and an assured market for their product. The company also benefits from a stable, secure source of high quality malting barley. The UB Group s barley contract farming covers about 5000 acres in Punjab and Northern Rajasthan. The companies involved are joining hands with public research institutions to produce two-row malting barley varieties. For eg. the first commercially successful indigenous two-row barley, DWRUB-52, was jointly developed by the UB group with the Directorate of Wheat Research, Karnal. Sab Miller,India is also jointly working with public institutions like Rajasthan Agricultural University and Chandra Shekhar Azad University of Agriculture, Kanpur for development of certified seeds. The government should encourage such Public-Private Partnerships between farmers, industry and public research institutes and limit its role to a catalyst, through greater investment in research for development of HYV seeds etc. Government can also encourage the small and marginal farmers, who form the majority of farmers cultivating the crop, to form Farmer Producer Organisations (FPOs), which will help them to do business with the industry partner in a more effective way Demand driven growth strategy of the crop, as indicated in the earlier paragraph, is necessary to do away with the existing demand and supply distortions and help the farmers to make the cultivation of barley a profitable enterprise. While India produces about 1.6 million tonnes of barley, only 0.35 million tonnes are used by brewers and the rest is used as feed, mainly because of the six-row feed grade varieties grown in India as against the tworow varieties suitable for malt.
40 2.27 Barley accounts for 0.7 percent of the total cereal production in India and globally, India accounts for about one percent of the world barley production. The major producers of barley in the country are Rajasthan (55%), Uttar Pradesh (21%), Haryana (8%) Madhya Pradesh (7%) and Punjab (3%), which contribute about 94% of the production in the country. Production of barley in is projected at 1.57 million tonnes (Fourth Advance Estimates), an increase of 16.3 percent over the production of 1.35 million tonnes. The increase in the production can be partly attributed to increase in area coverage from 6.2 lakh hectares in to 7.0 lakh hectares in and increase in yield from 2172kg/hectare in to 2240kg/hectare in The all India area production, and yield of barley in India during to is given in chart 2.7. An increase of 16.3 percent in Barley production over Chart 2.7: All India Area, Production, and Yield of Barley 2.28 The inter year fluctuations in the production levels of barley during the last decade point to continuing dependence of the crop on weather conditions. Area under barley cultivation, which was 1.01 million hectares during T.E declined sharply to 0.77 million hectares during T.E and further to 0.68 million hectares during T.E The area under barley seems to be shifting to more remunerative crops like wheat, gram, safflower and rapeseed/mustard. Declining trend in area under Barley On the technology front, the research work of Directorate of Wheat Research, ICAR, through its All India Coordinated Wheat and Barley Improvement Project (AICW&BIP) is geared towards 26 27
41 developing better malt type barley for industrial application in brewing/distillation and high energy foods/drinks The average annual index number of wholesale prices of barley has shown consistent increases since , except in , when it declined by 1.4 percent over , after about five years of consistent increase. The consistent increase in the domestic price of barley can be attributed to the vibrant domestic beer industry which is growing at about percent per annum. Chart 2.8: Movement of domestic price of barley 2.31 Government announced an MSP of Rs.780 per quintal for barley for the marketing season. However, procurement was negligible due to market prices ruling above the MSP. The wholesale prices quoted during April-June 2011 in some major markets ranged between: Rs to Rs per quintal in Jaipur (Rajasthan); Rs.1075 to Rs.1150 per quintal in Hapur (Uttar Pradesh) and Rs to Rs per quintal in Delhi. No markets have reported prices below MSP during the current season, as per information received from the state Governments and DES. Pulses 2.32 The total production of pulses in the country during is estimated at an all time high at million MT. This is an increase of percent compared to the production of million MT achieved during The production has increased due to both area expansion and higher productivity. The trends in
42 area, production and yield during onwards are depicted in Chart-2.9. Chart-2.9: Area, Production and Yield of Pulses 2.33 It is noted that the production had stagnated in the range of to million MT during a period of 4 years from to However, the year witnessed a welcome break from this stagnation. This could be due to one or more of factors such as good performance of monsoon across districts, higher prices prevailing in the market, higher MSP and/or impact of NFSM under which 60,000 villages have been adopted for pulses. The impact of MSP may have led to higher production, given that the average increase in MSP of rabi pulses during was quite encouraging at 19.82% compared to less than 1% during preceding year. At the same time, empirical evidence suggests that better performance of monsoon leads to intense cropping The area increase under pulses was 12.9% compared to 1.4% under other foodgrains. Area increase could have been possible due to one or a combination of factors such as good performance of monsoon, higher MSP and upbeat market prices. Significantly higher MSP might have led to higher coverage and improved productivity through application of superior inputs. Notwithstanding this conjectural hypothesis, there is need to undertake a study on factor analysis to which this impressive performance can be attributed to and lessons learnt from this positive experience

43 Key Issues in Pulses Productivity 2.35 As noted earlier, production of pulses stagnated around million MT for 4 years during to This could have been due to inadequate availability / supply of quality certified seeds, lack of assured irrigation compounded by aberrant weather conditions, lack of integrated disease and pest management technology, inadequacy in testing of soil health and imprecise use of inputs according to soil status, crops grown on less fertile and marginal lands, lack of appropriate farm practices etc. The shares of various pulses in terms of their area and production during T.E is exhibited in chart-2.10: Chart-2.10 : Shares of various Pulses in Area and Production Disaggregate Analysis: State-Specific Scenario (Major Pulse producing States) 2.36 An analysis of the performance of major pulses growing states on the basis of irrigation and Seed Replacement Rates (SRR) is given in table-2.4: Table-2.4 : Area, Production, Yield, Irrigation and SRR of Pulses in Major Pulses Producing States ( 000 Ha, 000 MT, Kg/ha) State Production Irrigated Area (%) SRR (%) Share in Production (%) M.P Maharashtra Rajasthan U.P A.P
44 Karnataka Gujarat All India Notes: 1. States have been arranged in descending order of their respective production. 2. Area, Production & yield refer to , irrigation and SRR pertain to and respectively The empirical evidence in Table-2.4 suggests that there exists a high correlation between productivity and combination of SRR and irrigation. This points towards an important non-price policy, i.e., there needs to be much higher emphasis on bringing more pulses area under irrigation in tandem with increasing SRR. The trends in area, production and yield in respect of rabi pulses during (TE) are depicted in Chart Chart-2.11 : Area, Production and Yield of Rabi Crops in major Pulse Producing States 2.38 All-India average yield at 689 kg/ha for pulses during represents an increase of 59 kg/ha compared to that of last year. Of the major pulse producing states, Madhya Pradesh, Andhra Pradesh and Karnataka experienced below all-india average yield level, which seems to be due to low level of SRR and less irrigated area under pulses. The investment in irrigation in the state of Rajasthan is low at Rs. 813 crores It may be noted that 5 major pulse producing states viz. M.P., Maharashtra, Rajasthan, U.P., and A.P. account for about threefourth of the country s total production of pulses. The average 30 31
45 productivity of these 5 states at 709 Kgs/ha is higher than that of all-india average at 689 Kgs/ha. Amongst these 5 states, the state of Gujarat has the highest productivity (845 Kgs/ha) followed by U.P. (829 Kgs/ha), and Maharashtra (773 Kgs/ha). However, this is somewhat expected, given that Gujarat is leading in use of resources /inputs with comparatively higher SRR (23%) and moderate irrigation (12.3%) 2.40 The state of Madhya Pradesh stands out. Inspite of being the highest producer of pulses, its yield rate is significantly low (655 kg/ha) compared to that of all-india average. However, this could be due to severity of frost that played key role in damaging the crops mainly arhar and gram. In any case, there is a need to ensure supply of certified quality seeds to the farmers and investment in irrigation facilities; the lack of these inputs seem to keep the productivity levels low. Demand-Supply Gap in Pulses 2.41 Net availability of pulses per capita per annum during the period from 1951 to 2009 has come down considerably from 22.1 kg to 13.5 kg. The consumption demand of pulses is estimated at million MT. Though the production during is estimated to be an all time high at million MT, it still falls short of the demand. Nevertheless, the import of pulses is likely to decline during the year The details of demand and supply of pulses is exhibited in Table-2.5. Table-2.5: Demand and Supply of Pulses (Million MT) Crop Year (July-June) Gross Production (All Pulses) Net Production # Procurement All Pluses (NAFED) Nil Nil Negligible Nil Nil Export (FY) All Pulses Import (FY) All Pulses
46 Supply (FY) Consumption Demand Sources: DES, Ministry of Agriculture and DGCI&S, Kolkata. # : Net of seed, feed and Demand projections made by the Working Group on Eleventh Five Year Plan vis-avis production are depicted in Chart Chart-2.12: Demand-Supply Gap in Pulses 2.42 The demand-supply gap is reflected in the higher prices that prevailed in 2009 and Low domestic production over the years coupled with low stocks have pulled up the domestic prices. Retail price of tur, for instance, touched Rs. 120 per kg and that of other pulses remained above Rs. 70 per kg. However, higher production during is expected to ease out pressure on the price frontier, albeit in small measure, as the demand continues to outstrip the production level. Import of Pulses 2.43 To bridge the gap between demand and supply (domestic production) in pulses, India imported 3.5 million MT of pulses during which ebbed to 2.6 million MT during , mainly due to an all time high domestic production. The details of imports /exports of pulses during to are exhibited in table
47 Table-2.6 : India s Imports and Exports of Pulses During to (Million MT, Rs. Crores, Rs/Kg) Year Import Export Quantity Value Unit Price Quantity Value Unit Price Source: DGCI&S, Kolkata Canada and Myanmar are the main sources of imports of pulses to India. Three pulses namely Yellow peas (47.2 percent), beans (20 percent) and tur (11 percent) together contributed over three-fourth of the total quantity of pulses imported in India in as may be seen from Table-2.7. Table-2.7 : India s Imports of Major Pulses During Pulses Source of Quantity Value Share (%) Import (000 Tonnes) (Rs Crore) Peas (Yellow) Canada, USA, Ukraine Beans China, Myanmar, Canada Tur Myanmar Yellow peas are being imported mainly from Canada, Australia, Russia and Ukraine while tur is imported from Myanmar. Yellow peas, a low cost pulse (about one-third of tur price), has high protein content and therefore needs to be propagated as an alternative to the traditional pulses. Prices of Pulses 2.44 The prices of pulses have exhibited an upward trend, albeit with fluctuations, as revealed by WPI ( =100). The annual average WPI for pulses has increased from in to in before declining to during (average of April-June, 2011).
48 Chart-2.13 :WPI of Pulses Likewise, prices of imported pulses as reflected in the unit value of imported pulses have also exhibited an upward trend during to However, it declined during (Table-2.6). An all-time high production of pulses during explains, at least in part, current level of subdued prices of pulses. Rabi Pulses under MSP 2.45 Gram and lentil are two rabi pulses crops that are covered under the domain of MSP. Therefore, these two crops are being particularly discussed in the following sub-sections. Gram 2.46 The production of gram is estimated at 8.25 million MT in as against 7.48 million MT in , a increase of 0.77 million MT. The area, production and yield of rabi gram during last five years are exhibited in Table-2.8. Table-2.8 : Area, Production and Yield of Gram ( 000 Ha, 000 MT, Kg/Ha) Year Area Production Yield * *: Based on third Advance Estimate, DES 34 35
49 The productivity of gram at 896 kg/ha during has declined compared to that of 915 kg/ha achieved during SRR in respect of gram has been significantly low in which varied between 21% in Maharashtra and 5.5% in Himachal Pradesh as may be seen from Table-2.9: Table-2.9 : SRR in Major Gram Producing States State SRR % (Gram) Bihar Haryana Himachal Pd Madhya Pradesh 9.18 Maharashtra Rajasthan 7.78 Uttar Pradesh Uttarakhand Lentil Since gram is a self pollinated crop, recommended SRR is 30%. However, none of the states has achieved the recommended level of SRR The production of lentil at 9.53 lakh MT during and was higher compared to 8.12 lakh MT achieved during The area, production and yield of lentil during last three years are exhibited in Table Table-2.10 : Area, Production and Yield of Lentil ( 000 Ha, 000 MT, Kg/Ha) Year Area Production Yield SRR in respect of Lentil has been low and varied in the range of 8% in Bihar to 28% in Uttar Pradesh in
50 Inter-Pulses Price Parity 2.48 The average increase in MSP during to over a block of earlier four years ( to ) was highest at 94% in case of moong followed by 83% each for tur and urad. In contrast, increase in gram and lentil was 26% each. This distortion needs to be corrected. Lack of inter-pulses Price Parity : Need for correction Table-2.11 : MSP of Various pulses (Rs/Quintal) Year Gram Lentil Tur (Arhar) Moong Urad Average ( to ) Average ( to ) Average Increase (%) Measures to Increase Production / Productivity of Pulses 2.49 To increase the production and productivity of pulses, the Government has taken several measures, notable amongst them are as follows: i. The NFSM, started from rabi season , covers pulses besides paddy and wheat. It is being implemented in 467 districts of 16 states in Andhra Pradesh (22), Assam (10), Bihar (38), Chhattisgarh (18), Gujarat (26), Haryana (21), Jharkhand (17), Karnataka (30), Madhya Pradesh (50), Maharashtra (33), Orissa (30), Punjab (20), Rajasthan (33), Tamil Nadu (30), Uttar Pradesh (71) and West Bengal (18). The interventions under the Scheme 36 37
51 include demonstrations on improved production, purchase and distribution of certified seeds, seed drills, sprinkler sets, knap sack sprayers, pump sets, assistance for pipes, (carrying water from source) training for extension workers and strengthening of infrastructure of IIPR. It is targeted to increase the production of pulses by 2 million MT by alongwith increase in area and productivity. ii. The major research work on pulses, being carried out by Indian Institute of Pulses Research (IIPR), established by ICAR are as follows: a. genetic enhancement for yield, quality and resistance to biotic and abiotic stresses, b. development of transgenic in chickpea and pigeon pea; and c. All India Coordinated Research Project on Dry land Agriculture (AICRPDA) has evaluated improved varieties of pulses and recorded yield gains to the extent of per cent compared to local cultivars of different pulses. There is a need to provide quality improved seeds of pulses to the farmers by adopting seed village concept with active participation of the farming community. Procurement 2.50 The National Agricultural Cooperative Marketing Federation of India Ltd. (NAFED) is the designated nodal agency for price support operations for pulses. During and rabi marketing seasons, there was no procurement of gram and lentil under the price support scheme, since their prices were ruling above MSP. Recommendations The Commission (CACP) recommends the followings: i ii Supply of certified quality seeds to the farmers and investment in irrigation facilities be ensured to achieve higher productivity in pulses. We need to commission a study to deepen the understanding of
52 the factors that led to the dramatic increase in pulses production in so as to replicate those factors in a broad based manner. iii Yellow peas, a low cost pulse (about one-third of tur price), has high protein content and therefore needs to be propagated as an alternative to the traditional pulses. Oilseeds 2.51 The edible oil sector is characterized by its heavy dependence on imports as the demand has been monotonously outstripping the domestic production, making it inevitable to resort to imports to bridge the gap between demand-supply. India s import bill on account of edible oils during , for instance, was Rs. Rs. 29,442 crores. The year-wise imports of edible oils during the last ten years are exhibited in Table Heavy dependence on imports of edible oils Table : Imports of Edible Oils (Lakh MT, Rs. Crore, Rs/Kg) Year (April-March) Quantity Value Unit Value Source: DGCI&S, Kolkata, Ministry of Commerce & Industry It may be seen from Table-.13 that quantity of imports of edible oils has increased and almost doubled during to but it significantly declined during to the level of However, value of imports of edible oil doubled during to , though quantity remained almost at the same level, implying the implicit prices doubled during this period of 2 years During , India imported 44.3% of its total consumption requirement of edible oils which increased to 50.3% during before declining to 42.2% during Higher share of imports during was necessitated mainly due to less domestic production as a result of aberrant weather conditions. In contrast, higher domestic production during drifted the 38 39
53 Share of imported edible oil in total consumption requirement declined from 50.3% in to 42.2% in dependence on imports by 8% which could have been due to a variety of factors such as better performance of monsoon, increase in MSP of certain oilseeds upto 10% and higher market prices in the preceding season which encourages farmers to apply better inputs to reap advantage of higher productivity. This is substantiated by the fact that oilseeds posted production at million MT during , higher by 3.38 million MT or 12.2% compared to that of ( is not considered as it was an abnormal year in statistical sense of the term) with lesser acreage by 0.74 million Ha. or 2.69% compared to that of This was possible with 15.21% increase in productivity at 1159 kg/ Ha. during A pertinent question arises as to why this higher level of productivity was accomplished now. An answer to this could be that Indian farmers may be enveloped in the cobweb syndrome where they use the past price to decide on the cropping pattern and level of application of inputs. As a result of this, there is a tendency to move more into crops which fetched higher prices in the preceding season. Such a scenario leads to higher production in the ensuing season which results in subdue prices, which in turn starts the syndrome once again as farmers switch over to other crops which provide higher prices The details of domestic production of oilseeds and edible oils, imports and availability/consumption are exhibited in Table-2.13: Table-2.13: Production, Imports and Availability of Edible Oils during to Name of Oilseed Oilseeds Oil Oilseeds Oil Oilseeds Oil Primary Sources Rapeseed/Mustard Soyabean Groundnut Sunflower Sesamum Niger Seed
54 Safflower Seed Castor Linseed Sub Total B. Secondary Sources Cottonseed Rice Bran Solvent Extracted Oils Coconut Tree & Forest Origin Sub Total Total (A+B) C. Less: Export & Industrial Use D. Net Domestic Availability E. Import Of Edible Oils* F. Total Availability/ Consumption Of Edible Oils * : Pertain to Financial based on third advance estimates 2.55 It may be noted that contribution of secondary sources of oils in the total domestic production of edible oils is quite significant at over one-fourth and therefore these also assume importance. The domestic availability, consumption demand and total supply (including imports) situation is indicated in Chart Chart: 2.14 Domestic availability, total availability and consumption of edible oils 40 41
55 Cost Structure of Domestic Production of Palm Oil 2.56 Out of various edible oils imported during , Crude Palm Oil (CPO) commanded the largest share (69.58%), followed by a distant second oilseed viz. Soyabean (16.80%) and Sunflower (10.39%). The reason of disproportionate share of CPO in the country s import basket of edible oils lies in its significant price advantage compared to its other substitutes. Given the fact that a preponderate proportion of edible oils in the basket of its imports to India contains palm oil, it will only be fair to compare and contrast the domestic cost /price with the landing cost of imported palm oil. With this end in view, composition of a typical Fresh Fruit Bunch (FFB) of palm oil is broadly depicted in Table-2.14 to deepen the understanding about the economics of palm oil. Table-2.14 : Composition of Fresh Fruit Bunch (FFB) of Palm Oil Composition Percentage Pure Oil Dry Fibre Nuts Solids in Oil 5.00 Empty Bunch Evaporation (FFB, Crude Oil, Nuts) Total Note: Based on discussions with experts including from Directorate of Oil Palm Research, Pedavegi (AP) 2.57 The palm oil cultivation gives rise to an average yield of 20 MT of FFB per Ha. per annum during the period from 4th year to 25th year of plantation and average oil recovery rate from FFB is about 20%. Thus, one Ha. of land under the palm oil cultivation gives rise to about 4 MT of oil which is quite attractive, given the fact that it is about 0.18 MT and 0.35 MT in cases of soyabean and mustard respectively. Equivalently, 5 MT of FFB is required to produce 1 MT of CPO. The cost of cultivation / cost of production of CPO has been estimated and exhibited in the Table-2.15.
56 Table-2.15: Cost of Cultivation / Cost of Production of Palm Oil (Amount in Rupees) Broad Cost components Cost Remarks Cost of inputs (including lease rent, Interest & working capital) /Ha. Annualised cost /Ha Arising from gestation period of 3 years Processing Cost of converting FFB into CPO Sub-Total (Gross Cost of Cultivation & processing / Ha) Less : Sale proceeds of by-product (Palm Nuts) Total (Net Cost of Cultivation /Ha) Cost of Production of CPO (Rs./ MT) Rs. 1800/MT for 20 MT of FFB Rs. 2000/MT for 2 MT of Palm Nuts Yield rate being 4 MT/Ha Note: This is a tentative estimate, based on discussions with experts including from Directorate of Oil Palm Research, Pedavegi (AP) 2.58 Against the estimated domestic cost of production at Rs per MT, the prices of palm oil in international market were ruling at Rs per MT and Rs per MT during Q4 of and Q1 of respectively. The trend price could be a little lower than Rs.5000 per MT (Chart-2.15). However, landed price would be somewhat higher. Thus, it would still make a sense to propagate cultivation of palm oil in various parts of the country
57 Chart-2.15 : Behaviour of Prices of Palm Oil in International Market 2.59 Based on WPI, prices of edible oils increased, on an average by 9.1 percent during (up to June, 2011) compared to 5.4 per cent in , the increase being in the range between 6.2 percent and 13.1 percent (soyabean) due to surging international prices. Oil Palm in India: A way forward 2.60 The empirical evidence shown by Indonesia and Malaysia does suggest that palm oil has high potential to spread in India as a perspective and long-term source of edible oils. Encouraged by these success stories, Oil Palm Development Programme (OPDP) was launched during under the Technology Mission on Oilseeds and Pulses (TMOP) and is being implemented as a part of Integrated Scheme of Oilseeds, Pulses, Oil Palm and Maize (ISOPOM) from to support palm oil cultivation in 12 states. The present target for area expansion of hectares for oil palm under Rashtriya Krishi Vikas Yojana (RKVY) to augment the production of palm oil by lakh tonnes in the next five years with an outlay of Rs. 300 crore does not provide adequate measure to reach at the production potential level of 4-5 million tonnes of palm oil. Upto , oil palm has covered gross area under cultivation of 1.73 lakh hectares, out of which about hectares were uprooted being non-remunerative to the farmers and the net area remained at 1.55 lakh hectares as against the estimated potential area of lakh hectares (Chadda Committee). During , CPO production was low at MT. The reasons
58 behind low performance includes non availability of quality seed and planting material, inadequate guidance /extension services for new plantations, inadequate water availability, inadequate pricing formula for Fresh Fruit Bunches (FFBs) and lack of Market Intervention System (MIS). Given the shelf life of FFB being about 24 hours, it entails its own risk of non-procurement / not purchasing of the produce by processing units. There are some authentic reports from Mizoram, for instance, when farmers were constrained to destroy their palm cultivation due to non existence of appropriate forward linkages in terms of market intervention. To instill confidence among farmers so as to boost acreage under palm oil cultivation and thereby reducing dependence on imports of palm oil in a phased manner, CACP recommends that the Government extend adequate financial support to palm oil cultivators, particularly extend full compensation against the loss of income during the first four years of the gestation period of plantation besides taking adequate measures for marketing arrangements by the processing plants. It is also imperative that a scientific study be commissioned by the CACP to deepen the understanding of cost of cultivation of FFB of palm oil including processing cost of conversion of FFB into refined edible palm oil and how it can be reduced The total production of oilseeds in the country during is estimated at million MT (Fourth Advance Estimates). This is up by 25% compared to the level achieved in previous year. The production has increased mainly due to higher productivity. The trends in the area, production and yield levels of oilseeds have been depicted in Chart Record Production of Oilseeds 44 45
 and safflower are the main oilseeds cultivated in various agro-climatic zones in India.")
59 Chart-2.16: Area, Production and Yield of Oilseeds 2.62 Groundnut, soyabean, sunflower, nigerseed, sesamum seed, castorseed, linseed, rapeseed/mustard (R & M) and safflower are the main oilseeds cultivated in various agro-climatic zones in India. Of these, groundnut, soyabean, and R & M are major oilseed crops in the country both in terms of area and production, accounting for about 82 per cent of total oilseeds area and about 90 percent of its total production. The shares of various oilseeds in the production in are depicted in Chart Chart-2.17: All India Oilseeds: Crop wise Production 1 The reasons for increase in productivity level have been discussed in previous subsection.

60 The major oilseeds producing states are Madhya Pradesh, Rajasthan, Maharashtra, Gujarat, Andhra Pradesh, Karnataka, Uttar Pradesh, Tamil Nadu and Haryana. R & M contributed about 75 per cent of the total Rabi oilseeds production in The crop-wise oil contribution of different oilseed crops is given in Chart Chart-2.18: Share of oil crops in edible oil The causes of low yields of oilseed crops, inter-alia, includes inadequate irrigation facilities and consequent dependence on aberrant weather conditions, non-availability of quality seeds / hybrid seeds, lack of improved farm practices, lack of disease and pest management controls, poor extension services. Though oilseed crops generally require much less water for irrigation, providing protective irrigation along with improved agronomic practices would go a long way to improve productivity. The Commission reiterates its earlier recommendation to increase availability of water for irrigation through appropriate recharge technologies such as moving surface water channels to improve water tables in deficient areas so as to maintain minimum moisture in soil required to protect the oilseed crops. Besides adequate irrigation facilities, easy accessibility to improved technology, farm implements, quality disease resistant seeds and appropriate extension facilities be provided to turn around productivity of the oilseeds. Inadequate irrigation in tandem with non-availability of quality seeds cause low productivity 46 47
61 Moderate increase in prices of major oilseeds Volatility in international prices calls for periodical review of import duties Moderate increase of 1.9 percent in world production of oilseeds 2.64 The wholesale price index (base =100) of oilseeds averaged at in , an increase of 2.9 percent over the previous year further increased to (4.7 percent) in The average price index during (April to June 2011) showed a higher increase of 9.2 percent due to global effect of price rise. The prices of oilseeds during increased for almost all crops except soyabean, mustard, and nigerseed which declined by 9.1 percent, 3.0 percent and 15.1 percent respectively. However, prices of soyabean and nigerseed increased by 9.7 percent and 2.5 percent respectively during the first three months of current year, prices of mustard ebbed by 0.4 percent The import duty structure of edible oils has been reviewed from time to time, depending on the domestic requirement and supply positions. To check the rising prices under control, the import duties for edible oils that were high at 88.9 percent in and 78.2 percent in were reduced significantly to 7.5 per cent in the case of refined oil and zero percent for crude edible oils w.e.f. 1st April Besides this, export of major edible oils was banned from except for a small quantity in 5 kg packages. Moreover, the tariff values for import of edible oils, which were fixed in 2006 have not been revised even though the import prices of oils have increased more than two fold. This encouraged import of refined oils because actual import duties paid became much less than the 7.5 percent fixed. When prices go sky high, we need to reduce import duty and increase it when prices exhibit downward trend FAO price indices (Oct-May) for oilseeds and oils/fats showed an increase of 35 percent and 54 percent in over As the overall supply is expected to just match with demand in , the prices increased mainly due to pressure on stocks, downward correction in palm oil and soyabean production forecasts, continued strong demand from utilization of oils for biodiesel production, prolonged weakness of US Dollar and spillover effects from tight grain markets. FAO s supply and demand forecast for (October- September) suggests sustained global prices of oils/fats due to tight demand-supply equation, rising of demand by 3-6 percent and likely reduction in stocks.
62 The world supply and demand position in respect of oilseeds and products is shown in Table Table-2.16: World Oilseeds and Products Market Product estimate forecast Total Oilseeds Production Oils and Fats Production Supply Utilisation Trade Stock-to-utilization ratio (%) FAO Price Indices (Oct-Sep) Oct-May Oilseeds Oils/fats Source: FAO, Food Outlook, June Rapeseed & Mustard (R & M) 2.67 Rapeseed & Mustard (R & M) contributed about 75 percent of the rabi oilseeds and 25 percent of the total oilseeds production in the country in The area, production and yield of R & M during last 5 years are exhibited in table Table-2.17 : Area, Production & Yield of R & M ( 000 Ha., 000 MT, Kg/Ha) Year Area Production Yield The trends in area, production and yield of R & M from to are depicted in Chart Change % ( over ) Oct-May over Oct-May % 48 49
63 Chart-2.19 : Area, Production and Yield of R & M during to Cost of Production /Conversion /of Mustard Oil 2.68 With a view to compare and contrast the landing cost of palm oil (which constituted 69.58% of the total edible oils imported to India during ), it is imperative to work out the cost of production of important domestic edible oil such as mustard oil. The relevant cost components are exhibited in table Table-2.18: Cost of Conversion of R & M Seeds into Mustard oil (Estimated) (Rs. /MT) Cost of Mustard seed (loose) Conversion Cost i. Power 600 ii. Steam 150 iii. Labour 450 iv. Miscellaneous /Overheads 300 Sub-Total 1500 Total Cost Less : Proceeds from sale of oil cake 8241 Rs.12300/MT) Net Cost of Production of 310 kgs of oil (Assuming recovery rate at 31% & processing loss-2%) Cost of Production of oil (Rs./MT) Source: Based on discussions held with experts including those from the Directorate of Vanaspati, Vegetable oils & Fats
64 Against an estimated cost of production of Rs /kg., the average ruling price of the mustard oil in the Q1 of was Rs.68.89/kg. which is 1.34 times that of the palm oil (Table-2.19). Table-2.19 : Prices of Rapeseed & Mustard Seeds, Mustard oil and Palm oil in Domestic Market in India (Rs./Quintal, Ratio) Quarterly R&M Seed Mustard Oil Palm Oil Prices of Mustard oil to Palm Oil (Ratio) Prices of Mustard oil to R & M Seeds (Ratio) (Q1) (Q2) (Q3) (Q4) (Q1) (Q2) (Q3) (Q4) (Q1) (Q2) (Q3) (Q4) (Q1) (Q2) (Q3) (Q4) (Q1) (Q2) (Q3) (Q4) (Q1) The future prices of mustard seed are expected to increase to Rs.3101/- per quintal in Nov, 2011 according to NCDEX against Rs. 2945/- per quintal (as on ). The trends in prices of R&M seeds vis-à-vis mustard oil and palm oil are depicted in Chart
65 Chart-2.20: Prices of R & M seeds, Mustard Oil and Palm Oil 2.69 It may be noted that there is a great deal of fluctuations not only in prices of the two oils over time but also in their relative prices in any given year. In other words, there is both temporal and cross sectional fluctuations in prices of two oils under reference. The inter-oil prices (ratio) varied in the range of 1.20 to 2.80, that is to say that while the price of mustard oil was higher only by 20% than that of palm oil in certain period (the last quarter of ), it was 180% higher in some other period (the third quarter of ). However, the prices of mustard oil have always ruled above those of palm oil. This is hardly surprising, given superior dietary value and taste preference for mustard oil in the country Another interesting point that is worthwhile noting is high processing cost 2 of mustard oil as is implied by high ratio (almost 3 times) of mustard oil to R & M seeds which is explained by reservation of this sector for Micro and Small enterprises. This in turn constraints capacity expansion and deprives the nation the benefits of economy of scale. Given the fact that India s import bill on account of edible oil was over Rs. 29,000 crores during , processing of mustard oil be open to large units in the country. The reason(s) of fluctuations in the inter-oil prices of the two oils could be investigated by commissioning a comprehensive study on Diagnostic Study of Edible Oils : Economics of Production 2 Includes traders margins
66 of various Oils, Consumer preferences, Constraints to switch over from one oil to another, Solutions and Way Forward. This study, inter-alia, may cover edible oils from secondary sources which contribute about one-fourth of the net domestic availability. Chart 2.21: Behaviour of Prices of Rapeseed-Mustard MSP for Sunflower has been fixed at Rs. 2800/- per quintal and that of groundnut at Rs.2700/- per quintal for Against this, the MSP for R & M was Rs.1850 for the corresponding period which has distorted inter-crop price parity, given the fact that MSP for R &M for to had been consistently higher than those of other oilseeds in each of these 4 years as may be seen from Table Table 2.20: MSP of various Oilseeds during to Lack of inter-oilseeds Price Parity: Need for correction (Rs/Quintal) Year R & M Safflower Ground Nut Sunflower Soyabean
67 Average ( to ) Average ( to ) Average Increase (%) The average increase in MSP during to over a block of earlier four years ( to ) was highest in case of sunflower (64%) followed by groundnut (51%) and soyabeans (45%). In contrast, increase in R & M and safflower was below 10%. This distortion needs to be corrected. Technological breakthrough in R&M called for 2.72 As noted in the preceding paragraph, the prices of mustard oil have been and continue to rule above palm oil for valid reason of its superior dietary value and taste preference. Nonetheless, it is imperative to introduce/adopt new technology so as to improve productivity and thereby reduce the cost of production of both R&M oilseeds and mustard oil. To achieve this, new varieties developed by the Directorate of Rapeseed & Mustard Research, Bharatpur (Rajasthan), may be adopted. These new varieties which include one hybrid seed, are enumerated as under: NRCDR-02 : High yielding Indian Mustard variety suitable for Punjab, Haryana, Delhi and Rajasthan NRCHB-506 : The first Indian Mustard Hybrid with high yield quality suitable for UP and Rajasthan NRCHB-101 : Indian Mustard variety suitable for late sown irrigated conditions in UP, MP and parts of Rajasthan NRCDR-601 : Indian Mustard variety suitable for timely sown in Punjab, Haryana, Delhi and Rajasthan NRCYS : Yellow sarson variety suitable to all Yellow sarson growing regions of the country
68 2.73 Rajasthan is the leading producer of the crop which contributed 50% both in terms of area and production in Other major producing states include, Haryana, M.P., Uttar Pradesh West Bengal and Gujarat as may be seen from the Table R & M : State-wise Scenario Table 2.21: State-wise Area, Production, Irrigation, Yield, SRR and use of Fertilizer in R& M ( 000 Ha., 000 MT, Kg/Ha) State Area Production Yield Irrigation Area (%) SRR (%) Share of Production Rajasthan Haryana M.P U.P W. Bengal Gujarat Punjab All India The states of Rajasthan, Haryana, and M.P. contribute three-fourth of the total production of R & M during It is noted that the productivity of Haryana is the highest at 1869 kg/ha.followed by Gujarat at 1521 kg/ha.which is due to high level of irrigation accompanied by high rate of SRR. Safflower 2.74 The production in case of Safflower has been declining with some fluctuations mainly due to reduction in its area coverage. The area, production and yield of R & M during last 5 years are exhibited in the table Table 2.22 : Area, Production, Irrigation, Yield of Safflower ( 000 Ha., 000 MT, Kg/Ha) Year Area Production Yield
69 The safflower cultivation has been continuously declining while the yield rate has stagnated at around 642 kg/ha, thus total production has significantly declined. This may be due to its low productivity and stagnant MSP for 3 years ( to ). Productivity levels in India compared to other countries and of the world average present not very encouraging scenario, as may be seen from the Table Table 2.23: Productivity Levels in Major Producing Countries (2009) (Yield in kg/ha) Country Rapeseed/ Mustard Safflower China Canada India Germany France Mexico USA World The yield of Rapeseed/Mustard stands at 27 percent and 30 percent of the yield levels of Germany and France and about 58 percent and 61 percent of the world average and China respectively. Similarly, the yield level of Safflower was at about 40 percent of the yield of China and USA and about three fourth of the world average. The low levels of yield rate can be turned around by providing appropriate irrigation facilities in tandem with supply of quality seeds and a nudge of price support The Commission (CACP) recommends the following: a. Against the estimated domestic cost of production at Rs.44 per kg, the prices of palm oil in international market were ruling at Rs. 57 per kg and Rs. 52 per kg during Q4 of and Q1 of respectively. Based on trend, the prices are expected to be subdued to a level of about Rs.50 per kg.
70 It still would make a sense to propagate cultivation of palm oil and reduce dependence on imported oil. This calls for boosting acreage under palm oil cultivation, making available quality seed and planting material, ensuring adequate water availability, extending quality guidance /extension services for new plantations, providing marketing arrangements such as Market Intervention System (MIS) for Fresh Fruit Bunches (FFBs). The Commission also recommends that the Government extend adequate financial support to palm oil cultivators, particularly for full compensation for the loss of income during the first four years of the gestation period of plantation. b. It is imperative that a comprehensive study be commissioned by CACP to deepen the understanding of cost of cultivation of FFB of palm oil including processing cost of conversion of FFB into refined edible palm oil. c. The share of secondary sources of oils such as cottonseed, coconuts, rice bran, solvent extracted oils, oil from tree & forest origin in the total edible oils is quite significant at lakh MT. However, there seems to exist no policy on enhancing its production. Its importance has to be propagated. d. The processing cost of mustard oil is quite high which seems to be mainly due to reservation of this sector for Micro and Small enterprises. This in turn constraints capacity expansion and deprives the nation the benefits of economy of scale. Given the fact that India s import bill on account of edible oil was over Rs. 29,000 crores during , processing of mustard oil be open to large units in the country. e. The Commission reiterates its earlier recommendation to increase availability of water for irrigation through appropriate recharge technologies such as moving surface water channels to improve water tables in deficient areas so as to maintain minimum moisture in soil required to protect the oilseed crops. Besides adequate irrigation facilities, easy accessibility to improved technology, farm implements, quality disease resistant seeds, credit and appropriate extension facilities be provided to turn around productivity of the oilseeds
71 f. The empirical evidence suggests that there exists a high correlation between productivity and combination of SRR and irrigation. Therefore, it is high time to lay emphasis on irrigation in tandem with SRR.
72 Chapter 3
73
74 Costs, Profits, Inter-crop Price Parity and Terms of Trade 3.1 Cost of cultivation/production estimates remain the most contentious since majority of farmers point out that these are underreported. In a meeting held by the Commission with a number of stake-holders such as state governments, farmer s representatives and other concerned line ministries during 15th to 17th June, 2011 in New Delhi, farmer representatives from across the states expressed concerns that the price support is not remunerative enough to them. Against this backdrop, the Commission has analyzed the costs and profits of rabi crops during the three years to for which actual cost data is available from Directorate of Economics & Statistics (DES). Three parameters related to cost and revenue have been considered for the purpose. These are: actual paid-out cost plus imputed value of family labour (A2+FL), total cost (C2) and gross value of output all in rupees per hectare. Analytical distinction between these two categories of cost, namely, A2+FL and C2 is that the former covers all expenses in cash and kind including actual rent incurred by the tenant farmer on leased in land plus the imputed value of family labour used on the farm, and the later covers in addition to A2+FL imputed value of land rent on owner operated holdings as per the provisions of Land Rent Act of the relevant state, and imputed interest on fixed capital in farm building, storage, etc. This analytical distinction in cost is important in estimation of profitability over the two categories of cost. 59
75 Broadly A 2 +FL covers tenant holdings and C 2, owner operated holdings; owner operated holdings take into account imputed value of land rent and imputed interest on fixed capital., etc Costs and Profitability of Rabi Crops in Recent Past ( to ) 3.2 It is relevant to mention that the gross value of output in the methodology of cost calculation is estimated at the prevailing market prices during harvest season in the village/cluster of villages where crops are grown and harvested. With this caveat, it is observed as in Table 3.1 that on per hectare basis, on average, net revenue for wheat over A2+FL cost works out to Rs during the period to , with net revenue recording increase from Rs per hectare in to Rs in Table-3.1: Profitability (Net revenue) over actual Cost of Production (Average of to ) Crop Cost A 2 +FL (Rs./ha.) Cost C 2 (Rs./ ha.) GVO (Rs./ ha.) Profits (Net Revenue on A 2 +FL basis) (Rs./ ha.) Profitability (Net Revenue as % of A 2 +FL ) Profits (Net Revenue on C 2 basis) (Rs./ha.) Profitability (Net Revenue as % of C 2 ) Wheat Gram Rapeseed & Mustard Lentil Barley Source: Comprehensive Scheme for studying the Cost of Cultivation of Principal Crops, Directorate of Economics and Statistics, Ministry of Agriculture, New Delhit Notes: 1: Comprehensive Scheme (CS): Actual estimates for the years , and by states have been weight averaged at all-india level, with weights being their relative shares in total production of states. 2: CACP projected estimates of C2 exclusive of marketing, transportation and crop insurance charges based on the latest available data at the time of price policy formulation. The projection made with revising upward the price of various inputs for studying increase in overall variable cost. 3. GVO indicates Gross value of output In terms of profitability (net revenue in percentage over the relevant cost), it averaged percent during to over cost A2+FL and per cent over cost C2. The difference in
76 profitability on A2+FL and C2 for wheat by about 90 per cent lies broadly in difference in cost of tenant and owner operated cultivation of wheat. 3.3 Taking the broad picture of per hectare net revenue on C2, it is evident that it is maximum for wheat at Rs ; followed by rapeseed/mustard at Rs ; barley, at Rs ; lentil, at Rs ; gram, at Rs during to Chart 3.1 represents the net revenue on C2 cost in absolute and percentage terms. The lowest revenue for gram at Rs per hectare has the lowest profitability of percent in contrast to which rapeseed/mustard earns the revenue of Rs per hectare with the highest profitability of percent among rabi crops considered in the analysis. Profitability of wheat at percent lies between that of barley at percent and that of lentil at percent. Anatomy of per hectare revenue for five important rabi crops perhaps indicates the need for enhanced productivity and price support for gram and lentil relative to that for barley and wheat. It may be mentioned here that productivity (yields) is an important determinant of farm incomes, and is strongly influenced by the quality of seeds (technology), irrigation, fertilizers, agro-practices, etc. Price (MSP) is the other important variable influencing farmers incomes. And the two need to work in harmony to give best results for the farmers. Profitability over A2+FL for lentil is maximum at per cent; for rapeseed/ mustard at per cent, wheat at per cent, etc. In absolute terms wheat has the maximum profit at Rs per hectare on A 2 +FL and Rs per hectare over C 2 The lowest profit for gram is at Rs per hectare over C 2 Chart 3.1 : Crop Profitability (Avg to ) Source: Derived from actual estimates of Comprehensive Scheme for studying the Cost of Cultivation of Principal Crops, Directorate of Economics and Statistics, Ministry of Agriculture, New Delhi 60 61
77 Profitability ratio a resultant interaction of market prices governed by demand and supply as well as productivity 3.4 However, when one talks of price (MSP) policy, it may be noted that cost of production is only one of the factors in determination of MSP. There are other equally important market specific factors like demand and supply balance, inter-crop price parity, trends in domestic and international prices, terms of trade between agriculture and non-agriculture, effect on cost of living and industrial cost structure, etc. that the Commission considers while recommending its price policy. Discussion on this would be taken up later on. Profitability ratio for any crop is a resultant interaction of market prices governed by demand and supply as well as productivity. MSP plays a role in this interaction when it serves as a benchmark price and functions as an overall price signal in the market for that commodity. Trends in Agricultural Wage Rate At all-india level, on an average between 2007 and 2010 increase in wage rate in nominal terms has been per cent; in real terms it is per cent. MNREGA wage rate has increased amongst states from Rs per day in 2009 to Rs in This is believed to have pushed up real wage rates on the farms 3.5 Rising trends in agricultural wage rate in recent past have contributed to the input cost of cultivation. At all-india level nominal wage rate increase in January, 2011 over the corresponding month of the preceding year was 23.5 per cent, with Orissa reporting the highest increase by 45.4 per cent; Kerala, by 29.3 per cent; Maharashtra and Tamil Nadu, by 28.9 per cent; Andhra Pradesh, by 25.8 per cent, etc. Rajasthan, Himachal Pradesh, Gujarat reported increase in the minimum range of 8 to 10 per cent during the same period. 3.6 Table 3.2 shows the average wage rate at all-india level that increased by per cent in 2008 over 2007, per cent in 2009 over 2008, and per cent in 2010 over The considerable increase in farm wage rate has no doubt put pressure on prices of farm produce. There seem to be many factors at work that are pushing the wage rates up. Farmers often claim that Mahatma Gandhi National Rural Employment Guarantee Scheme (Mahatma Gandhi NREGA) that assures at least 100 days of employment has starved the farm sector of the adequate supply of agricultural labour. But there could be growing pace of construction activity in the nearby towns and cities too that is pulling up the rural wage rates. Since wage rates under MNREGA act more like a floor rate of labour (call it MSP of labour), and since this floor rate has increased among states from Rs per day in 2009 to Rs.117-
78 Table 3.2: Trends of increase in average rural agriculture labour wage rate(rs/day) for states and at all-india level ( ) State Relative share in agricultural rural labour Average wage rate, (Jan- Dec) 2007 Average wage rate, (Jan- Dec) 2008 Average wage rate, (Jan- Dec) 2009 Average wage rate, (Jan- Dec) 2010 % increase in the ave. wage rate 2008 over 2007 % increase in the ave. wage rate 2009 over 2008 % increase in the ave. wage rate 2010 over 2009 % increase in the ave. wage rate 2010 over 2007 % increase in the real ave. wage rate 2010 over 2007 AP Assam Bihar Gujarat Haryana HP Karnataka Kerala MP Maharashtra Orissa Punjab Rajas-than TN UP WB All-India wt. avg % increase in Ave. CPIAL (Agricultural Labour) 2010 over 2007 Source: Labour Bureau, Ministry of Labour, Govt. of India, State wise relative shares in total agricultural rural labour are derived from Cen sus, 2001,Registrar General of India Note: Daily Wage rate - average of five operations i.e. ploughing, Sowing, Weeding, Transplanting and harvesting has been considered
79 179 in 2011, there is reason to believe that it must have pushed the rural wage rates on the farms much more simply because farms require much more rigorous work than is reportedly coming from MNREGA scheme. 3.7 As can be seen from Table 3.2, during the period 2007 to 2010, on average the cost of living measured in terms of consumer price index for agricultural labour has gone up to per cent. This proves that in real terms agricultural wage rate has gone up by percent in the said period as against percent in nominal terms. Input Price Movement Input prices have recorded increase. Considerably for fertilizers (7.63 per cent); diesel oil (LDO per cent), tractors (8.71 per cent), etc. 3.8 Wholesale Price Indices (WPI) with base =100 for farm inputs during the period June, 2010 to May, 2011 reveal that it has increased by per cent for diesel oil (LDO), per cent for lubricants, 8.71 per cent for tractors and 7.63 per cent for fertilizers as a whole. The increased price in real terms for these inputs during this period would have upward pressure on input cost of production for rabi crops Other inputs like electricity for irrigation, pesticides, non-electrical machinery, fodder, cattle feed and diesel oil (HSDO) prices increased ranging from about 1 to 4.5 per cent. The chart 3.2 underlines wholesale price index for June, 2010 and May, 2011 for farm inputs and their percentage increase during the period June, 2010 to May, Chart 3.2: Increase in Input Prices
80 Terms of Trade Analysis 3.9 The domestic terms of trade between agriculture and non-agriculture were recognized as a term of reference for CACP in recommending its MSP policy in 1980s. It is undeniable that farmer s decisions are influenced not only by prices he receives for his produce but also by prices he pays for goods and services purchased by him. Moreover, the relative shifts in prices of agricultural and nonagricultural commodities over time have a direct bearing on the welfare of the farm sector. However, a glance at the terms of trade data compiled by the Directorate of Economics & Statistics, Department of Agriculture and Cooperation reveals a certain scenario. The methodology for generating terms of trade data is quite meticulous as the basket of goods and services is prepared for goods sold by the agricultural sector and for goods purchased by it. Among the goods purchased for the sector are broad categories of goods for final consumption, intermediate consumption and for capital consumption. Commodities baskets include only those goods traded between these two sectors. It is remarkable to mention here that since the commodities baskets have been prepared way back in ; terms of trade data as thrown up by the Directorate of Economics & Statistics may not be as reflective as expected. A new committee may be constituted to incorporate the changes in revising the basket of goods and services being purchased and sold by farmers. Terms of trade data available upto the year (provisional) are given in Table 3.3. As can be seen the index of terms of trade has remained relatively stable, and in fact, marginally favored agriculture in recent years. With base year TE =100 the index has been oscillating between 100 and 105 since with index at in it has gone up to in Terms of trade index, a measure of relative movement of prices of agriculture, vis-a-vis nonagriculture has been oscillating between since and it stands at in Overall it is not adverse against agriculture
81 Year Index of Prices Received (IPR) Table 3.3: Index of Terms of Trade Between Agriculture and Non Agriculture Sectors Triennium Ending =100 Index of Prices Paid (IPP) for Index of Capital Combined Terms of Formation Index Trade (ITT) Final Consumption Intermediate Consumption Weights * * * Source: Directorate of Economics and Statistics, Ministry of Agriculture, New Delhi * Provisional
82 Actual Cost Estimates of Cultivation/Production and Projections for Crop Season 3.10 The exercise of cost analysis with a view to projecting the cost of production for the year begins with the actual estimates for rabi crops made available to the Commission by the Directorate of Economics & Statistics, Department of Agriculture and Cooperation. The latest data available for wheat, barley, gram, lentil, rapeseed & mustard and safflower are for the year The Commission projects for , with actual cost estimates of as basis In order to arrive at the likely cost of production of different rabi crops for the ensuing season , the per hectare variable input cost were projected, using the methodology of projecting input prices for the ensuing season with the help of the latest series of data on wage rates, fertilizer prices, seed prices, irrigation charges, etc. The movement of input prices being crucial to estimating cost of production per quintal for the year , the Commission has taken account of the updated data on prices of inputs and has computed for each state and crop weighted composite input price index, weights being the share of each input in the total operational cost net of interest. The weighted composite input price index estimated for the year 2011 provides a clue to how much input price, in general, is expected to go up for the ensuing crop season under consideration, compared to each of the latest three years actual input prices. The projected all-india paid out cost, including family labour (A2+FL) per quintal, and overall cost (C2) per quintal have been arrived at by taking weighted average cost of respective states specific estimated costs, weights being their respective shares in the total production. These estimated costs are reported in Tables 3.4 to 3.8, and charts 3.3 to 3.7 for wheat, barley, gram, lentil, and rapeseed-mustard, respectively. These tables and charts also give margins, based on crop-specific MSPs, over corresponding costs
83 Table 3.4 Projected Production Cost (C 2 & A 2 +FL) for for wheat by States & their Shares and Margins in Increasing Order of Cost (Rs./qtl) States C 2 A 2 +FL MSP ( ) Relative Shares in Production (%) MSP margins over C 2 Cost (%) MSP margins over A2+FL Cost (%) Gujarat Bihar Rajasthan Haryana Uttarakhand Punjab Uttar Pradesh Madhya Pradesh West Bengal Himachal Pradesh Chattisgarh Jharkhand All India Wt. Av. Cost Chart 3.3 : Projected Costs of Production of Wheat
84 Table 3.5 Projected Production Cost (C 2 & A 2 +FL) for for barley by States & their Shares and Margins in Increasing Order of Cost (Rs./qtl) States C 2 A 2 + FL MSP ( ) Relative Shares in Production (%) MSP margins over C 2 Cost (%) MSP margins over A 2 +FLCost (%) Raj UP All India Wt. Av. Cost Chart 3.4: Projected Costs of Production of Barley 68 69
85 Table 3.6 Projected Production Cost (C 2 & A 2 +FL) for for gram by States & their Shares and Margins in Increasing Order of Cost (Rs./qtl) States C 2 A 2 + FL MSP ( ) Relative Shares in Production (%) MSP margins over C 2 Cost (%) MSP margins over A 2 +FLCost (%) Bihar Chhattisgarh Madhya Pradesh Jharkhand Rajasthan Andhra Pradesh Uttar Pradesh Maharashtra Haryana All India Wt. Av. Cost Chart 3.5 : Costs of Production of Gram
86 Table 3.7 Projected Production Cost (C 2 & A 2 +FL) for for lentil by States & their Shares and Margins in Increasing Order of Cost (Rs./qtl) States C 2 A 2 + FL MSP ( ) Relative Shares in Production (%) MSP margins over C 2 Cost (%) MSP margins over A 2 +FLCost (%) Jharkhand Bihar Madhya Pradesh Uttar Pradesh All India Wt. Av. Cost Chart 3.6: Projected Costs of Production of Lentils 70 71
87 Table 3.8: Projected Production Cost (C 2 & A 2 +FL) for for rapeseed & mustard by States & their Shares and Margins in Increasing Order of Cost (Rs./qtl) States C 2 A 2 + FL MSP ( ) Relative Shares in Production (%) MSP margins over C 2 Cost (%) MSP margins over A 2 +FLCost (%) Gujarat Rajasthan Madhya Pradesh Haryana Uttar Pradesh West Bengal Assam All India Wt. Av. Cost Chart 3.7 : Projected Costs of Production of Rapeseed-Mustard
88 Inter-Crop Price Parity 3.12 Inter-crop price parity is one of the determinants of minimum support price (MSP). The idea underlying this factor demands that area allocation among different crops be such that their respective per hectare net returns are more or less even and balanced. In other words, for competing crops, cultivation of any one of them would be broadly price neutral if price policy embeds in itself the factor of inter crop parity. Average per hectare returns on C 2 as analysed above for rabi crops show that there is some degree of inequality in revenue earned. Taking revenue on wheat cultivation as numeraire, it is seen that revenue on gram on average is 46 per cent less, on rapeseed and mustard, 7 percent less; on lentil, 30 percent less; and on barley, 17 percent less. In correlating these return ratios of rabi crops with their relative price structure in terms of WPI for (upto June, 2011), the parity question is brought into view. Table 3.9 may be seen in this regard. Inter crop price parity analysis of different competing rabi crops reveals some degree of inequality in revenue earned. Table 3.9 Inter-Crop Price Parity Parameters Crop Net Revenue on C 2 basis (Rs./ha.) Return ratio with respect to Wheat as numeraire Average WPI upto June Price movement ratio with respect to wheat as numeraire MSP (Rs./qtl) ( ) Wheat Gram Rapeseed & Mustard Lentil Barley Likely trends are observed in prices of rabi crops, with wheat price index treated as numeraire. Revenue on gram is 46 percent less relative to that of wheat, with its relative price movement up by 20 per cent. Assuming that MSP is fixed for wheat at level of Rs per quintal, MSP for grams needs to be enhanced at the least by 20 per cent. In recent years compared to movement of wheat 72 73
89 prices in the wholesale market, prices of rapeseed and mustard have increased at a lower rate. The relative price movement of rapeseed and mustard is 21 per cent less and its relative revenue is only 7 per cent less with respect to wheat. Restructured and Modified Cost of Production Revenue on gram on an average is 40 per cent less; rapeseed/mustard, 7 per cent less; lentil, 40 per cent less; barley, 17 per cent less; compared to that on wheat As has been reiterated in earlier reports, the Directorate of Economics & Statistics, Department of Agriculture & Cooperation is yet to furnish state-wise and crop-wise estimates on marketing, transportation, and crop insurance premium. The Commission based on adhoc information furnished by the different state governments compiles at all-india level these estimates crop wise, and adds these in the projected cost of production estimates. The practice of projecting costs has been in vogue for years at CACP. To ensure that this projection methodology is correct, an internal exercise was undertaken to see how far the projected costs were close enough to the actual costs that are often made available by DES after a gap of two to three years. It was found that in earlier years of 2000, the gap was very minimal both in A2+FL as well as C2 cost concepts. However, in later years, the gap for C2 increased compared to that of A2+FL. If one adjusts for this gap, obviously the adjusted cost would increase. This has been kept in mind while recommending price policy.
90 Chapter 4
91