REMOTE SENSING: DISRUPTIVE TECHNOLOGY IN AGRICULTURE? DIPAK PAUDYAL
|
|
|
- Hilda Lawson
- 5 years ago
- Views:
Transcription

1 Place image here (13.33 x 3.5 ) REMOTE SENSING: DISRUPTIVE TECHNOLOGY IN AGRICULTURE? DIPAK PAUDYAL Principal Consultant, Remote Sensing- Esri Australia Adjunct Associate Prof., University of Queensland Member RS&P Commission, SSSI

2 How can remote sensing help? Tailor management decisions by using modern crop science techniques scientifically-proven approaches that analyze remotely sensed data such as satellite and UAV imagery. Provide tools to allow agronomists, GIS analysts, and agricultural implementers to all explore data, visualize results, map locations, and prototype workflow. Analyse data resulting in crop health and statistics reports, location analytics, and more, to help maximize yields and boost profits. ENVI Crop Science

3 Typical Remote sensing Scientific Applications Answer questions about a current point in time I just went and flew my field. Is the nitrogen I applied last week having an effect? Identify similar regions My irrigation system had a malfunction. How much of my field is being affected? Count the number of crops That frost last week was devastating! How many plants did we lose? Collect statistics about an individual plant The trees in the southeast corner look healthy, but they seem a little smaller. How big are my trees? ENVI Crop Science 3
4 ENVI Crop Science Minimize Losses to Maximize Yields Crop Counter With the Crop Counter tool, users can accurately extract the number, position, and size of the individual plants in a field to predict yield. ENVI Crop Science analyzes multispectral data to provide extensive crop health information, even to users who have little to no experience with remote sensing techniques Hotspot Analysis Using proven geospatial statistical analytics, our Hotspot Analysis tool can determine regions of a field that require more attention than others. ENVI Crop Science 4


5 Where is Imagery Data Coming From ENVI Crop Science 5
")


6 Normalized Difference Vegetation Index (NDVI) Industry Standard? Healthy Plant Blue Green Red NIR Dead Plant Blue Green Red NIR NDVI of Center Pivot Field ENVI Crop Science 6
: Red Edge Normalized Difference Vegetation Index Modified Red Edge Simple Ratio Index Modified Red Edge")
7 Other VI Options 27 Different Broadband and 51 Total Vegetation Indices Broadband Greenness (5 indices): Normalized Difference Vegetation Index Simple Ratio Index Enhanced Vegetation Index Atmospherically Resistant Vegetation Index Sum Green Index Narrowband Greenness (7 indices): Red Edge Normalized Difference Vegetation Index Modified Red Edge Simple Ratio Index Modified Red Edge Normalized Difference Vegetation Index Vogelmann Red Edge Index 1 Vogelmann Red Edge Index 2 Vogelmann Red Edge Index 3 Red Edge Position Index Light Use Efficiency (3 indices): Photochemical Reflectance Index Structure Insensitive Pigment Index Red Green Ratio Index Canopy Nitrogen (1 index): Normalized Difference Nitrogen Index Dry or Senescent Carbon (3 indices): Normalized Difference Lignin Index Cellulose Absorption Index Plant Senescence Reflectance Index Leaf Pigments (4 indices): Carotenoid Reflectance Index 1 Carotenoid Reflectance Index 2 Anthocyanin Reflectance Index 1 Anthocyanin Reflectance Index 2 Canopy Water Content (4 indices): Water Band Index Normalized Difference Water Index Moisture Stress Index Normalized Difference Infrared Index ENVI Crop Science 7


8 Problems with NDVI Visualization ENVI Crop Science 8


9 Starting crop analytics what could be done? Enhance & Count crops and calculate metrics Use Spectral Indices to calculate vegetation and soil statistics Perform hotspot analysis to identify concentrated locations Extract the health of individual plants Visually represent regions where groups of plants are more/less vigorous Track crop health over time with temporal analysis tools using multispectral and multi-temporal imagery Data courtesy of Airbus ENVI Crop Science


10 Enhance Crops Use the Enhance Crops tool to create an image that enhances individual crops, for input to the Crop Count tool. Enterprise Offering 10

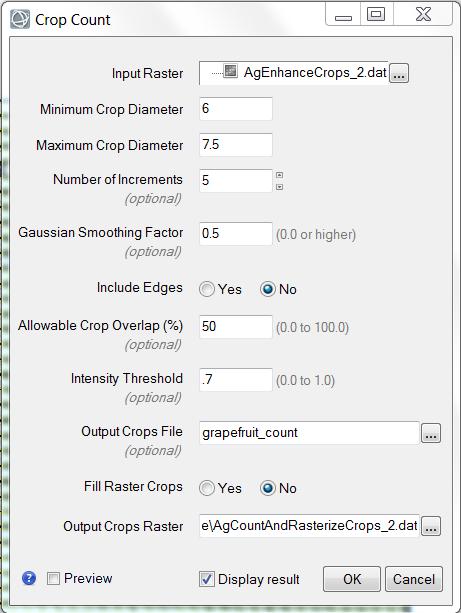
11 Count Crops Enterprise Offering 11


12 Count Crops Citrus Corn Enterprise Offering 12


13 Calculate Crop Metrics with Spectral Index Enterprise Offering 13

14 Hotspot Example Enterprise Offering 14
15 Hotspot Example Enterprise Offering 15

16 Hotspot Example Enterprise Offering 16


17 Hotspot Example Enterprise Offering 17


18 Spectral Hotspot Analysis Enterprise Offering 18


19 Change Detection True Color GNDVI Hot Spot Feb 1 st 2017 Mar 30 th 2017 Enterprise Offering 19

20 Change and Anomaly Detection Feb 1 st 2017 Spider Mite Infestation Mar 30 th 2017 Enterprise Offering 20
")
 ENVI")
21 Real Application Where : Bundaberg, QLD What : Sugarcane Imagery: Sentinel-2 Spectral Indices (LAI, SAVI, GNDVI, BAI) Machine Learning Softmax Regression Classifier Farm level statistics Temporal Monitoring 16 Scenes ( 6 months) ENVI Crop Science


22 Summary - Obtaining actionable results Understand yield See an overview of farm health Row by row analysis Individual plant statistics Time series analysis Enterprise ready and flexible deployment for quicker decisions Enterprise Offering 22

23 Q&A Enterprise Offering 23