WHAT KINDS OF AGRICULTURAL STRATEGIES LEAD TO BROAD-BASED GROWTH?
|
|
|
- Verity Fields
- 5 years ago
- Views:
Transcription


1 WHAT KINDS OF AGRICULTURAL STRATEGIES LEAD TO BROAD-BASED GROWTH? IMPLICATIONS FOR FEED THE FUTURE AGRICULTURAL PROGRAMMING T.S. Jayne and Duncan Boughton Food Security III, Michigan State University USAID Bureau for Food Security May 20, 2011, Washington, D.C.
2 Main issues to be covered 1. What does broad-based growth mean? 2. Why there is no alternative to a smallholder-led agricultural development strategy 3. What is the research evidence on the kinds of public investments and policies that achieve broad-based growth? 4. What are the priority strategies for achieving smallholder-led agricultural growth?


3 I. What does broad-based growth mean?
4 Broad-based growth defined Growth processes that effectively engage a large proportion of the rural population Especially the poor equitable growth Development of agrarian societies has mainly started with broad-based agricultural productivity growth, setting off structural transformation processes
5
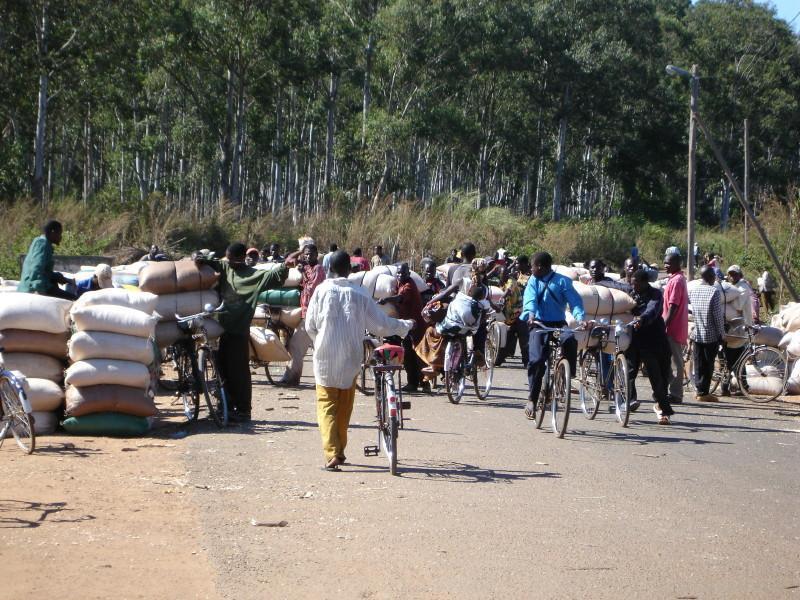
6 Symbiotic relationship between rural farms and towns: urban areas provide a market for surplus farm output Farmers with cash generate demand for urban employment As demand for off-farm jobs rises migration from farm to towns
7 Symbiotic relationship between rural farms and towns: urban areas provide a market for surplus farm output Farmers with cash generate demand for urban employment As demand for off-farm jobs rises migration from farm to towns
8 Symbiotic relationship between rural farms and towns: urban areas provide a market for surplus farm output Farmers with cash generate demand for urban employment As demand for off-farm jobs rises migration from farm to towns
9 Symbiotic relationship between rural farms and towns: urban areas provide a market for surplus farm output Farmers with cash generate demand for urban employment As demand for off-farm jobs rises migration from farm to towns
10 increased urbanization: rural labor pulled to urban areas birth rates declines levels of education rise broad-based agricultural productivity growth starts the process Mellor-Johnston Structural Transformation / Demographic Transition Characterizes the Green Revolution History of Most of Europe, Asia, and North America FUNDAMENTALLY, A SMALLHOLDER-LED MODEL
11 Broad-based growth defined While being a crucial driver of improved living standards, broad-based equitable growth is difficult to achieve.
12 Extreme concentration of marketed maize output Malawi, 2008/09 % of total sample Top 50% of maize sales 1.6 Rest of maize sellers Farm households not selling maize Source: Agricultural Inputs Support Survey (n=1904 farm households), sample frame from National Statistical Office, Government of Malawi
13 Extreme concentration of marketed maize output Malawi, 2008/09 % of total sample Farm size (ha) Top 50% of maize sales Rest of maize sellers Farm households not selling maize Source: Agricultural Inputs Support Survey (n=1904 farm households), sample frame from National Statistical Office, Government of Malawi
14 Extreme concentration of marketed maize output Malawi, 2008/09 % of total sample Farm size (ha) Asset wealth ( 000 kw) Top 50% of maize sales Rest of maize sellers Farm households not selling maize Source: Agricultural Inputs Support Survey (n=1904 farm households), sample frame from National Statistical Office, Government of Malawi
15 Extreme concentration of marketed maize output Malawi, 2008/09 % of total sample Farm size (ha) Asset wealth ( 000 kw) Maize sales (kgs) Top 50% of maize sales ,510 Rest of maize sellers Farm households not selling maize Source: Agricultural Inputs Support Survey (n=1904 farm households), sample frame from National Statistical Office, Government of Malawi
16 Extreme concentration of marketed maize output Malawi, 2008/09 % of total sample Farm size (ha) Asset wealth ( 000 kw) Maize sales (kgs) Total crop sales ( 000 kw) Top 50% of maize sales , Rest of maize sellers Farm households not selling maize Source: Agricultural Inputs Support Survey (n=1904 farm households), sample frame from National Statistical Office, Government of Malawi
17 Extreme concentration of marketed maize output Malawi, 2008/09 % of total sample Farm size (ha) Asset wealth ( 000 kw) Maize sales (kgs) Total crop sales ( 000 kw) Non-farm income ( 000 kw) Top 50% of maize sales , Rest of maize sellers Farm households not selling maize Source: Agricultural Inputs Support Survey (n=1904 farm households), sample frame from National Statistical Office, Government of Malawi
18 Extreme concentration of marketed maize output Malawi, 2008/09 % of total sample Farm size (ha) Asset wealth ( 000 kw) Maize sales (kgs) Total crop sales ( 000 kw) Non-farm income ( 000 kw) female headed (%) Top 50% of maize sales , Rest of maize sellers Farm households not selling maize Source: Agricultural Inputs Support Survey (n=1904 farm households), sample frame from National Statistical Office, Government of Malawi
19 Extreme concentration of marketed maize output Malawi, 2008/09 % of total sample Farm size (ha) Asset wealth ( 000 kw) Maize sales (kgs) Total crop sales ( 000 kw) Non-farm income ( 000 kw) female headed (%) Subsidized fertilizer received (kgs/hh) Top 50% of maize sales , Rest of maize sellers Farm households not selling maize Source: Agricultural Inputs Support Survey (n=1904 farm households), sample frame from National Statistical Office, Government of Malawi
20 Extreme concentration of marketed maize output Malawi, 2008/09 % of total sample Farm size (ha) Asset wealth ( 000 kw) Maize sales (kgs) Total crop sales ( 000 kw) Non-farm income ( 000 kw) female headed (%) Subsidized fertilizer received (kgs/hh) Top 50% of maize sales , Rest of maize sellers Farm households not selling maize Source: Agricultural Inputs Support Survey (n=1904 farm households), sample frame from National Statistical Office, Government of Malawi


21 Two major challenges for success of broad-based agricultural commercialization strategies: 1. Addressing asset constraints that prevent a large % of rural population from being able to respond to growth opportunities and incentives 2. Raising the productivity of the assets that poor farm households do have
22 Percent of farms Variation in farmers efficiency of fertilizer use on maize, Agroecological Zone IIa, Zambia Marginal product (kgs maize / kg nitrogen) Note: Zone IIa is a relatively high-potential zone suitable for intensive maize production


23 II. Why there is no alternative to a smallholder-led agricultural development strategy


24 Why there is no alternative to a smallholder-led agricultural development strategy 50-70% of the population is engaged primarily in agriculture Agricultural growth with poverty reduction requires that smallholders be the engine Large-farm-led model latifundia Multiplier effects of agricultural growth are highest in smallholder agriculture Broad-based agricultural growth leads to virtuous symbiotic rural-urban development

25 III. Evidence on returns to alternative investments and policies to achieve broad based growth

26 Ranking of Alternative Investments: Meta-Study Evidence from Asia and Africa The Economist IFPRI study Policies Road investment Agricultural R&D Agricultural extension services Credit subsidies Fertilizer subsidies Irrigation
27 Ranking with respect to agricultural growth: Evidence from Asia The Economist IFPRI Policies 1 Road investment 2 1 Agricultural R&D 3 2 Agricultural extension services 4 Credit subsidies 7 3 Fertilizer subsidies 5 4 Irrigation 6 5
28 Ranking with respect to poverty reduction: Evidence from Asia The Economist IFPRI Policies 1 Road investment 2 1 Agricultural R&D 3 2 Agricultural extension services 5 Credit subsidies 7 3 Fertilizer subsidies 4 4 Irrigation 6 5

29 IV. Priority Strategies for CAADP Country Investment Plans
30 Three basic pathways 1. Strategies that can greatly raise farm productivity and that are appropriate for 1 hectare farm conditions 2. Strategies that can shift composition of farm activities from low-value / low-return activities to high-return activities 3. Strategies that expand the rural poor s access to productive assets
31 Priority Strategies for CAADP CIPs 1. Strategies to improve the enabling environment (e.g. working within government ministries to improve quality of policy and public investments) Rules-based operations of governments in markets, not unpredictable interventions
32
33 Priority Strategies for CAADP CIPs 1. Strategies to improve the enabling environment (e.g. working within government ministries to improve quality of policy and public investments) Promoting regional trade with stable policies would help both farmers and consumers
34 Priority Strategies for CAADP CIPs 2. Improve allocation of public resources in ways that encourage broad-based economic growth Improved seed generation systems expand support to the NARs Improved agronomic and farm management practices expand support for viable farm extension systems Road, port infrastructure, feeder roads Basic education
35 Priority Strategies for CAADP CIPs 3. Training programs that reach poor and women farmers Functional literacy (not an agricultural program but an important adjunct to help agricultural programs effectively reach women) Crop / animal husbandry to improve productivity and incomes for women farmers marketing skills Marketing training

36 MK per kg Farm-gate maize prices compared to retail prices, Mulanje District, Malawi, Luchenza retail 2009: : : :09
37 Priority Strategies for CAADP CIPs 4. Programs that address the increasingly severe land access problems facing smallholder agriculture a. Programs to develop improved farm technologies appropriate for 1 hectare farms b. Programs that support small farm entry into higher-value crops with high growth opportunities Pay attention to gender barriers c. Open up unutilized land for small farm-based expansion Gokwe example
38 Priority Strategies for CAADP CIPs 5. Invest in locally managed agricultural policy institutes that can: Produce credible and timely research to guide policy discussion Work with local media shape mainstream ideas Serve as both a resource and a watchdog over public policy process Provide long-term support for African university capacity building would help raise the supply of local analysts


39


40 Y = Y * A L A L Cost of production = cost of all inputs/unit land bags produced /unit land


41 hectares Most smallholder farms lack the land and other resources to produce a surplus
42 Table 1. Land-to-person ratio (10 year average) in selected countries landperson ratio as % of Ethiopia % Zambia % Kenya % Uganda % Malawi % Zimbabwe % Rwanda % Mozambique % Ghana % Nigeria % Source: FAO STAT (2010)
43 Log(Per Capita Income) 6.2 ETHIOPIA 9.8 KENYA 4.4 RWANDA Ha Ha Ha 4.0 MOZAMBIQUE 3.8 ZAMBIA Ha Ha Per Capita Land Access (Ha) Note: The vertical lines are drawn at 25th, 50th, and 75th percentiles of per capita land owned for each country. The top 5 percent of observations are excluded from the graphs because lines are sensitive to a few extreme cases.
44 Competing models of the role of state and private sector in food markets: Model 1 Model 2 Model 3 Rely on markets; state role limited to: Public goods investment Regulatory framework Strengthening of institutions / property rights Primary reliance on markets - but role for rules-based state operations e.g., buffer stock release to defend stated ceiling price Marketing board purchases at stated price announced in advance Transparent rules for initiating state imports Role for markets and discretionary state intervention Trade policies and marketing board activities change unpredictably Justification for unconstrained role for state interventions to correct for market failures