EXECUTIVE SUMMARY. 1. Specific features of the district:
|
|
|
- Joshua Andrews
- 5 years ago
- Views:
Transcription
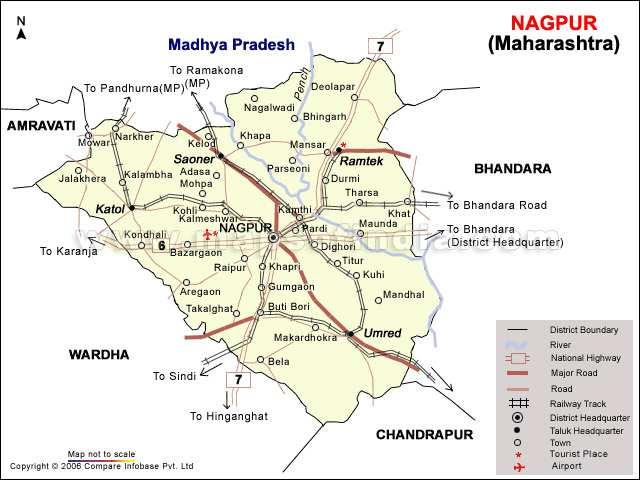
1 1. Specific features of the district: EXECUTIVE SUMMARY The district has a unique identification because of its geographical location at the centre of the country and is well connected to all metropolis and big cities by road, rail and air. Nagpur City is the winter capital of the State and has contributed to a great extent in the socio- economic development of the State. Agriculture and allied activities, cotton ginning and spinning mills, chemicals and cast iron manufacturing units represent the special features of the district. Mandarin orange, a major horticulture crop which contributes to exports is largely grown in the district. Three thermal power stations at Koradi, Khaparkheda and Mauda generate thermal power and supply to the entire State. Coal and manganese ore mines are also situated in the district. Nagpur is a divisional head quarter and gate way to entire Vidarbha Region. The implementation of Multi Modal International Passenger and Cargo Hub (MIHAN) at Nagpur is in progress and its completion will boost the development of the district. The completion of this SEZ project will create various avenues for income generation and employment opportunities in the district. 2. Overall estimated potential of the district: The overall credit potential assessed for the district for the year is ` crore as against the potential estimated of ` crore for the year This has been assessed based on the infrastructure changes, availability and gaps in infrastructure and support services in the district. The achievement by all the banks in service area credit plan, various government supported programmes has also been taken in view while assessing the credit potential. Considering the focus of the Government in augmenting the credit flow to agriculture by banks, it is expected that the credit potential amounting to Rs crore will be exploited during the year Highlights of the development: The cultivation of oranges with the Israeli Method may be practised for more productivity and better management. The production of vegetables and floriculture in shade net and poly house with adequate credit from banks to the small and marginal will set the pace of development in the sector. The low off take of credit in land development, fisheries, forestry and renewable sources of energy/activities may be cause of concern. These sectors need to be focused for balanced sectoral growth in the district. There is a gap in demand supply position of milk in the district and keeping in view the promotional measures taken by the State Govt. and GoI, the dairy sector may flourish in the district with bank's credit support. 4. Policy initiatives and Govt. sponsored programmes: The Government of India, Reserve Bank of India, State Governments and NABARD have been taking a number of policy measures for the development of agriculture and rural sectors and accelerating credit flow. The important measures/initiatives/ innovations taken are given in Chapter 1 on Policy Initiatives. The Union Government has introduced a number of schemes aimed at poverty alleviation and generation of gainful employment. In 7
2 addition to the national level programmes, there are state level programmes designed to support and supplement the poverty alleviation efforts. Details of various Government sponsored programmes are given in chapter 2 on Government sponsored programmes involving bank credit. 5. The Highlights of PLP Total estimated credit potential for the district during the year is crore which is about 30 % more than the estimated credit potential for the year The crop loan constitutes 57 % of the total potential assessed for the year The potential under agriculture term loan has been assessed at ` Crore The Micro, Small and Medium Enterprises (MSME) has a potential to create employment and absorb the labour. The PLP envisages credit flow of ` crore under the sector. The potential under other priority sector has been assessed at ` crore which constitutes % of total credit potential assessed
 2 Term Investment for Agriculture and Allied Activities 3 166062.75 57.43 55799.53 19.")
3 THE BROAD SECTOR-WISE PROJECTIONS FOR WITH PIE DIAGRAM (` ` lakh) Sr. No. Particulars Financial projections % share of total projections 1 Short Term Credit (Crop Loan) 2 Term Investment for Agriculture and Allied Activities Total Investment under Agriculture and Allied Activities (1+2) MSME (including Food and Agro Processing) 5 Other Priority Sector Total Priority sector (3+4+5)
4 SUMMARY OF SECTOR/SUB-SECTOR WISE PLP PROJECTIONS FOR THE YEAR (` lakh) Sr. No. Description PLP Projections 1 Short Term Credit (Crop Loan) Agriculture Term Loan 2 Water Resources Land Development Farm Mechanisation Plantation and Horticulture Animal Husbandry - Dairy Development Animal Husbandry - Poultry Development Animal Husbandry - Sheep,Goat and Piggery development Fisheries Development Forestry and Waste Land Development Storage Godowns and Market Yards Other Activities Total Agriculture Term Loan ( 2 to 14) Total Agriculture Credit ( Crop Loan + Term Loan ) MSME ( including Agro & Food Processing) Potential for Export credit Credit potential for Education Credit Potential for Housing Credit Potential for renewable energy Credit Potential for others Other Priority Sector Total
5 11
6 District Profile District: Nagpur State: Maharashtra Division: Nagpur 1. PHYSICAL & ADMINISTRATIVE FEATURES 2. SOIL & CLIMATE Total Geographical Area (Sq.km) 9892 No. of Sub Divisions 5 No. of Blocks 13 Climate Tropical Dry Sub-humid Climate No. of Villages (Inhabited) 1869 No. of Gram Panchayats 776 Soil Type Semi arid to dry sub humid 3. LAND UTILISATION [Ha] 4. RAINFALL & GROUND WATER Total Area Reported Normal Actual Forest Land Rainfall [in mm] Area Not Available for Cultivation Variation from Normal Permanent Pasture and Grazing Land Net annual recharge Net annual draft Balance Availability of Ground Water [Ham] Land under Miscellaneous Tree Crops Cultivable Wasteland DISTRIBUTION OF LAND HOLDING Current Fallow Holding Area Classification of Holding Other Fallow Nos. % to Total Ha. % to Total Net Sown Area <= 1 Ha Total or Gross Cropped Area >1 to <=2 Ha Area Cultivated More than Once >2 Ha Cropping Inensity [GCA/NSA] 127 Total WORKERS PROFILE [in '000] 7. DEMOGRAPHIC PROFILE [in '000] Cultivators 225 Category Total Male Female Rural Urban Of the above, Small/Marginal Farmers 119 Population Agricultural Labourers 369 Scheduled Caste Workers engaged in Household Industries 63 Scheduled Tribe Workers engaged in Allied Agro-activities 23 Literate Other workers 383 BPL Families HOUSEHOLDS [in '000] 9. HOUSEHOLD AMENITIES [Nos. in '000 Households] Total Households 1041 Having brick/stone/concrete houses - Having electricity supply - Rural Households 339 Having source of drinking water - Having independent toilets - BPL Households 251 Having access to banking services - Having radio/tv sets VILLAGE-LEVEL INFRASTRUCTURE [Nos] 11. INFRASTRUCTURE RELATING TO HEALTH & SANITATION [Nos] Villages Electrified 1869 Anganwadis - Dispensaries 162 Villages having Agriculture Power Supply 1869 Primary Health Centres 49 Hospitals 37 Villages having Post Offices 270 Primary Health Sub-Centres 314 Hospital Beds 3084 Villages having Banking Facilities INFRASTRUCTURE & SUPPORT SERVICES FOR AGRICULTURE Villages having Primary Schools - Fertiliser/Seed/Pesticide Outlets [Nos] 1266 Agriculture Pumpsets[Nos] Villages having Primary Health Centres - Total N/P/K Consumption [MT] Pumpsets Energised [Nos] Certified Seeds Supplied [MT] - Agro Service Centres [Nos] - Villages connected with Paved Approach Roads 739 Pesticides Consumed [MT] - Soil Testing Centres [Nos] IRRIGATION COVERAGE [Ha] Agriculture Tractors [Nos] 7500 Plantation nurseries [Nos] 74 Total Area Available for Irrigation (NIA + Fallow) Power Tillers [Nos] - Farmers' Clubs [Nos] 150 Irrigation Potential Created Threshers/Cutters [Nos] - Krishi Vigyan Kendras[Nos] 1 Net Irrigated Area(Total area irrigated at least once) INFRASTRUCTURE FOR STORAGE, TRANSPORT & MARKETING Area irrigated by Canals / Channels Rural/Urban Mandi/Haat [Nos] 128 Wholesale Market [Nos] 10 Area irrigated by Wells Length of Pucca Road [Km] Godown [Nos] 80 Area irrigated by Tanks - Length of Railway Line [Km] 421 Godown Capacity[MT] Area irrigated by Other Sources - Public Transport Vehicle [Nos] Cold Storage [Nos] 13 Irrigation Potential Utilized (Gross Irrigated Area) Goods Transport Vehicle [Nos] Cold Store Capacity[MT] AGRO-PROCESSING UNITS 16. AREA, PRODUCTION & YIELD OF MAJOR CROPS Type of Processing Activity No of units Cap.[MT] Crop Food (Rice/Flour/Dal/Oil/Tea/Coffee) - - Area (Ha) Prod. (MT) Area (Ha) Prod. (MT) Sugarcane (Gur/Khandsari/Sugar) 1 - Paddy Fruit (Pulp/Juice/Fruit drink) 2 - Jowar Spices (Masala Powders/Pastes) 2 - Tuwar Dry-fruit (Cashew/Almond/Raisins) - - Soybean Cotton (Ginnining/Spinning/Weaving) - - Cotton Milk (Chilling/Cooling/Processing) 7 - Wheat Meat (Chicken/Motton/Pork/Dryfish) Animal feed (Cattle/Poultry/Fishmeal) 25 - Gram Agro-climatic Zone Western Plateu and Hill Region Plateu Zone South Production of Cotton(lint), Jute, Mesta & Sanhemp are in Bales(177.8 kg per bale in India) 17. ANIMAL POPULATION AS PER CENSUS 2007 [in '000] 18. INFRASTRUCTURE FOR DEVELOPMENT OF ALLIED ACTIVITIES Category of animal Total Male Female Veterinary Hospitals/Dispensaries [Nos] 6 Animal Markets [Nos] - Cattle - Cross bred Disease Diagnostic Centres [Nos] 1 Milk Collection Centres [Nos] - Cattle - Indigenous Artificial Insemination Centers [Nos] - Fishermen Societies [Nos] 105 Buffaloes Animal Breeding Farms [Nos] - Fish seed farms [Nos] 2 Sheep - Cross bred Animal Husbandry Tng Centres [Nos] - Fish Markets [Nos] - Sheep - Indigenous Dairy Cooperative Societies [Nos] 247 Poultry hatcheries [Nos] - Goat Improved Fodder Farms [Nos] - Slaughter houses [Nos] 20 Pig - Cross bred MILK, FISH, EGG PRODUCTION & THEIR PER CAPITA AVAILABILITY Pig - Indigenous Fish Production [MT] 8200 Per cap avail. [gm/day] - Horse/Donkey/Camel Egg 12 Production [Lakh Nos] Per cap avail. [nos/p.a.] - Poultry - Cross bred Milk Production ['000 MT] 17 Per cap avail. [gm/day] - Poultry - Indigenous Meat Production [MT] 53 Per cap avail. [gm/day] - Sources (if not mentioned against the respective item): Avg. Yield [Kg/Ha] BPL Survey 2002; Item No District Ind Centre/Dir. of Eco. & Stat.; Item No DACNET; Item No AH Census 2007; Item Nos. 18 & 19 - Dir. of Animal Hus./Dir. of Eco. & Stat.
7 Banking Profile District: Nagpur State Maharashtra Lead Bank: Bank of India 1. NETWORK & OUTREACH (As on 31/3/2015) No. of No. of Branches No. of non-formal agencies assoiated Per Branch Outreach Banks/Soc. Total Rural Semi-urban Urban mfis/mfos SHGs/JLGs BCs/BFs Villages Households Commercial Banks Regional Rural Bank District Central Coop. Bank Coop. Agr. & Rural Dev. Bank Primary Agr. Coop. Society Others All Agencies DEPOSITS OUTSTANDING No. of accounts Amount of Deposit [Rs. 31-Mar Mar Mar-15 Growth (%) Share (%) 31-Mar Mar Mar-15 Growth(%) Share(%) Commercial Banks Regional Rural Bank Cooperative Banks Others All Agencies LOANS & ADVANCES OUTSTANDING No. of accounts Amount of Loan [Rs. 31-Mar Mar Mar-15 Growth(%) Share(%) 31-Mar Mar Mar-15 Growth(%) Share(%) Commercial Banks Regional Rural Bank Cooperative Banks Others All Agencies CD-RATIO 5. PERFORMANCE UNDER FINANCIAL INCLUSION (No. of A/cs) CD Ratio During Cumulative 31-Mar Mar Mar-15 Deposit Credit Deposit Credit Commercial Banks Commercial Banks Regional Rural Bank Regional Rural Bank Cooperative Banks Cooperative Banks Others Others All Agencies All Agencies PERFORMANCE TO FULFILL NATIONAL GOALS (As on 31/3/2015) Priority Sector Loans Loans to Agr. Sector Loans to Weaker Sections Loans under DRI Scheme Loans to Women Amount % of Total Amount [Rs. % of Total Amount Amount [Rs. % of Total Amount [Rs. % of Total Loans % of Total Loans Loans Loans [Rs. Loans [Rs. Commercial Banks(including RRB) Cooperative Banks Others All Agencies AGENCY-WISE PERFORMANCE UNDER ANNUAL CREDIT PLANS Target Ach'ment Ach'ment [Rs. Ach'ment [%] Ach'ment [%] Target [Rs. Ach'ment [%] [Rs. [Rs. Commercial Banks (including RRB) Regional Rural Bank Cooperative Banks Others All Agencies Broad Sector 8. SECTOR-WISE PERFORMANCE UNDER ANNUAL CREDIT PLANS Target Ach'ment Ach'ment [Rs. Ach'ment [%] Ach'ment [%] Target [Rs. Ach'ment [%] [Rs. [Rs. Crop Loan Term Loan (Agr) Total Agri. Credit Non-Farm Sector/SSI Other Priority Sector Total Priority Sector Target [Rs. Target [Rs. Demand [Rs. Ach'ment [Rs. Ach'ment [Rs. ' 9. RECOVERY POSITION Recovery [Rs. Demand [Rs. Recovery Recovery [%] Recovery [%] Demand [Rs. [Rs. Commercial Banks Regional Rural Bank Cooperative Banks Others All Agencies Recovery [Rs. Recovery [%] Average Ach[%] in last 3 years Average Ach[%] in last 3 years Average Rec. [%] in last 3 years