END OF SOWING WINDOW REPORT SOUTHERN AFRICA (2017/18 SEASON)
|
|
|
- Hugo Wilcox
- 5 years ago
- Views:
Transcription
1 This End-of-Planting Season Report is a publication by the African Risk Capacity (ARC). This report discusses the performance of the planting window, which stretches from October to January for most of the countries in Southern Africa. s projections of drought affected areas estimated with the Water Requirements Satisfaction Index and the projected number of drought affected people by the end of the season are presented. The modelled results of Africa RiskView are compared with external sources, principally the FEWS NET crop models and the GEOGLAM Crop Monitor. This report provides a basis for validation of projections in countries where customisation has been undertaken and acts as a source of early warning to ARC member countries. INTRODUCTION The main planting window in Southern Africa ended in January in most countries. A review of the performance of the planting window in for the countries where customisation has been fully or partially undertaken reveals that the planting season has been highly varied. This report focuses on the performance of the planting window in Zimbabwe, Madagascar, Malawi, Lesotho and Swaziland countries where full or partial customisation of the model has been undertaken - and makes projections on the modelled number of people likely to be affected by the end of the season, as estimated by Africa RiskView. External data and analyses are used to assess the performance of the planting season in other countries where customisation of has not been undertaken. In general, conditions favourable to undertake planting were met in most of the countries in the region between late October (dekad 30) and November (dekad 33). However, unusually dry conditions in December and January (dekad 34 of 2017 to dekad 2 of 2018) have caused significant moisture deficits in many of the monitored countries in the region (see Annex 1 and Annex 2 for the temporal distribution of rainfall in Zimbabwe and Madagascar respectively). modelling shows that Zimbabwe was the most affected country by the dry conditions with the modelled end-of-season WRSI indicative of poor crop condition or crop failure in the southern parts. estimates that 4.5 million people are likely to be affected by the drought conditions in Zimbabwe at the end of the 2017/18 season, though this could change significantly depending on how rainfall performs between February and the end of the season in May. In Madagascar, due to the significantly below normal rainfall received during the planting window and the erratic nature of the rains, the planting thresholds in were not met throughout most of southern Madagascar. Farmers are therefore unlikely to produce substantive yields in most of southern Madagascar, except Amboasary district where crop conditions are projected to range from mediocre to average. Current Africa RiskView projections indicate that around 1 million people might be affected by drought at the end of the 2017/18 agricultural season in May. modelling, based on the re-customised Malawi project for Pool2, reveals that water requirements for the staple maize crop have not been adequately met in southern Malawi, resulting in mediocre to average crop condition. This is expected to negatively impact crop yields in the southern parts. Africa RiskView estimates that about two million people could be affected by drought conditions in the southern parts of Malawi. The partially customised model for Lesotho, indicates that the rainfall received in the western part of the country was inadequate to sustain crop development and this is likely to result in poor crop conditions or crop failure. Similarly, Africa RiskView reveals that the crop water requirements are unlikely to be adequately met in Swaziland and thus, the condition of crops ranges from poor to average. As a result, it is projected that 300,000 and 400,000 people are likely to be affected by drought in Lesotho and Swaziland, respectively. Modelling of crop conditions in Southern Africa by is consistent with crop monitoring by Geo Global Agricultural Monitoring (GEOGLAM) and Famine Early Warning Systems Network (FEWS NET) which reported good rainfall in the northernhalf of the region, promoting good crop conditions and poor rainfall in the southern half of the region. Poor rainfall in the southern-half of the region was particularly pronounced in December and January and this resulted in crops in southern Zimbabwe almost reaching permanent wilting. The dry conditions were accompanied by above normal temperatures, thereby increasing the rate of evapotranspiration, and subsequent loss of soil moisture which crops rely on for development. The countries border-


2 END OF SOWING WINDOW REPORT SOUTHERN AFRICA (2017/18 SEASON) Fig 1: Cumulative sowing season rainfall compared to the average for the same period, RFE2, Dekad 29 to Dekad 3 (11 October 2017 to 31 January 2018) Fig 2: Sowing season rainfall as a percentage of the average for the same period, RFE2, Dekad 29 to Dekad 3 (11 October 2017 to 31 January 2018) Fig 3: Dekads when successful sowing conditions were met in the different regions of Zimbabwe Fig 4: Total water deficits experienced during the sowing window, Dekad 29 to Dekad 3 (11 October 2017 to 31 January 2018) Fig 5: end-of-sowing window WRSI, Zimbabwe, Dekad 3, January 2018 Fig 6: FEWS NET WRSI for southern Africa, Dekad 3, January 2018
3 ing Zimbabwe, especially southern Zambia, southern Malawi, southern Mozambique and the eastern and southern parts of Madagascar, were also severely affected by the dry conditions and have been identified as areas to be watched closely, as illustrated in the GEOGLAM map (Fig 17). Central South Africa and Lesotho have also been identified as areas under watch. CROP CONDITION BY COUNTRY ZIMBABWE Rainfall Performance Rainfall performance in Zimbabwe in the 2017/18 season has largely been below average, with the northern regions receiving slightly better rainfall than the southern half of the country. Cumulative rainfall received during the sowing window as customised in was lower by 100 mm or more than average and less than 70% of the average in most parts of the country (Fig 1 and Fig 2). Although the country began receiving rains in dekad 29 of 2017, rains sufficient to meet sowing requirements were received starting from dekad 30 in most provinces. Based on the model, most sowing in Zimbabwe occurred between dekad 30 and dekad 33 as shown in Figure 3. However, adequate sowing conditions were not met in some parts of the country (white spots in Fig 3). The cumulative rainfall amounts received during the sowing season were lower than the 16-year average ( ) during the same dekads (details in Annex 1) and temporal distribution of the rainfall was erratic. Most provinces were characterised by very dry conditions in most of December and January. Despite the successful sowing in most of the country between late October and the end of November (dekads 30 to 33), dry conditions from mid-december and most of January have caused unprecedented stress on the staple maize crop. The water stress is more severe in southern Zimbabwe compared to northern Zimbabwe. By the end of the sowing window, most of Zimbabwe faced high to very severe water stress as illustrated in Fig 4. Satisfaction of Water Requirements In terms of the adequacy and timing of rainfall received during the sowing window, reveals that the crop water requirements for maize, measured using the Water Requirements Satisfaction Index (WRSI), have not been satisfied in most of Zimbabwe. The projected end-of-season WRSI values by the end of January 2018 were mediocre in central Zimbabwe and poor (tending to complete failure/permanent wilting) in southern Zimbabwe. The projected end-of-season WRSI is slightly better in northern Zimbabwe, ranging from mediocre to good. The adverse crop conditions modelled in are consistent with modelling of crop conditions in Southern Africa by other organisations undertaking agricultural monitoring with remotely sensed products such as the FEWS NET and GEOGLAM (see Fig 7 and Fig 17). Compared to the 10-year average, end-of-season WRSI in most parts of Zimbabwe is projected at between 70-90% (see Fig 7), thus suggesting that crop water requirements are not adequately met. Projected Population Affected Although it is still early in the season, estimates that 4.5 million people are likely to be affected by the drought conditions in Zimbabwe at the end of the 2017/18 season. This means that if the rains received during the rest of the season were to be normal (average of the rainfall received over the last 16 years ( )), the modelled number of people affected by the current drought conditions would be 4.5 million. Less than average rainfall performance during the remainder of the season will result in greater numbers of people affected by drought than the 4.5 million currently projected (see Fig 8). If the rains were to be better than average between February and May, the number of people could decrease significantly as crop condition recovers in some areas. More accurate population affected projections will only be possible once new rainfall data becomes available. MADAGASCAR Rainfall Performance The agricultural season in Madagascar starts in November, with planting taking place between late November (dekad 33) and early February (dekad 4). Since the beginning of the 2017/18 season, rainfall in southern and western Madagascar has been significantly below the long-term average ( ), with most areas receiving less than 50% of normal rainfall (see Fig. 9). A slightly less pronounced deficit can be observed in the eastern most parts of southern Madagascar, including in Amboasary district, where between 70 and 90% of normal rainfall were received, according to satellite rainfall estimates (ARC2). While slightly above normal rainfall was received in most of southern Madagascar between late November (dekad 33) and mid-december 2017 (dekad 35), significantly drier than normal conditions prevailed between late December and the end of January This dry-spell was particularly pronounced in the western parts of southern Madagascar (see district-level rainfall graphs in annex 2).
 Satisfaction of Water Requirements Due to the significantly below normal rainfall received during the planting window and the erratic nature of")

4 END OF SOWING WINDOW REPORT SOUTHERN AFRICA (2017/18 SEASON) Fig 7: projected end-of-season WRSI compared to benchmark (10-year average), Zimbabwe (as of 31 Jan 2018) Fig 8: In-season population affected projections for Zimbabwe (as of 31 Jan 2018) Satisfaction of Water Requirements Due to the significantly below normal rainfall received during the planting window and the erratic nature of the rains, the planting thresholds determined by the in-country Technical Working Group were not met throughout most of southern Madagascar, with the exception of Amboasary district in the south-east. This means that, according to, planting conditions were not met in most areas, and that even if farmers did indeed plant crops, they are unlikely to produce substantive yields. In Amboasary district, where planting conditions were met, the end-ofseason WRSI projection (which uses normal rainfall to model the satisfaction of crop water requirements at the end of the growing cycle) suggests that the crop conditions are likely to range from mediocre in the southern parts of the district, to average in the central and northern parts; in some localised areas in northern Amboasary, good crop conditions are expected (see Fig. 10). Compared to the 10-year average, which is the benchmark that was selected by the in-country TWG as an indicator of normal conditions, crop conditions are modelled to be above normal in the southern parts of Amboasary, and normal in the north. In all other districts, where the planting criteria were not met, the conditions are well below normal, given that estimates that the season failed (see Fig. 11). Projected Population Affected Although the season in Madagascar is still ongoing, Africa RiskView estimates that the number of people affected by drought at the end of the season will be significantly above the average of all modelled years. This can be attributed to the failed plantings in 7 out of 8 districts in southern Madagascar, which triggered maximum drought impacts in these areas. The population affected estimates for Amboasary district, where planting was successful according to the model, will depend on the performance of the rains between now and the end of the season. Current population projection estimates for the whole of southern Madagascar indicate that around 1 million people might be affected by drought at the end of the 2017/18 agricultural season in May. The projection has increased significantly since the beginning of the season, due to the poor rainfall recorded between late December and January (see Fig. 12). The overall modelled drought impact is comparable to the impact of the 2015/16 drought, and slightly higher than the modelled estimates for 2009/10; however, it is unlikely that the worst modelled drought event on record, 1991/92, will be reached (Fig. 13). SUMMARY CROP CONDITION IN OTHER COUNTRIES MALAWI modelling, based on the re-customised Malawi project for Pool2, which used maize with a cycle length of 90-days reveals that water requirements for the staple maize crop have not been adequately met in southern Malawi, resulting in mediocre to average crop condition (Fig 14). This is expected to negatively impact crop yields in the southern parts. Crop conditions in northern Malawi range from average to good based on the WRSI projections. estimates that about two million people could be affected because of the modelled crop water
 Fig 11: projected end-ofseason WRSI compared to benchmark (10- year average), Madagascar (as of 31 Jan 2018) Fig 12: In-season population affected projections for southern")

5 END OF SOWING WINDOW REPORT SOUTHERN AFRICA (2017/18 SEASON) Fig 9: Cumulative rainfall compared to average ( ), 21 Nov Jan 2018 (ARC2) Fig 10: projected end-ofseason WRSI, Madagascar (as of 31 Jan 2018) Fig 11: projected end-ofseason WRSI compared to benchmark (10- year average), Madagascar (as of 31 Jan 2018) Fig 12: In-season population affected projections for southern Madagascar (as of 31 Jan 2018) Fig 13: Yearly population affected estimates for southern Madagascar, 1983/ /18 (as of 31 Jan 2018) deficits in the southern parts. The evolution of this number is however highly dependent on how rainfall performs in the subsequent months. According to FEWS NET, below-average rainfall has been received across many parts of the country, contributing to moisture deficits and poor vegetation conditions in the central and southern regions. Crop condition in the northern parts of Malawi is good and this is expected to result in favourable production outcomes, if the favourable climatic conditions continue and other factors that influence production are favourable, for the rest of the season. The model, based on Pool2 re-customisation, is thus consistent with the FEWS NET model (Fig 6) and the GEO- GLAM Crop Monitor for Southern Africa (Fig 17) which places southern Malawi under watch. LESOTHO The start of the rainfall season was also delayed in several parts of the country by 10 to more than 40 days and this adversely delayed planting of crops. FEWS NET monitoring reports reveal that rainfall performance in Lesotho has been poor with cumulative rainfall across most of the country estimated to be percent below normal. These moisture deficits are likely to have negative impacts on crop development and crop yields for the 2018 harvest. The model for Lesotho, illustrated in Fig 15, indicates that the rainfall received in the western part of the country was inadequate to sustain crop development and this is likely to result in crop failure or poor crop conditions. The crop conditions in the central and eastern parts of the country, based on the current WRSI projections, can only be described as mediocre to average. The modelled crop conditions in Lesotho suggest that


.")
6 crop yields may be adversely affected, with close to 400,000 people projected to be affected by drought conditions by the end of the season. SWAZILAND A partially customised model for Swaziland reveals that the crop water requirements, as measured by the WRSI, are unlikely to be adequately met. Thus, the condition of crops ranges from poor to average. Most areas of the country however have mediocre crop condition, implying that only 60-80% of the crop water requirements will be met at the end of the season. The estimates that close to 300,000 people will be affected in Swaziland by the drier conditions. GEOGLAM monitoring of crop conditions in Southern Africa during the 2017/18 season reveals that crop condition in Swaziland is favourable (see Fig 17). This however seems to contradict the unfavourable crop conditions modelled by. The boundary effect limitation of the GEOGLAM monitor is apparent as the crop condition in the neighbouring southern Mozambique is considered poor by the same monitor. MOZAMBIQUE Fig 14: end-of-sowing window WRSI, Malawi, Dekad 3, January 2018 In southern and some parts of central Mozambique, there is concern due to below average rainfall and high temperatures which has negatively impacted crop conditions, while in the north, conditions are favourable. There is currently no customised project for Mozambique in, thus making it impossible to compare the secondary information sources with model outputs. OTHER COUNTRIES - ZAMBIA, BOTSWANA, NAMIBIA AND ANGOLA Although no projects have been customised for Zambia, Botswana, Namibia and Angola, secondary sources reveal that poor rainfall and above average temperatures also prevailed in these countries between October and January. Consequently, these countries or parts of them have been placed under watch by GEOGLAM Crop Monitor. In Zambia, there is concern in the central and south due to below average rainfall and high temperatures In Botswana and Namibia, there is concern across all areas due to poor rainfall and high temperatures In Angola, the western coastal areas have received poor rainfall and crop condition is below average in these areas. Fig 15: end-of-sowing window WRSI, Lesotho, Dekad 3, January 2018 PASTURE CONDITION currently doesn t have a dedicated model to assess pasture conditions in Africa. However, the FEWS NET emodis Normalized Difference Vegetation Index (NDVI) indicates that pasture and browse conditions in Southern Africa were very poor by dekad 3 of 2018 compared to the median of the previous years. The worst pasture conditions were observed in Namibia, Botswana, central and western parts of South Africa and southern Zimbabwe (Fig 18). Fig 16: end-of-sowing window WRSI, Swaziland, Dekad 3, January 2018

 projected to experience near total crop failure based on")
7 CONCLUSION Fig 17: Crop condition in Southern Africa by the end of the sowing season, Dekad 3, January 2018 (Source: geoglam Crop Monitor) The epicentre of the poor rainfall performance in Southern Africa during the 2017/18 sowing season is Zimbabwe and parts of the neighbouring countries close to its borders. Rainfall in Zimbabwe has been poorly distributed in 2017/18 sowing season, with unusually dry conditions and high temperatures experienced in December and January. This has resulted in poor crop condition in most of the country with southern Zimbabwe (provinces of Masvingo and Matebeleland South) projected to experience near total crop failure based on modelling. Other areas where poor crop condition has been modelled by southern Malawi, southern Madagascar, Lesotho and Swaziland. The GEOGLAM Crop Monitor also places central and southern Zambia, southern Mozambique, Botswana and Namibia on alert. Modelling of drought affected areas and crop condition in Zimbabwe, Malawi, Lesotho and Swaziland, where has either been fully or partially customised is generally consistent with crop models by FEWS NET and the GEOGLAM Crop Monitor. Based on the projections, it is likely that large areas of the SADC region may face significant water deficits and this may negatively impact on crop yields. Fig 18: NDVI as a percentage of the median of the previous years (Jan )

8 ANNEX 1: SPATIAL DISTRIBUTION OF RAINFALL BY PROVINCE IN ZIMBABWE, DEKAD TO DEKAD , RFE2

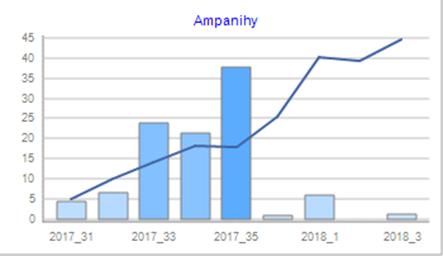
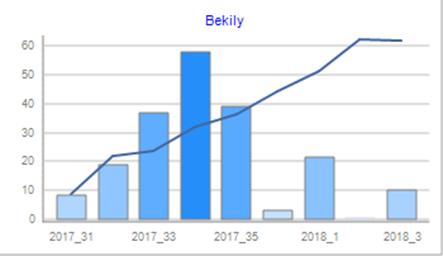
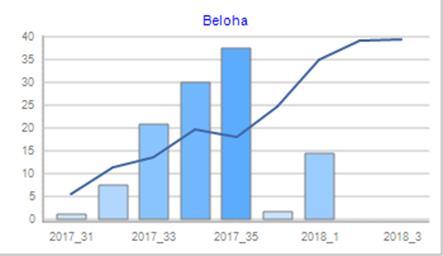
9 ANNEX 2: SPATIAL DISTRIBUTION OF RAINFALL BY DISTRICT IN MADAGASCAR, NOV 2017-JAN 2018, ARC2


10 About ARC: The African Risk Capacity (ARC) is a specialised agency of the African Union designed to improve the capacity of AU Member States to manage natural disaster risk, adapt to climate change and protect food insecure populations. The software is the technical engine of ARC. It uses satellite-based rainfall information to estimate the costs of responding to a drought, which triggers a corresponding insurance payout. The ARC Insurance Company Limited is the financial affiliate of the ARC Agency, which pools risk across the continent through issuing insurance policies to participating countries. Note on s Methodology: Rainfall: uses various satellite rainfall datasets to track the progression of rainy seasons in Africa. Countries intending to participate in the ARC Risk Pool are required to customise the rainfall component by selecting the dataset which corresponds the best to the actual rainfall measured on the ground. Drought: uses the Water Requirements Satisfaction Index (WRSI) as an indicator for drought. The WRSI is an index developed by the Food and Agriculture Organisation of the United Nations (FAO), which, based on satellite rainfall estimates, calculates whether a particular crop is getting the amount of water it needs at different stages of its development. To maximise the accuracy of, countries intending to take out insurance customise the software s parameters to reflect the realities on the ground. Affected Populations: Based on the WRSI calculations, Africa RiskView estimates the number of people potentially affected by drought for each country participating in the insurance pool. As part of the in-country customisation process, vulnerability profiles are developed at the sub-national level for each country, which define the potential impact of a drought on the population living in a specific area. Response Costs: In a fourth and final step, converts the numbers of affected people into response costs. For countries participating in the insurance pool these national response costs are the underlying basis of the insurance policies. Payouts will be triggered from the ARC Insurance Company Limited to countries where the estimated response cost at the end of the season exceeds a pre-defined threshold specified in the insurance contracts. Disclaimer: The data and information contained in this report have been developed for the purposes of, and using the methodology of, Afri ca RiskView and the African Risk Capacity Group. The data in this report is provided to the public for information purposes only, and neither the ARC Agency, its affiliates nor each of their respective officers, directors, employees and agents make any representation or warranty regarding the fitness of the data and information for any particular purpose. In no event shall the ARC Agency, its affiliates nor each of their respective officers, directors, employees and agents be held liable with respect to any subject matter presented here. Payouts under insurance policies issued by ARC Insurance Company Limited are calculated using a stand-alone version of, the results of which can differ from those presented here.