Relevance to a marketing program and how do they fit in?
|
|
|
- Juniper Reeves
- 5 years ago
- Views:
Transcription


1 NZX Agri Australia
2 Electronic Trading Platforms Relevance to a marketing program and how do they fit in?
3 Big Picture The Asian century Australia the foodbowl for Asia Fierce competition from competing nations It won t just happen..
4 Big Picture The game will be about EFFICIENCY Most efficient supply chain wins Lowest cost of accumulation Will the way we have accumulated grain for the last 30 years serve us best today and tomorrow? Will it deliver the most efficient supply chain?
5 Grower behavior is changing Are growers/suppliers evolving their selling patterns or will the traditional way of accumulation remain the most efficient supply chain? Consider..


6 What devices do growers use to access the internet? 39.2% 63.5% Smart phone Desktop Computer 42.2% Laptop Tablet 71.1% Source: Profarmer grower survey 2013
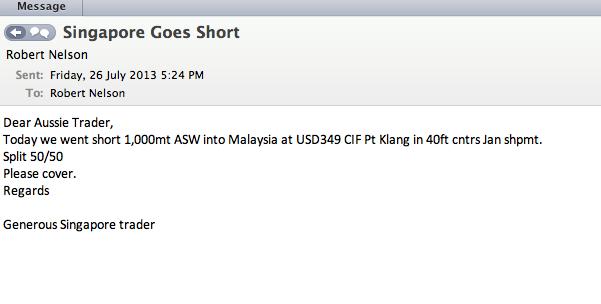
7 how do they fit in? A day in the life of an Aussie Grain Trader Fast Decisions Minimum fuss

8


9 Morning Market Report 25th July 2013 Comment: Prices continued to slide across the board overnight with soybean falls generally the catalyst for dragging markets lower. Wheat was slightly less impacted than other commodities however concerns continue to mount over the size of Russia s wheat crop. A surge in the number of tenders this week could see some support for wheat prices with Egypt already paying $5 over last week s prices. Domestically the price slide will be masked a slightly lower $AUD, now at US$ Dec13 CBOT wheat up A$2.99/t. Nov ICE Canola down A$5.69. CBOT Wheat Sept futures down 0.50 USc/bu at USc/bu. Dec 13 down 1.50 USc/bu at USc/bu, settling 8.75 USc/bu from the high and 0.50 USc/bu from the low overnight. Egypt has purchased 240,000t of Russian, Romanian and Ukrainian (Black Sea origin) wheat at prices between $264- $266/t CNF. Algeria s state grain agency has purchased 400,000t of optional milling wheat for US$273-US274/t CNF. Russia s National Grain Producers union has put forward their estimates for the 2013 crop of 45-48Mt. This is 2-5Mt below government estimates. Iraq has issued a tender for 50,000t of US, Canadian or Australian wheat. Cooler weather and the risk of frost in wheat producing regions of Brazil has enhanced the likelihood of importing more US wheat. CBOT Soybeans Aug futures down USc/bu at USc/bu. Nov 13 down 3.50 USc/bu at USc/bu, settled USc/bu from the high and 3.75 USc/bu from the low overnight. Weather continues to provide favorable growing conditions throughout the US for the soybean crop. Suspicion that Chinese government is continuing to release old crop soybean reserves domestically has plagued soybean futures as it risks reducing current export contracts from the US. ICE Canola / Matif Rapeseed ICE Nov13 down C$10.80/t to C$502.20/t, settled $15.60/t from the high and $0.30/t from the overnight low. August Matif down 2.00 at and Nov13 at , down REAL PRICES CBOT Corn REAL TIME REALLY FAST Sept futures down USc/bu at USc/bu. Dec 13 Overnight Trading

10
11 May -11 Jul-11 Oct-11 Dec-11 Mar-12 May -12 Jul-12 Oct-12 Dec-12 Feb-13 May -13 Jul-13 Oct-11 Dec-11 Feb-12 Mar-12 Apr-12 Jun-12 Jun-12 Aug-12 Oct-12 Nov-12 Jan-13 Feb-13 Mar-13 May -13 Jun-13 Oct-11 Dec-11 Feb-12 Mar-12 Apr-12 Jun-12 Jun-12 Aug-12 Oct-12 Nov-12 Jan-13 Feb-13 Mar-13 May -13 Jun-13 11th July, 2013 Forecast Grain Demand: Poultry: 2% Pigs: 11% Feedlots: 4% Dairy: 2% Supply/Stocks/Quality East coast supplies have a buoyant outlook for new crop with rainfalls continuing to fall above long term averages for most regions of VIC/SA/NSW. An exception being the Walgett region where a lack of plantings has eventuated due to dry soil conditions. This is area is of considerable importance as it supplies are high proportion of the regions feed grain which could prove problematic for next year given tight feed grain carry-out stocks are expected. Our long range yield estimates at this stage of the year are as follows for 2013/14 new crop: Wheat (incl Durum) +12% 23.4mt, Barley +15% 7.8mt, Canola 26% 2.75mt. The sorghum harvest is now expected to continue deep into August and even September. This later the usual growing season is expected to have some impact on traditional winter crop acreage. This has been reflected in our current crop forecasts. Our current season sorghum production forecast stands at 1.65Mt. The intense export program this season along with the record prices has encouraged us to reduce our expected carry next season to 143kt. The significant downturn from 2012/13 in canola sowing is expected to be watched with some interest from domestic consumers who, for the first full season will be competing with Chinese bidders to secure their portion of the crop. WA crop production prospects for 2013/14 are of growing concern for many in the west after failing to see rainfall of any significance since their impressive summer deluge. From last month we have reduced our WA wheat production figure by 6% (Ha s -2%, yield -4%). A recovery to average production has not passed the state at this point however the coming month will be pivotal to that eventuating. Domestic Use Feed grain delivered into the Darling Downs prices are now quite literally off the charts as illustrated in the top chart to the right. The tightness in feed grain markets throughout QLD has been exacerbated by two primary functions, 1) the lack of available/harvested sorghum in the area 2) the unseasonally high cattle turnoff rates that are persisting in the state due to the dry summer. Further south, the price spread differential between delivered Darling Downs and the Goulburn Valley have eased slightly after hitting two year highs last month. The dairy drying off period in the Goulburn Valley has seen prices ease in the $320 $300 $280 $260 $240 $220 $200 $180 $160 $300 $280 $260 $240 $220 $200 $180 $160 $60 $50 $40 $30 $20 $10 $0 -$10 2,000 Delivered Darling Downs Delivered Goulburn Valley ASW F1 East Coast wheat usage 2012/13 ASW F1 SOR 1 Darling Downs Vs Goulburn Valley spread (Wht) 2,500 Exports Feed Milling Surplus 16,000 14,000 12,000
12
13
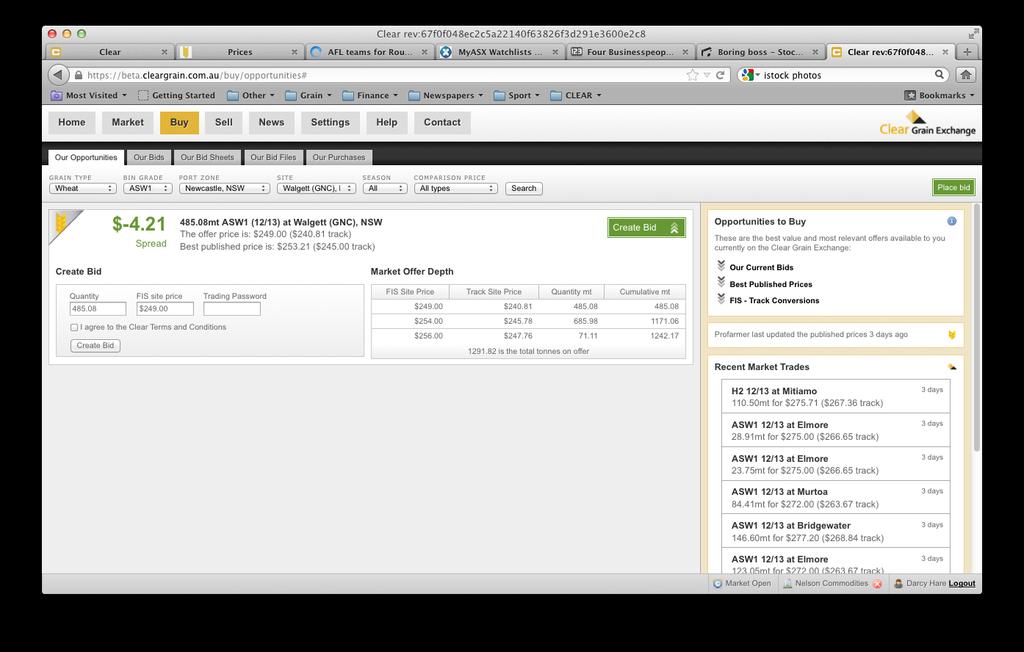
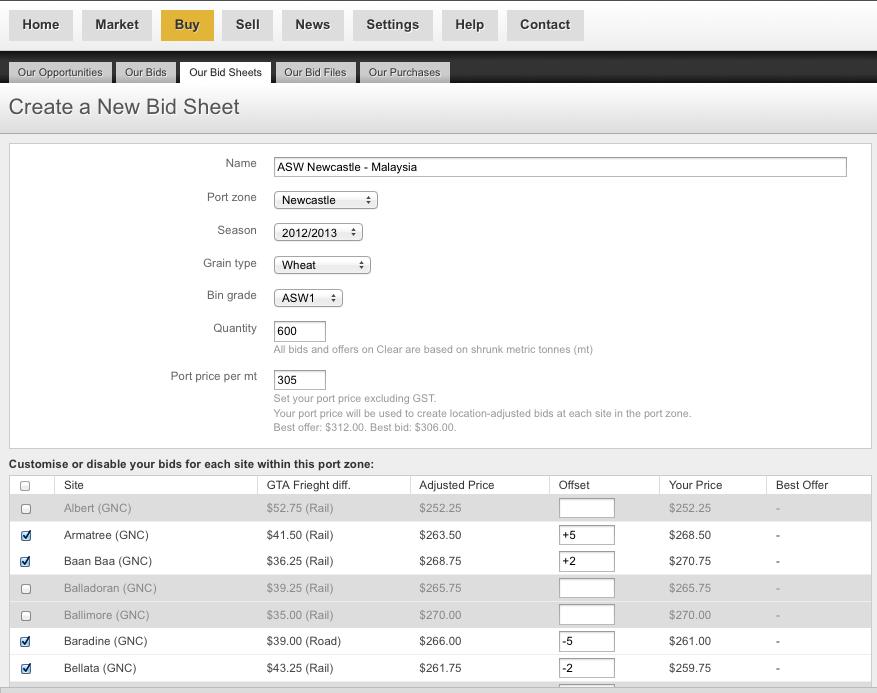
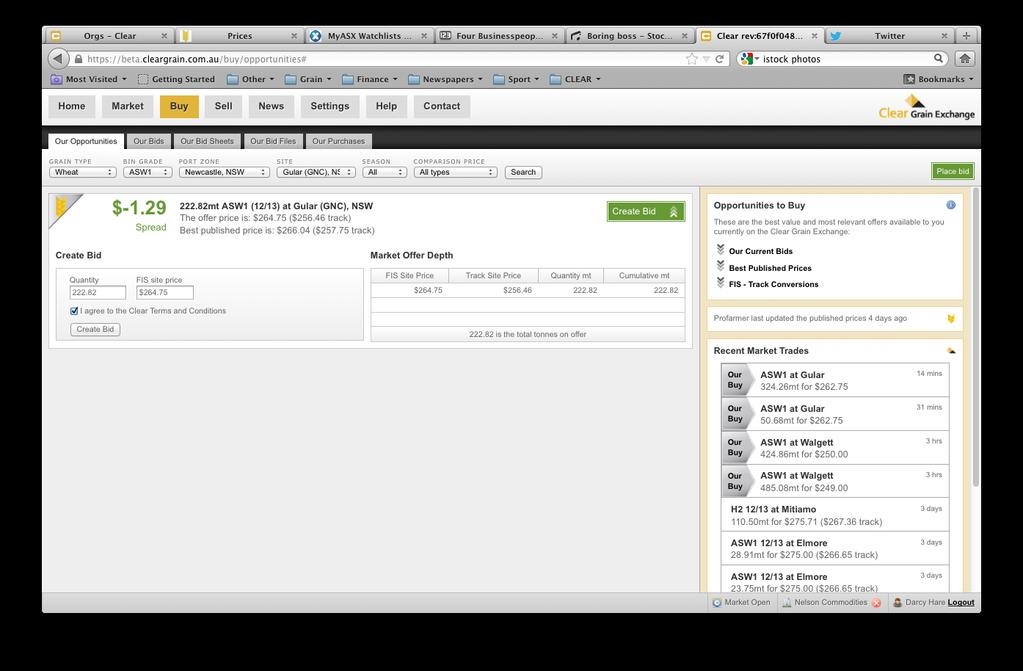
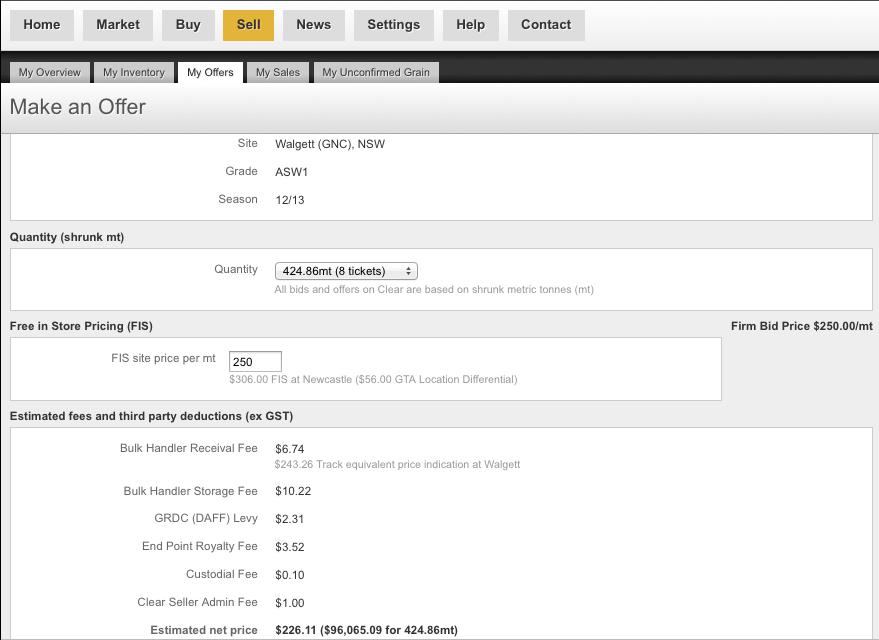
14 Clear functionality

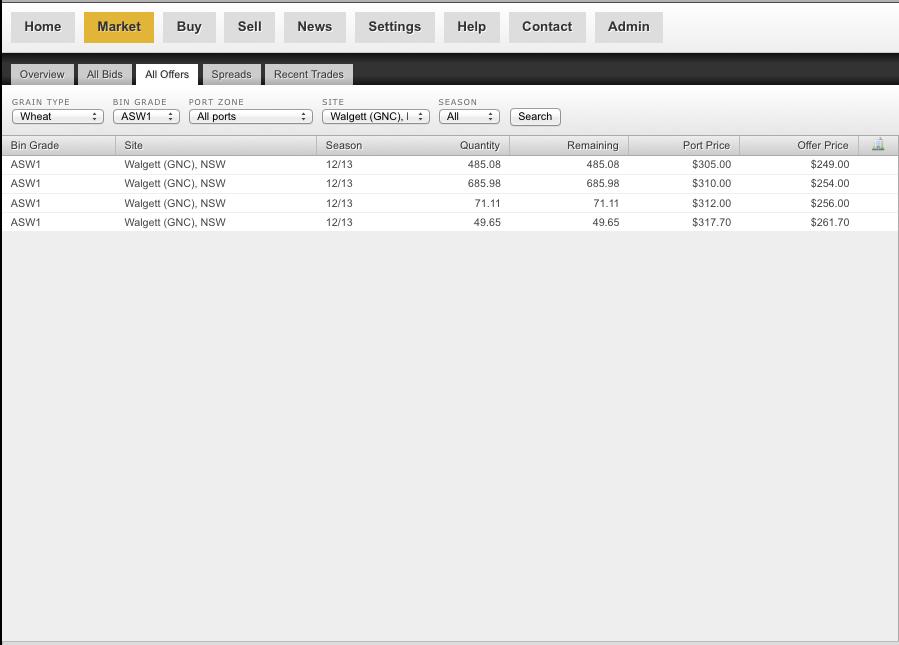
15 Walgett Packing
16 Clear functionality
17

18
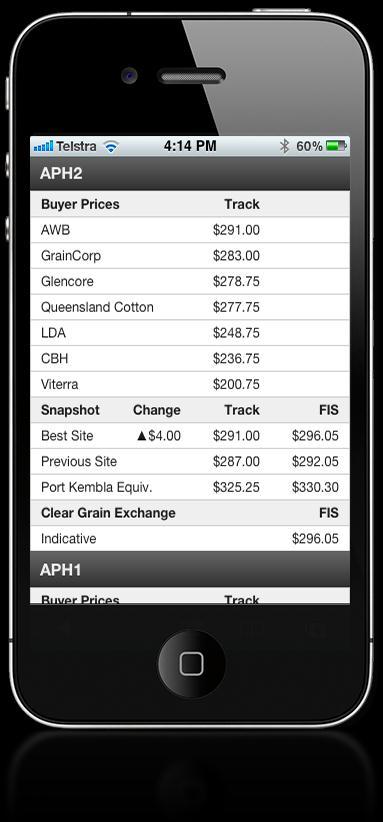
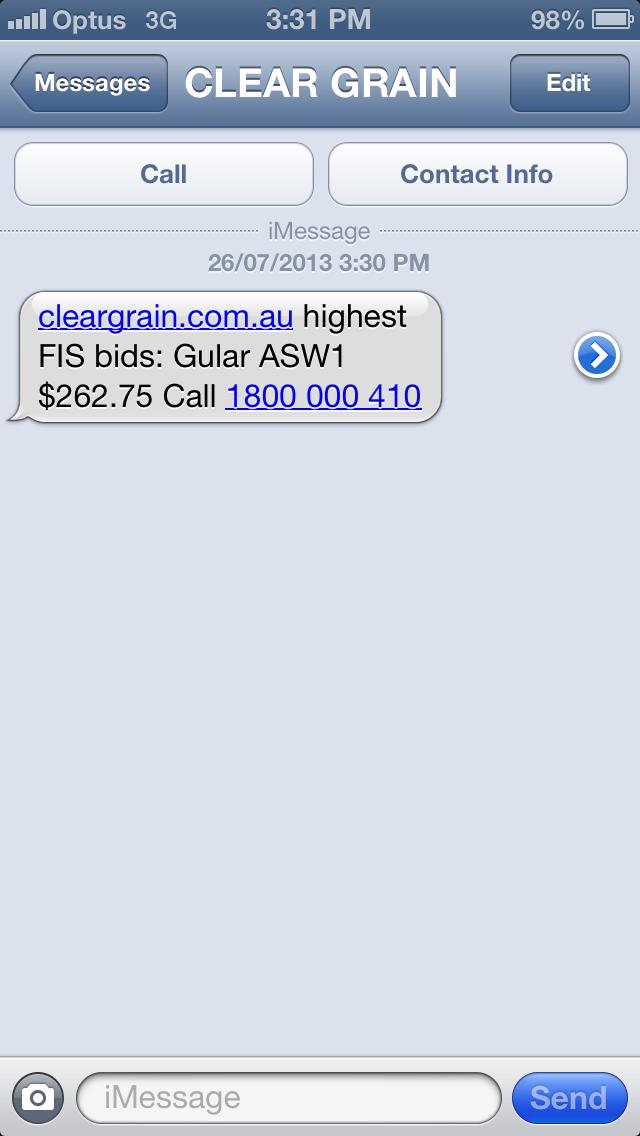
19 Clear functionality App
20 Clear functionality
21 Clear functionality
22 Clear functionality


23
24 Clear functionality
25 Clear functionality
26 Clear functionality
27 Clear functionality Admin GRDC paid automatically EPR paid automatically Storage paid automatically Title transfer transferred automatically Position (to be) updated automatically


28
29 $1
30 Conclusion Electronic trading platforms continue to evolve around the world and grow in relevance as a daily part of the grain supply chain

31
32