2018 ISU Land Value Survey
|
|
|
- Derek Ball
- 5 years ago
- Views:
Transcription
1 2018 ISU Land Value Survey Dr. Wendong Zhang Assistant Professor of Economics and Extension Economist ISU Alumni Center, Ames, Iowa December 12, 2018
2 A Quick Introduction: Dr. Wendong Zhang Grown up in a rural county in Shandong Province, China Attended college in Shanghai and Hong Kong Ph.D. in Ag Econ in 2015 from Ohio State 2012 summer intern at USDA-ERS on farm economy and farmland values Research and extension interests: land value/ownership agriculture and the environment ISU China Ag Center (+ CAAS)


3 My Hometown: Shenxian, Shandong Province
4 ISU Land Value Survey How to Interpret It is an opinion survey It is an expert opinion survey: respondents - ag professionals The first of its sort in the nation started 1941 The only survey that offers county-level land value estimates since 1950 It is not designed to value individual parcels The percent change is more important than the actual dollar amount, and when comparing across surveys, compare their percent change To value individual parcels consult appraisers or comparable sales
5 Number of Respondents and Responses by District and Mode, 2018 Responses Respondents Paper Online Total Paper Online Total PERCENT Number PERCENT Number Northwest North Central Northeast West Central Central East Central Southwest South Central Southeast STATE 35% 65%
6 Survey Respondents by Occupation, 2018 Farm manager Appraiser Ag lender Broker/Realtor PERCENT Farmer /Landowner Government Other Northwest North Central Northeast West Central Central East Central Southwest South Central Southeast STATE
7 Experience and Service Area by Occupation Crop reporting district Years of experience Number of counties served Occupation Years of experience Number of Counties Served Northwest 27 6 Farm manager 23 9 North Central 29 7 Appraiser Northeast 21 7 Ag lender 22 4 West Central Brokers/Realtor Central Farmer/Landowner 42 5 East Central 24 6 Government 21 2 Southwest 26 5 Other 26 4 South Central Southeast 25 8 STATE 25 9 STATE 25 9
8 STATEWIDE AVERAGE $7,264 Nov 2018 down 0.8% down $62

9 HIGH QUALITY LAND $8,863 Nov 2018 down 0.7% down $70
10 MEDIUM QUALITY LAND $6,805 Nov 2018 down 0.7% down $44
11 LOW QUALITY LAND $4,609 Nov 2018 down 1.7% down $80
12 AVERAGE VALUES all farmland Nominal and Real Land Values ($/acre) $10,000 $9,000 $8,000 $7,000 $6,000 $5,000 $4,000 $3,000 $2,000 $1,000 $- Nominal Iowa land values Inflation-adjusted Iowa land values (2015 Dollars)
13 % Change in Nominal Iowa Farmland Values % 30.% Annual Percentage Change (%) 20.% 10.% 0.% -10.% -20.% -30.% -40.%
14 Percent of Respondents Major Negative Factors Affecting Iowa Farmland Market, Negative Factors, 2018 (Percent) 0 Long Term Interest Rates Commodity Prices (Lower) Cash/Credit Availability Weather Uncertain Ag Future Tariffs


15 Lower farm income and higher interest rates put downward pressures on land values


16 Soybean Export Market Share (2016 vs. 2018)


17
18 Major Positive Factors Affecting Iowa Farmland Market, 2018 Percent of Respondents Favorable Interest Rates Strong Yields Positive Factors, 2018 (Percent) Limited Land Supply Cash/Credit Availability Strong Demand (Many Buyers) Investor Demand
19 Limited land supply still a key factor holding up land values Percent Change in Land Value 40.0% 30.0% 20.0% 10.0% 0.0% -10.0% Farmland Sale Activity Index -20.0% Percent_Change Index Benchmark 0

20 82% of Iowa land is debt-free 60% of land owned by owners 65+ years old, onethird of land owned by 75+ years old, 13% of land owned by women landowner 80+ years old Ownership continues to shift from sole ownership to trusts and corporations 53% of Iowa land rented out mainly cash rent 34% of Iowa land owned by landlords with no farming experience, 23% of land owned by retired farmers who do not currently farm 29% of Iowa land owned primarily for family/sentimental reasons ($5 each print copy!)


21 ISU Survey Results Echo Other Surveys


22 USDA NASS June Area Survey June 2017 to June 2018 IA Ag Real Estate Values: + 1.0% IA Cropland Values: No change IA Pasture Values: No Change USDA June Area Survey, August 2018
23 ISU Survey Results Echo Other Surveys Federal Reserve Bank of Chicago November 2018 Ag Letter


24 Indiana and Illinois both show recent declines Purdue University Illinois Chapter of American Society of Farm Managers and Rural Appraisers
25 Land Values by District and Quality, Nov 2018 District Average Value % Change High Quality % Change Medium Quality % Change Low Quality % Change Northwest $9, % $10, % $8, % $6, % North Central $7, % $8, % $7, % $5, % Northeast $7, % $9, % $7, % $5, % West Central $7, % $8, % $6, % $4, % Central $7, % $9, % $7, % $4, % East Central $8, % $9, % $7, % $4, % Southwest $6, % $7, % $5, % $3, % South Central $4, % $6, % $4, % $2, % Southeast $6, % $9, % $6, % $3, % Iowa Avg. $7, % $8, % $6, % $4, %
26 Local Land Supply and Demand Explain Variations in Land Market Land Value = localized net income / universal interest rate
27 Livestock and Crop Inventory by Crop Reporting District Livestock Inventory Acres 2012 Harvested Acres 2017 District Chickens, Layers Hogs Milk Cows Cattle Pasture Timber Corn Soybean Northwest 30% 26% 29% 22% 7% 2% 15% 16% North Central 64% 16% 4% 6% 4% 4% 14% 13% Northeast 1% 12% 51% 16% 11% 23% 12% 8% West Central 0% 13% 1% 13% 10% 7% 15% 16% Central 3% 13% 1% 7% 8% 8% 15% 14% East Central 1% 5% 10% 11% 11% 14% 11% 10% Southwest 0% 2% 0% 9% 12% 5% 8% 10% South Central 0% 2% 1% 9% 25% 19% 4% 6% Southeast 1% 11% 3% 6% 12% 19% 7% 8% Iowa Total 52.2 million 20.4 million 0.17 million 3.8 million 2.5 million 1.2 million 12.9 million 10.0 million Federal Reserve Bank of Chicago November 2016 Ag Letter


28 Strong crop yields, especially for SC Iowa USDA NASS QuickStats

29 Land Values by County, 2018

30 CSR2 Corn Suitability Rating Source: ISU Agronomy

31 Percent Changes in Land Values from Nov 2017

32 Iowa Farmland Purchases by Buyer Types Percent of Land Existing Farmers Investors New Farmers Other
33 Iowa Farmland Purchases by Seller Types, 2018 Active Farmers Retired Farmers Estate Sales Investors Other PERCENT Northwest North Central Northeast West Central Central East Central Southwest South Central Southeast STATE
34 US Farm Income Source: USDA OCE 2018 Long-term Ag Outlook to 2027
35 One and Five Year Cash Crop Price Predictions Cash Corn Prices Cash Soybean Prices A Year Later Five Years Later A Year Later Five Years Later Northwest $3.44 $4.00 $8.36 $9.55 North Central $3.49 $4.11 $8.58 $9.94 Northeast $3.46 $4.16 $8.57 $9.92 West Central $3.44 $4.00 $8.36 $9.55 Central $3.45 $4.05 $8.55 $9.90 East Central $3.61 $4.11 $8.79 $10.04 Southwest $3.55 $4.05 $8.44 $9.64 South Central $3.64 $4.17 $8.29 $9.65 Southeast $3.47 $4.25 $8.43 $9.79 STATE $3.51 $4.10 $8.50 $9.79
36 Land value predictions one & five years from now Percent of Respondents Decrease 10% or more Decrease 5-10% Decrease <5% No Change Increase <5% Increase 5-10% Increase 10-20% Increase 20% or more

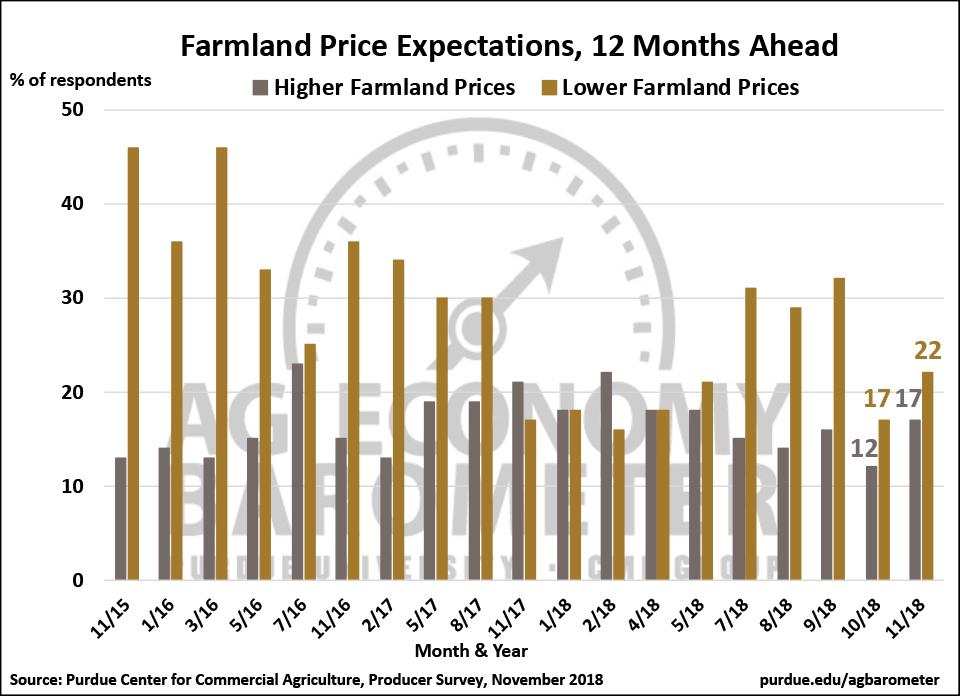
37 Source: Purdue Ag Barometer


38 Iowa Farmland Value Portal #ISUlandvalue


39
40 Thank You! Wendong Zhang Assistant Professor and Extension Economist 478C Heady Hall Iowa State University