ArcGIS Agricultural Land-Use Maps: The Mississippi Cropland Data Layer Fred L. Shore, Ph.D., Thomas L. Gregory, and Rick Mueller
|
|
|
- Geoffrey Underwood
- 5 years ago
- Views:
Transcription
1 ESRI Federal User Conference, 1/31/06-2/02/06, Washington, D.C. ArcGIS Agricultural Land-Use Maps: The Mississippi Cropland Data Layer Fred L. Shore, Ph.D., Thomas L. Gregory, and Rick Mueller Abstract: Since 1999, the Mississippi Department of Agriculture and Commerce, and Mississippi State University have cooperated with the National Agricultural Statistics Service of the USDA to produce the Cropland Data Layer (CDL) for Mississippi. Ortho-rectified CDL products were released in Geotiff format annually using the NASS public domain software programs Peditor and RSP. Single and multiple year results mapped with ArcGIS display the frequency and extent of cropland use for the period. Examination of Mississippi ArcGIS cropland overlays following crop rotation recommendations revealed useful information. Annual and multi-year maps in ArcGIS have been used to identify land suitability for farming important crops and to determine locations of processing plants. Agricultural Departments in nine other states now use the CDL process to make more effective use of the June Agricultural Survey data and produce visual crop coverage maps. I. Introduction Mississippi agricultural land use has been estimated since 1999 using remote sensing with a cooperative agreement between the USDA-National Agricultural Statistics Service (USDA-NASS), the Mississippi Department of Agriculture and Commerce (MDAC), and Mississippi State University (MSU) [1,2,3]. The remote sensing process uses satellite imagery and extensive ground truth data collected at precise locations using the June Agricultural Survey (JAS) of the USDA-NASS. The Mississippi Cropland Data Layer (CDL) results are produced using the USDA-NASS public domain software programs Portable Editor (Peditor) and the Remote Sensing Project (RSP) data manager [4,5,6,7,8]. ESRI ArcGIS software is important for the entire process of generating the Mississippi Cropland Data Layer [3]. The ESRI results are a communication and locational tool used for locating sample segments by the field enumerators throughout the State of Mississippi, it provides the ability to perform crop rotation analysis by tracking crop rotations between years, offers the potential to locate processing plants near the crops of interest and to produce mapping products for our clients. II. Procedures A. The CDL data inputs State stratification and segment selection give a framework for representative data that can be expanded for full-state estimates (Figure 1). The stratification is used for sample allocation, where higher intensity agricultural areas are sampled at a higher rate than non-agriculturally intensive areas. The chosen samples or segments are approximately one square mile in size and are randomly selected using stratified random sampling. JAS ground truth data, farmer reported acreage and agricultural practices in the selected segments. Figure 2 shows a typical land use and road map that enumerators use to navigate to a segment during the JAS. A state roadmap is provided as an inset, and the segment locations are overlaid on a county map cad layer. All land usage within a segment must be accounted for using land use categories defined by the JAS (Figure 3). Where different land ownership and usages are drawn off in separate colors. Satellite images of the State of Mississippi. Landsat 5 and 7 images were used for all years since 1999 with the Indian Remote Sensing (IRS) Advanced Wide Field Sensor (AWiFS) images also used in 2005 (Figure 4). The AWiFS sensor is currently being researched as an alternative sensor to the Landsat platform for acreage estimation and the CDL. The AWiFS satellite characteristics are as follows: it has a scene swath width of 350km, similar spectral bands 2, 3, 4 and 5 to that of the Landsat sensor, 56-meter resolution at nadir, with a 5 day repeat cycle. Images are used in a multi-temporal fashion to allow for better crop identification, with one spring and one mid-summer observation date being the preferred option. This allows for adequate separability between crops and non-agricultural field uses. Knowledge of plant phenology with regard to the image acquisition dates, can assist the analyst determining proper imagery dates to use. B. CDL Products Mississippi Crop Estimates Obtained from the Cropland Data Layer. The CDL estimate is in overall excellent agreement with the official USDA-NASS estimates. The cotton estimate provided the most accurate final NASS Agricultural Statistics Board acreage number with a mean of 1.1 percent over actual and a standard deviation
2 of 4.8. The soybean estimate had a 0.1 percent mean from actual, but a larger standard deviation of 8.0. The rice estimate had the lowest mean accuracy with 6.5 percent from actual and a standard deviation of 8.4. Note that the CDL estimates are provided prior to finalizing the official estimates and are used as an indicator in preparing these estimates. Single Year Land Use Maps. Estimates are useful but the ArcGIS displays create the most interest in the CDL. A single-year map gives the agricultural land use for that year. Figure 5 shows the most recent CDL for Mississippi. The single-year classified maps tell a story, for example, that soybeans cover the largest land area of any Mississippi crop. You can also determine what crops were grown in what parts of a given county or state, and that is supported by the CDL accuracy assessment that is published along with the CDL. The accuracy assessment provides kappa, percent correct, and omission/commission errors over each analysis area. In addition, a map was prepared to show the location of a processing plant for sweet potatoes with regard to the large number of sweet potato fields in the nearby vicinity using the 2004 CDL data. Multiple Year Land Use Maps. By using multiple layers in an ArcGIS map, historic land-use patterns reveal land-use and value. For example, cotton is usually grown in the sandier soil along existing or ancient rivers and creeks as shown in Figure 6. This map was prepared by making all layers transparent except cotton, which was made semi-transparent. Also, a picture was included to add additional interest. The single year land use map tells a similar story for cotton. Maps prepared for rice show the effect of rotation on the rice land use (see Figure 7). The prescribed crop rotation pattern for rice seems to be generally followed with one year of rice followed by 2 years of soybeans to allow the eradication of weeds. Corn is sometimes rotated with cotton to increase cotton yields and the land-use patterns for these crops show similarities (see Figure 8). Rice and soybean land-use maps also reveal similar patterns due to the usual crop rotations (see Figure 9). In comparing the single year land use map with the multiple year successive overlay presentation for the major crops (Figure 10), the land use pattern becomes more evident and can lead to the interesting observation that the more profitable rice and cotton could have almost equal acreage in the future. III. Results The annual Geotiff Cropland Data Layer is useful to determine agricultural land use for a given year and for multiple years. CDL estimates are useful indicators for preparing the official USDA end of season state and county estimates. With ArcGIS, useful CDL map products have been made including: Single year maps showing the agricultural land use of Mississippi by State, county, and by parts of the State. Multiple years of agricultural land use in Mississippi presented as overlay maps give more complete information about land suitability and crop rotations. Maps for locating possible agricultural product processing plants are useful presentation products. The Cropland Data Layer annual product is published on CD-ROM and is available shortly after the county estimates are released in late July of the following year and can be obtained by calling (800) or on-line at The Mississippi Cropland Data Layer products are also available in state and county map downloadable form, produced using Arc GIS, for the period 1999-present at IV. Discussion The use of remote sensing to prepare the Mississippi Cropland Data Layer allows an experimental measurement of crop acreages. Acreage estimates using the Cropland Data Layer trend well over time with the USDA-NASS official estimates and give an additional indicator of known good quality to help in developing accurate crop estimates. ArcGIS map presentations of agricultural land use patterns for one or more years reveal information about land suitability for growing specific crops and crop rotations. Agricultural Departments in nine other states now use the CDL process to make more effective use of the June Agricultural Survey data and to produce visual crop coverage maps.


3 Acknowledgments: Commissioner Lester Spell, Jr., D.V.M., MDAC; Dr. Joseph H. McGilberry, Director, Mississippi Cooperative Extension Service; James Brown, Mississippi Department of Transportation; and the NASS Field Enumerators in Mississippi were critical to the success of this project. Appendix Figure 1. The stratification of land cultivation allows segment selection to give an expansion estimate for crops of the state. Note that more segments are chosen in the more intensely cultivated stratum.


4 Figure 2. A segment locator map used by the USDA-NASS Field Enumerators to find segments in the JAS.


 / Band 3 (red) / and Band 2 (green) as")
5 Figure 3. A segment for the JAS showing field lines and location information Indian Remote Sensing (IRS) RESOURCESAT-1 Advanced Wide Field Sensor (AWiFS) scene A, 9/04/05. Each scene covers 350 km 2 at an average resolution of 56 m (vs. Landsat TM scenes at 185 km 2 and 30 m resolution). Shown as false color IR: Band 5 (SWIR) / Band 3 (red) / and Band 2 (green) as red/green/blue. An additional IR band is also obtained (vs. 7 bands for Landsat TM scenes). Figure 4. An AWiFS scene used for the Mississippi CDL, 2005.

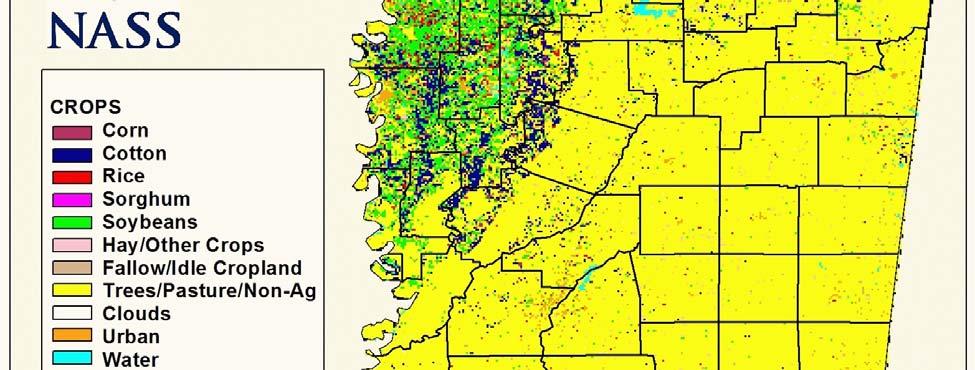
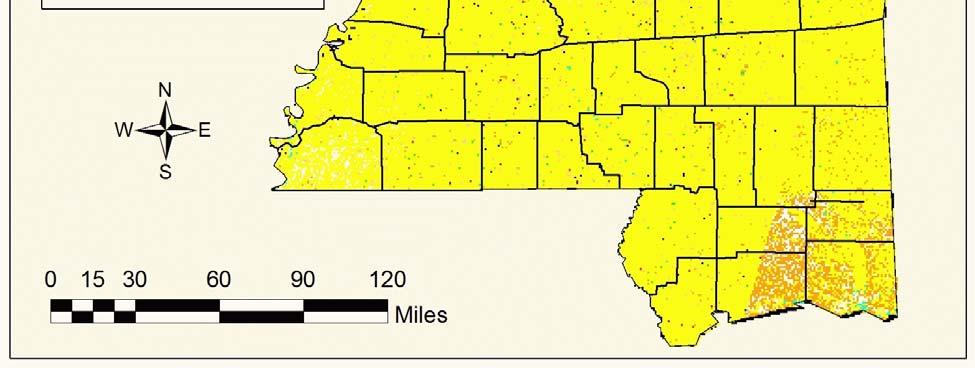
6 Figure 5. The Mississippi Cropland Data Layer, 2005.


7 Figure 6. Multiple year cotton land-use Poster. Multiyear Overlays Rice With the three year rotation schedule, comparing two 3-year periods gives similar land use areas. Note that the shade of red color is even indicating a single year of rice land use per location. Figure 7. Crop rotation for rice is shown by comparing overlay patterns for a normal 3-year cycle of rotation.


8 Comparing Crop Overlays Cotton and Corn Similar land use patterns are observed for these crops. Corn in the Delta is primarily grown in rotation with cotton. Figure 8. A comparison of multi-year overlays of cotton and corn, two crops used in rotation. Comparing Crop Overlays Rice and Soybeans The rotation of land from rice to soybeans is evident. Soybeans are grown in most areas of the Delta. Figure 9. Multilayer overlays comparing rice and soybeans, two crops commonly rotated.


9 Crop Overlays by Priority Overlaying soybeans with cotton and then overlaying both with rice reveals that potential rice acreage is nearly equivalent to the cotton acreage. Figure 10. Multilayer overlays of the major crops reveal land suitability better than a single year CDL and have predictive power. References: [ 1] F.L. Shore, T.L. Gregory, and R. Mueller, Selection of multi-temporal scenes for the Mississippi Cropland Data Layer, 2004, Proceedings of the 3 rd International Workshop on the Analysis of Multi-temporal Remote Sensing Images, Biloxi, MS, May [2] F.L. Shore, T.L. Gregory, and R. Mueller, Remote sensing for cropland monitoring in Mississippi, , Proceedings of the GIS in the Rockies Conference, Denver, CO, September, [3] F.L. Shore, T.L. Gregory, and R. Mueller, GIS Applications for the Mississippi Cropland Data Layer, Proc eedings of the ASPRS 2006 Conference, Reno, NV, May, 2006, in press. [4] R. Mueller and M. Ozga, "Creating a Cropland Data Layer for an entire state," Proceedings of the ACSM- ASP RS 2002 Conference, Washington DC, ASPRS, Bethesda, MD, April [5] G. Hanuschak, R. Hale, M. Craig, R. Mueller, and G. Hart, The new economics of remote sensing for agricultural statistics in the United States, Caesar Conference, Rome, Italy, June [6] J. D. Allen and G. A. Hanuschak, The Remote Sensing Applications Program of the National Agricultural Statistics Service: , U.S. Department of Agriculture, NASS Staff Report No. SRB-88-08, 1988.
10 [7] M. Ozga, M. E Craig, "PEDITOR - Statistical image analysis for agriculture," Washington Statistical Society (WSS) Seminar, April, [8] C. D. Day, A Compilation of PEDITOR Estimation Formulas. U.S. Department of Agriculture, NASS/RDD Rese arch Paper No. RDD-02-03, January Author Information: Fred L. Shore, Ph.D., Senior Analyst Mississippi Department of Agriculture 121 N. Jefferson Street Jackson, MS (601) , fax (601) fred_shore@nass.usda.gov Thomas L. Gregory, Mississippi Director National Agricultural Statistics Service 121 N. Jefferson Street, Suite 230 Jackson, MS (601) , fax (601) tommy_gregory@nass.usda.gov Rick Mueller, Department Head Research and Development Division National Agricultural Statistics Service 3251 Old Lee Highway, Room 305 Fairfax, VA (703) ext. 111, fax (703) rick_mueller@nass.usda.gov and Commerce