2009 Durum Outlook World and U.S. Situation World Pasta Day October 2009 Jim Peterson Marketing Director N.D. Wheat Commission
|
|
|
- Emil Eaton
- 5 years ago
- Views:
Transcription
1 2009 Durum Outlook World and U.S. Situation World Pasta Day October 2009 Jim Peterson Marketing Director N.D. Wheat Commission TH AVE SE, SUITE 104 Mandan, N.D Phone: Fax: Website:

2 2009 Prices Continued decline in prices from record levels posted in 2007 and 2008 Prices less volatile and trading in a narrow, fairly stable price range with supply rebound in 2008 and 2009 Semolina prices FOB Minneapolis down 53% from $.31/kilo, over $1/kilo two years ago U.S. export values around $200 to $210/MT -- over $900/MT in March 2008 U.S. producer prices around $140-$150/MT Low prices likely to reduce plantings in 2010 Cost of production nearer to $200/MT
3 2009 World Crop Crop larger than expected this spring 2 nd largest on record North Africa Big crops in Morocco and Algeria Canada Crop lower than 2008 but larger than expected mid-summer with no major quality issues reported despite later maturity and harvest U.S. Very large crop despite reduced area and late planting. Record yields with very strong quality EU Smaller crop size with some quality issues in the Italian Crop

4 Average North Dakota Durum Bids Producer Level Top Milling Quality Per Bushel Per Ton Source: Average of 9 ND elevator bids posted in AgWeek

5 WORLD DURUM PRODUCTION Million Ton Source: USDA, Stats Canada and Int l Grains Council 10/9/09
6 WORLD DURUM PRODUCTION Million Ton Change EU % Canada % U.S % Turkey % Algeria % Morocco % Tunisia % Others % World Total % Source: USDA, Stats Canada and International Grains Council 10/9/09

7 Durum Stocks in Major Exporting Countries U.S., Canada, European Union Million Tons Million Bushels End of year inventories projected to increase! Source: USDA, Stats Canada and IGC 10/9/09

8 WORLD DURUM EXPORTS Overall trade projected lower but Canada and the U.S. expected to increase market share. Million Tons Others includes Turkey, Syria, Mexico and Australia Source: Int l Grains Council 10/9/09
9 U.S. Durum 2009 Situation Nationally Acres down 6% 1.03 million hectares (2.55 mill. acres) Production 3 MMT (110 mill. bu.) Record national yield
10 U.S. Durum 2009 Situation US Desert Durum Production 800,000 MT (29.4 mill. bu.) 2nd year of larger than average crop Harvested in June Big share of U.S. domestic grind in June-Sept period US Northern Durum Production 2.2 MMT (78.9 mill. bu.) Up more than 50% from 2008 (drought year). Record yields and high quality crop in most areas

11 U.S. DURUM WHEAT PLANTINGS & PRODUCTION Million Hectares Million Tons Source: USDA 9/30/09
12 U.S. DURUM WHEAT PRODUCTION Planted Harvested Yield Production Yr Avg Hectares-Tons Yr Avg USDA Small Grains Summary 9/30/09

13 U.S. DURUM PRODUCTION BY STATE Million Bushels Million Tons Proj North Dakota Montana AZ & CA 0 Source: USDA 9/30/09
14 Percent 100% 80% U.S. DURUM PRODUCTION Share from Northern / Desert Area 60% 40% 20% Northern Desert Durum 0% North includes North Dakota & Montana Desert includes California & Arizona
15 Desert Durum 2009 Overview / 2010 Outlook Arizona: 51,000 hectares 61,000 in 2008 California: 73,000 hectares 65,000 in 2008 Combined production 800,000 Metric Tons, down slightly from 810,000 MT in 2008 In summer and fall of 2008 producer prices were still attractive -- more than $300 per MT Durum acres were higher in central California Durum was at premium to red/white wheat in 2008 Acres likely to fall in 2010 Some estimates up to 50% Less forward contracting by domestic market and much lower overall market due to big, high quality Northern crop Weaker hay market due to depressed dairy industry could limit extent of acre decline

16 Desert Durum 2009 Quality High hectoliter weight kg/hl 1000 kernel weight grams Vitreous kernels 95% Moisture 6.8% Protein 13.3%, 13.5% in 2008 Total Extraction % up 5% from 2008 Semolina Extraction % up 0.5% from 2008 Ash % up from 0.83% in 2008 Improved cooked firmness but slightly lower color scores Other Industry continues to prioritize the development of Low Cadmium Varieties to maintain EU demand
17 U.S. Northern Durum 2009 Crop Planted area down by 7% 900,000 hectares (2.2 million acres) Lower market prices at planting and cold, wet spring Planting pace two to four weeks behind normal Growing season was nearly ideal for high yields Improved subsoil moisture, timely rains, no disease and unusually cool temperatures Crop maturity was delayed
18 U.S. Northern Durum 2009 Crop Harvest was late and extended but produced big crop high grades Began in mid August and finished in early October Some rain delays did impact vitreous kernels in some areas but not kernel soundness delayed maturity on crop Well above-average yields lowered average protein levels in areas Other Shift in durum varieties planted in 2009, along with good weather has improved overall base quality of Northern durum

19 N.D. Durum Harvest Progress
20 U.S. NORTHERN DURUM 2009 Quality Excellent grade profile Crop averages a #1 HAD 70+% #1 and nearly 90% above #2 Source: North Dakota State University Durum Wheat Quality Lab Plant Sciences Department Data based on 216 producer samples collected during harvest.

21 U.S. NORTHERN DURUM 2009 Quality Average Hectoliter weight 80 kg 1000 kernel weight 42.4 grams Lower protein average 13.5% High falling number avg. 398 seconds Vitreous kernels average 83% Processing performance Total extraction 72.7% up 5% Semolina ext. 65.5% up 4.4% Ash 0.62% below 5-yr avg of 0.69% Higher gluten index 59% Mixogram up from last two yrs. Very high color score in pasta

22 U.S. NORTHERN DURUM: Percent Grade Distribution

23 U.S. NORTHERN DURUM: Kilogram/hectoliter Hectoliter Weight
24 Grams U.S. NORTHERN DURUM: Thousand Kernel Weight
25 U.S. NORTHERN DURUM: Falling Seconds Number

26 Percent U.S. NORTHERN DURUM Protein Content (12% moisture basis)

27 U.S. NORTHERN DURUM Protein Content Distribution 60% of crop still above 13% protein

28 U.S. NORTHERN DURUM Percent Total Defects

29 U.S. NORTHERN DURUM Percent Milling Yields


30 U.S. NORTHERN DURUM Semolina Mixing Strength Mixogram Score Scale 1-8 Reference Mixograms
31 Scale of 1-12 U.S. NORTHERN DURUM Pasta Color Score A pasta sample with a score of 8.0 or higher is considered to have good quality.
32 2009 US Durum Supply/Demand Production up 31% and overall supplies 35% higher compared to 2008 Record yields in northern areas Stronger than average Desert Durum production High grading crop No significant quality issues
33 2009 US Durum Supply/Demand Overall demand up 16% from MMT compared to 2.9 MMT Domestic demand accounts for 67% of market in 2009, down from 76% prior year Pasta demand in the U.S. remains strong and expect some shift back to more DURUM pasta Exports projected up 67% to 1.1 MMT EU and North Africa Projected ending stocks by June 2010 are 1.4 MMT, double the June 2009 level Big shift from June 2008 when stocks fell to 0.2 MMT
34 U.S. DURUM SUPPLIES Million Bushels Million Tons Source: USDA October 10/9/09

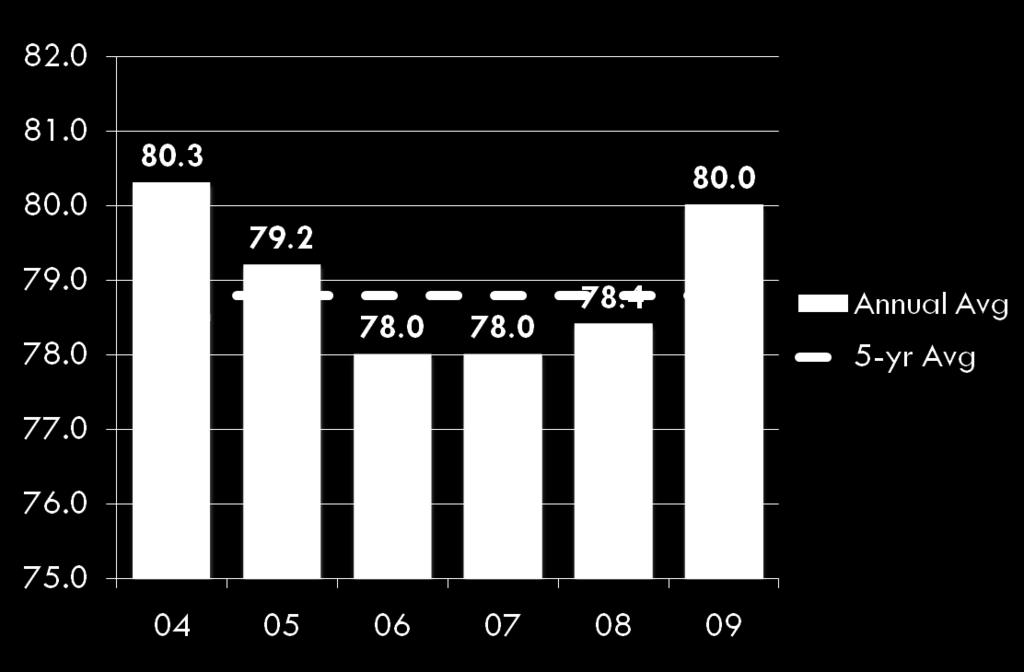
35 U.S. DURUM DOMESTIC FOOD USE Annual Average Record high set in 2006 Pasta sales still strong in recent years but reflects non-durum wheat use in some pasta Million Bushels Source: USDA October 10/9/09

36 U.S. DURUM EXPORTS Annual Average Million Bushels Source: USDA October 10/9/09


37 EXPORT PACE U.S. DURUM WHEAT As of October 15, 2009 Million Tons Million Bushels Much stronger early season export pace in 2009! 10/22/09
38 U.S. DURUM STOCKS Annual Average Million Bushels Very rapid build-up in inventories Need demand! Source: USDA October 10/9/09
 Per Bushel")

39 Per Ton U.S. AVERAGE FARM PRICES (Long Term) Per Bushel Overall wheat prices lower and durum has lost it s premium to non-durum wheat. Source: USDA, Annual Price Summary 10/9/09
40 Summary Wheat and durum supply and demand situation points to prices remaining fairly flat and stable near-term Back-to-back record and near record crops Durum has lost much of it s premium to non-durum wheat Tempered durum use in 2008 Rebound in 2009? U.S. durum crop is very large and of good quality A very good value for buyers!
41 Summary Weak U.S. $ makes U.S. exports more competitive Overall wheat exports still slow, but durum has fared better Signs of outside investor money flowing back into commodity markets If it continues, will press prices higher into Prices will need to work higher into 2010 to sustain durum acres and wheat acres in general
42 .