The TEEB approach to the loss of biodiversity and ecosystem services Genesis and making of the TEEB studies, methodology, and main results
|
|
|
- Magdalene Freeman
- 5 years ago
- Views:
Transcription
1 The TEEB approach to the loss of biodiversity and ecosystem services Genesis and making of the TEEB studies, methodology, and main results Patrick ten Brink TEEB for Policy Makers Co-ordinator Head of Brussels Office Institute for European Environmental Policy (IEEP) CAPACITY-BUILDING WORKSHOP FOR NORTH AFRICA AND THE MIDDLE EAST ON THE ECONOMICS OF ECOSYSTEMS AND BIODIVERSITY (TEEB) Beirut, February 2012
2 Presentation overview TEEB origins & the biodiversity challenges Conceptual basis of TEEB Valuation & the evidence base Policy tools to respond to the challenge Summary Annex 1: CBD Strategic Plan targets Annex 2: Questionnaire: Reviewing the incorporation of biodiversity and ecosystem services into NBSAPs
The economic")


3 TEEB s Genesis, Aims and progress G8+5 Potsdam Potsdam Initiative Biological Diversity )The economic significance of the global loss of biological diversity Importance of recognising, demonstrating & responding to values of nature Engagement: ~500 authors, reviewers & cases from across the globe Ecol./Env. Economics literature Interim Report Climate Issues Update TEEB End User Reports Brussels 2009, London 2010 TEEB Synthesis TEEB Books CBD COP11 Delhi National TEEBs Netherlands Nordics Norway Brazil India CBD COP 9 Bonn 2008 Input to UNFCCC 2009 India, Brazil, Belgium, Japan & South Africa Sept Sectoral TEEB work Water Ag BD COP 10 Nagoya, Oct 2010 Rio+20 Brazil
 Scientific coordination (H.")


4 TEEB Architecture (Phase 1 and 2) Coordination group: Initiators / sponsors Vision + demand driven: growing country engagement Advisory Board Study Leader (Pavan Sukhdev) Scientific coordination (H. Wittmer, UFZ) Other coordination: UNEP TEEB Coordinators P. Kumar, P. ten Brink, H. Wittmer, H. Gundimeda & J. Bishop & G. Langdale Core teams: across wide range of organisations / expertise areas Authors & Contributors: open architecture, invaluable contributions Reviewers: important process re QA, engagement, buy-in Deliverables End-user focus TEEB4me Comm s & Outreach Open Architecture, (aim for) global representation/relevance & contributions. Dynamic process: country engagement. Over 500 contributors, all continents


5 I believe that the great part of miseries of mankind are broughtupon them by false estimates they have made of the value of things. Biodiversity (loss) Fisheries exploitation Benjamin Franklin, Source: FAO 2005a: 7 $50 bn/yr lost econ. value, over exploitation (World Bank 2008) Coral reefs at risk Source: Nellemann et al 2008: 22 Forestry deforestation, afforestation There is a renaissance underway, in which people are waking up to the tremendous values of natural capital and devising ingenious ways of incorporating these values into major resource decisions. Gretchen Daily, Stanford University
6 Critical issues The value of biodiversity and ecosystem services are not fully reflected in the markets, in price signals, and policies Decision making (at company, policy & citizen level) still too often fails to take into account the local to global benefits, contributing to a loss of biodiversity and ecosystem services. Assessing ecosystem service benefits (and links to biodiversity and ecosystem functions) and identifying who benefits from what natural capital is critical for policy focus, interest and instrument choice, design and implementation. There is a growing recognition of the need to improve and invest political capital in natural capital accounts and integrated environmental and economic accounts. This is a seen as a slow fuse investment, but one that can lead to a paradigm shift in governance. There is a need to improve the economic signals to help take the values of nature into account in positive incentives and in reforming incentives harmful to the environment as well as regulatory and governance solutions. This requires action at all governance levels + mainstreaming nature s values.
7 CBD COP 10 Nagoya: Strategic Plan strategic goals & 20 headline targets.extracts Strategic goal A: Address the underlying causes of biodiversity loss by mainstreaming biodiversity across government and society Target 1: people aware of the values of biodiversity.. Target 2:. biodiversity values have been integrated.into strategies planning national accounting. reporting systems. Target 3: addressing harmful incentives and promoting positive incentive measures.. Strategic goal D: Enhance the benefits to all from biodiversity and ecosystem services Target 14: ecosystems that provide essential services. restored and safeguarded Target 15: contribution of biodiversity to carbon stocks has been enhanced Nagoya Protocol on Access to Genetic Resources and the Fair and Equitable Sharing of Benefits Arising from their Utilization; Evidence on values of biodiversity can also support many other targets e.g. On sustainable fisheries, agriculture, forestry, sustainable use
8 The Foundation of TEEB Conceptual Basis
 Understanding data & interactions helps policy")
9 From (policy) drivers to impacts to values Human Drivers Natural Drivers Policy Drivers Source: Adapted from Braat and ten Brink et al (2008) Understanding data & interactions helps policy decisions.


, others are pure public goods(eg health, identify) Values include market")

10 Ecosystem services Provisioning services Food, fibre and fuel; Water provision Genetic resources Regulating Services Climate /climate change regulation Water and waste purification; Air purification; Erosion control Pollination Biological control Cultural Services Aesthetics, Landscape value, recreation and tourism Cultural values and inspirational services Supporting Services: Soil formation & fertility, photosynthesis, nutrient cycle, pollination Some are private goods (eg food provisioning), others public goods that can become (part) private (eg tourism, pollination), others are pure public goods(eg health, identify) Values include market values, existing or potential (e.g. pending market creation); Some values are real as avoided costs or eventually as replacement costs. Others not in market transactions or GDP, but are very real for citizens, community & society.

11 Ecosystem Services (MA framework): support wellbeing in many ways Source: MEA

")
12 Biodiversity (genes, species, ecosystems) & its value is about Diversity/variety e.g. pharmaceuticals, food security, biomimicry; E.g. genetic resources: > than Quantity e.g. timber, carbon storage, fish stock, flood control, water retention E.g. for fish production: > than Building on Balmford and Rodriguez et al (2009) Scoping the Science Quality e.g landscape & tourism, ecosystems & water filtration, resilience (to climate change, IAS)


13 Many ecosystem services from the same piece of land Benefits local to global Benefits are spatially dependent Key to understand the interactions - it is the link of ecological systems with economic and social systems that defines the value
14 Biodiversity values : What can you know; wish to know The Benefits Pyramid To get the full picture one needs mix of monetary, quantitative, spatial, and qualitative information / understanding Valuation tends to build on physical assessment Range of tools at each level Available information Press interest Policy needs The Evidence Base and Demand Quantitative / qualitative Monetary
15 Taking account of public goods can change what is the right decision on land/resource use US$ /ha/yr Based only on private gain, the tradeoff choice favours conversion.. Shrimp Farm Mangroves $9632/ha $584/ha private profits $1220/ha private profits less subsidies private profits If public wealth is included, the trade-off choice changes completely.. $584/ha After Adding Public Benefits From mangroves $12,392/ha Storm protection Fishery nursery Net of public costs of restoration needed after 5 years Important that investment / permit / subsidy choices take into account the whole picture of the benefits -ve $11,172/ha Source: Barbier et al, 2007
16 Sources: van Beukering, P.J.H., H.S.J. Cesar, M.A. Janssen (2003). Economic valuation of the Leuser National Park on Sumatra, Indonesia. Ecological Economics 44, pp and van Beukering, P.J.H., H.S.J. Cesar, M.A. Janssen (2002). Economic valuation of the Leuser Ecosystem in Sumatra. In: Conservation Dividents? ASEAN Biodiversity Vol 2. Nr. 2, Leuser National Park on Sumatra, Indonesia Distribution of ecosystem benefits Local community best option Logging industry best option What is best depends on who you are: understanding who wins & who stands to lose in decisions is paramount.
 Range of ecosystem benefits and time profile")


17 Leuser National Park on Sumatra, Indonesia (cont.) Range of ecosystem benefits and time profile There can be trade-offs across Ecosystem services The benefits and who wins and loses will be time sensitive Scenarios 2000 to 2030, discount rate 0% (Beukering et al ) Transition planning important
18 Fit for purpose: what level of precision is needed? Policy Making if benefits an order of magnitude > costs (or vice versa), then clear signal for need for policy action (or not). Precision less critical in Impact Assessment (IA) - robust order of magnitude can suffice. Instrument Design eg PES, REDD+, ETS greater precision needed to get the design right (e.g. what level of payments, defining additionality & conditionality) + confidence in instrument In project and permit assessment as precise an answer is needed where possible, but whole picture also needed In compliance checking (e.g.performance under PES/REDD) as precise an answer as possible is needed. Verifiability. Fit for purpose: Policy needs & context defines the level of robustness and precision needed Good governance only requires answers fit for purpose proportionality principle
19 TEEB and the evidence base on the values of nature & the response to the values of nature
20 TEEB for Policy Makers The Global Biodiversity Crisis Nature s assets & biodiversity loss Economic values and loss Social dimension Measuring what we manage Indicators Accounts (SEEA/Waves) Valuation Assessment Available Solutions PES (e.g. water), PES: REDD+ Markets, GPP Subsidy reform Legislation, liability, taxes & charges Protected Areas Investment in natural capital (restoration et al) Transforming our approach to natural capital
 New Zealand: Te Papanui Park -")
 PES & Rochefort (Beer) PES for water quality Venezuela: PA helps avoid potential replacement costs of hydro dams (~US$90-$134m over 30yr) Vietnam restoring/investing in")
21 Evidence base - Assessing values and actions Assessing the value of working with natural capital has helped determine where ecosystems can provide goods and services at lower cost than by man-made technological alternatives and where they can lead to significant savings USA-NY: Catskills-Delaware watershed for NY: PES/working with nature saves money (~5US$bn) New Zealand: Te Papanui Park - water supply to hydropower, Dunedin city, farmers (~$136m) Mexico: PSAH to forest owners, aquifer recharge, water quality, deforestation, poverty (~US$303m) France & Belgium: Priv. Sector: Vittel (Mineral water) PES & Rochefort (Beer) PES for water quality Venezuela: PA helps avoid potential replacement costs of hydro dams (~US$90-$134m over 30yr) Vietnam restoring/investing in Mangroves - cheaper than dyke maintenance (~US$: 1m to 7m/yr) South Africa: WfW public PES to address IAS, avoids costs and provides jobs (~20,000; 52% ) Germany : peatland restoration: avoidance cost of CO2 ~ 8 to 12 /t CO 2 (0-4 alt. land use) Critical to assess where working with nature saves money for public (city, region, national), private sector, communities and citizens & who can make it happen Sources: various. Mainly in TEEB for National and International Policy Makers, TEEB for local and regional policy and TEEB cases
22 Beneficiaries: Public sector (e.g. water: nat. & municipalities) & Public goods (e.g. forests, biodiversity, climate), Private sector (e.g. water, beer, energy, agriculture), Citizens (e.g. water quantity, quality, price, security) and Communities (e.g. payments, livelihoods/jobs, ecological assets & GDP of the poor ) Decisions: conservation / restoration investment, PES / public programmes, spatial planning and protected areas, certification / labelling of products and production processes Policy synergies: Water availability/quantity, quality, Climate - mitigation (green carbon) and (ecosystem based) adaptation to CC Job creation and livelihoods Security - natural hazards (e.g. flooding), water, energy Finances - public sector budget savings (Nat. gov t, public services, municipalities) Industrial policy energy, water, forestry, agriculture... Consumer affordability Poverty, community and culture Development cooperation and in each case : biodiversity. For Politicians / Decision makers - many policy synergies

23 Natures benefits : for free until they are gone Over 75 % of the world s crop plants rely on pollination by animals The annual economic value of insect-pollinated crops in the EU is about EUR 15 billion 30 % of fruits, 7 % of vegetables and 48 % of nuts produced in the EU depend on pollinators The value of a forest through its provision of natural pollinators: e.g. Costa Rica ~ at US$ 395 per ha/yr or 7% of farm Income (Ricketts et al. 2004). Domesticated pollinator (honey bee) UKNEA: economic value of biotic pollination as a contribution to crop market value in 2007 at EUR 629 million, 2011) Loss of pollinators (domesticated & wild) reduces crop yield through reduced and unreliable pollination Wild pollinator (hover fly) Building on presentation by Dr Anne Franklin (2010), various references in EU 2010 Biodiversity Baseline (EEA, 2010) + UK NEA, 2011, Ricketts et al, 2004)
24 Carbon Storage : Climate mitigation values Estimated value of carbon storage in 2010 and 2020 in ENPI South countries (high and low estimate): an illustration of the carbon value of forests CO 2 stored in forest stock (living carbon) mtc02 Value of carbon storage 2010 million (stock value) Value of carbon storage in 2020 with trend in forest cover and forest carbon from 1990 to 2010 continued to 2020 and with 2020 carbon prices million (stock value) 2010 /tco2 32 /tco2 39 /tco2 /tco2 Algeria 257 4,422 8,228 9,886 14,196 Egypt ,051 1,509 Israel Jordan Lebanon Morocco ,915 25,888 31,606 45,383 OPT Syria ,383 1,690 2,427 Tunisia ,062 1,370 1,967 ENPI South 1,202 20,668 38,451 46,931 67,389 Source: ten Brink et al (2011),own calculations based on FAO (2011) data ten Brink et al (2011) Analysis for European Neighbourhood Policy (ENP) Countries and the Russian Federation on Social and Economic Benefits of Enhanced Environmental Protection. Regional Report: ENPI South. Available on

25 Examples of Value: Coral Reefs in Egypt In Egypt est. over 4,000 km2 of coral reefs (Cesar, 2003). Coral reefs biologically diverse ecosystems; ~>50% MPAs Critical habitat for many marine species ESS: shoreline protection, generation of coral sand, nitrogen fixation, cultural services: > 2 million tourists visit the Egyptian Red Sea, ~ 30+ % of them are direct users of reefs (Cesar, 2003). Income generated ~ 80 million LE (EEA, 2009), ~ 10m/km2 Range of threats -a global loss of over 10 % of these valuable ecosystems + 15 % lost due to warming of the surface ocean (EEAA, 2010b). Source: Reefbase at Bassi, S. and Nada, E Analysis for European Neighbourhood Policy (ENP) Countries and the Russian Federation on social and economic benefits of enhanced environmental protection - Arab Republic of Egypt Country Report. Available on
 Cesar (2003) estimated the monetary benefits related to tourism revenues, fishery, research, bio prospecting and biodiversity, by comparing a sustainable management scenario in 2050 with BaU")
26 Coral Reefs in Egypt (cont.) Cesar (2003) estimated the monetary benefits related to tourism revenues, fishery, research, bio prospecting and biodiversity, by comparing a sustainable management scenario in 2050 with BaU (continued risks). The net benefit of sustainable management, using a net present value with no discounting, are estimated to be about 1 billion (US$930 million). Using a 5 % discount rate, the net benefits would be about 217 million. This is likely to be an underestimate, as not all the benefits could be monetised Bassi, S. and Nada, E Available on
27 Decision making taking account of values
 for agriculture Waste water treatment capacity of the swamp was assessed")

28 Valuation of ESS from Kampala wetlands, Uganda Services provided by the Nakivubo swamp include natural water purification and treatment & supporting small-scale income activities of poorer communities Problem recognition: Plans to drain the Nakivubo Swamp (>40sqkm) for agriculture Waste water treatment capacity of the swamp was assessed (Emerton 2004) Assessment: Maintaining the wetlands: ~ $ p.a. Running a sewage treatment facility of equivalent capacity: ~2Mio. US$ p.a. Policy Solution: draining plans abandoned & Nakivubo Swamps designated as PA Sources: TEEBCases for TEEB for local and regional policy Recognising and demonstrating the values again critical for decision making. Capacity support.

29 Establishment of a MPA: Tubbataha Reefs, Philippines UNESCO World Heritage site, contains 396 species of corals & has higher species diversity per square meter than the Great Barrier Reef Problem Recognition Bleaching & losses >>Stakeholders meeting Policy Solution No-take areas agreed, & later, the President passed the Tubbataha Reefs Natural Park Act in 2010 ( 10 mile buffer zone around the no-take marine reserve) thus increasing Park by 200% Impacts of policy Increase coral cover 40% , 50% 2004 Fish biomass in nearby reefs doubled since 2000 and perceived fish catches increased from 10 to kg/day Survey found a significant increase in living standards from 2000 to 2004 Sources: Tongson 2007, Samonte-Tan et al. 2008, Dygico 2006; in TEEBCases for TEEB for local and regional Policy

30 Sourou River Valley, Burkina Faso Traditional development strategies focused on converting wetlands for agriculture BUT: wetlands provide multiple ecosystem services contributing to the livelihood of about 60,000 people, worth some 15 Mio. (Somda et al. 2010) Agriculture is only one service among many others Study helped Stakeholder and decision makers realise: Importance of intact wetlands and their multiple ES for local economy Economic valuation of ES is an important tool for guiding wetland management and development strategies Local stakeholders call for including ES in local development plan Cross-sectoral partnerships for integrated wetland management Ecosystem Service Timber (fuelwood and construction) Non-timber forest products Pastures Fishery Transportation on water Agricultural production Tourism Photo: abcburkina ( Total Source: Somda et al Valeur économique de la vallée du Sourou: Une évaluation préliminaire. IUCN West Africa. URL: % Million EURO Source: Somda et al Sources: TEEBCases for TEEB for local and regional policy
31 Instruments taking account of values
32 Payments for Ecosystem Services (PES): One tool to make economics part of the solution Instrument growing in applications 300 PES programmes globally, range of ecosystem services (Blackman & Woodward, 2010) Global value ~ USD 8.2 billion (Ecosystem Marketplace, 2008; see also OECD 2010) Increasing by 10-20% per year (Karousakis, 2010) Big and small e.g.496 ha being protected in an upper watershed in northern Ecuador e.g. 4.9 million ha sloped land being reforested by paying landowners China. Public (municipal, reg., nat.) & private eg Vittel (Fr), Rochefort (B), Bionade (D) for quality water Local (e.g. New York, Quito),Regional (e.g. Niedersachsen), national (e.g Costa Rica, Mexico and Ecuador and international (e.g. REDD+, ABS) Target a range of objectives: water, deforestation, carbon storage, IAS, poverty See also Chapter 5 TEEB for Policy Makers Men do not value a good deed unless it brings a reward Ovid, B.C A.D.


33 Solution: Mexico PSAH: PES to forest owners to preserve forest: manage & not convert forest Hydrological services: Aquifer recharge; Improved surface water quality, reduce frequency & damage from flooding` Result Deforestation rate fell from 1.6 % to 0.6 % thousand hectares of avoided deforestation Avoided GHG emissions ~ 3.2 million tco2e Reduce Deforestation Address Poverty Munoz 2010); Muñoz-Piña et al. 2008; Muñoz-Piña et al Investment in good spatially relevant data critical to develop an evidence base for policy instruments

34 Subsidy Reform : Win-win: environment-economy Subsidies: Over $1trillion/year: a mix of the good, the bad & the ugly (TEEB 2011 Chapter 6: Lehman & ten Brink et al 2011) Opportunities: win-wins, reduce lock-in, progress towards a green economy; free up money to help with MEAs. EU should lead by example: EU Resource efficiency road map asks for an inventory 2012, road map/action plan 2013/4, full EHS reform 2020
35 Investment in ecological infrastructure Ecological infrastructure is key for adaptation to climate change Afforestation: carbon store+ reduced risk of soil erosion & landslides Wetlands and forests and reduced risk of flooding impacts Mangroves and coastal erosion and natural hazards Restore Forests, lakes and wetlands to address water scarcity PAs & connectivity to facilitate resilience of ecosystems and species Can help adapt to climate change at lower cost than man-made technological solutions critical to understand where and support it (eg restoration, protection & management, financing). Adaptation to climate change will receive hundreds of US$ billions in coming years/decades. Critically important that this be cost-effective. Support for identifying where natural capital solutions are appropriate & invest.
36 Eroding natural capital base & tools for an alternative development path, towards a green economy Past loss/ degradation No net loss from 2010 level Halting biodiversity loss Slow biodiversity loss Opportunities/benefits of ESS Investment in natural capital +ve change ` Regulation Better governance Economic signals : PES, REDD, ABS (to reward benefits) Charges, taxes, fines (to avoid Alternative natural capital degradation/damage: Sustainable Subsidy reform consumption right signals (eg reduced for policy) meat) Development path Markets, certification/logos & GPP Agricultural innovation Investment in natural capital: green infrastructure Predicted future loss of natural capital Restoration (schematic) with no additional policy action PAs Today Need multi-level governance & engagement (government, business, communities, citizens) & integration all essential for a transition to a green economy. Mainstream the values of nature.
37 CBD COP 10, Aichi Accord/ Strategic Plan : Major Commitments. The NBSAPs (National Biodiversity Strategies and Action Plans) are a key tool. But links to other strategies and plans critical for NBSAPs success (and vice versa) Key: Governance Implicit integration/reference, one way: Implicit integration/reference, both ways Explicit integration/reference, one way: Explicit integration/reference, both ways: Planned in dashes National development plans NDPs mentions NBSAPs Sector Strategies (Agriculture, Fisheries, Forestry) Climate Strategies (mitigation/ adaptation) Green economy Strategies GES commits actions that help implement the NBSAPs Assessments & ES NBSAPs Mon.Val. Accounts?.No link. Poverty reduction strategies PRS mentions link between poverty & BD & NBSAPS mention PRS also National accounting /reporting systems Other Water? Strategies Good governance / efficiency via joined up thinking and planning; mainstreaming the values of nature a useful tool to identify common agendas and policy synergies
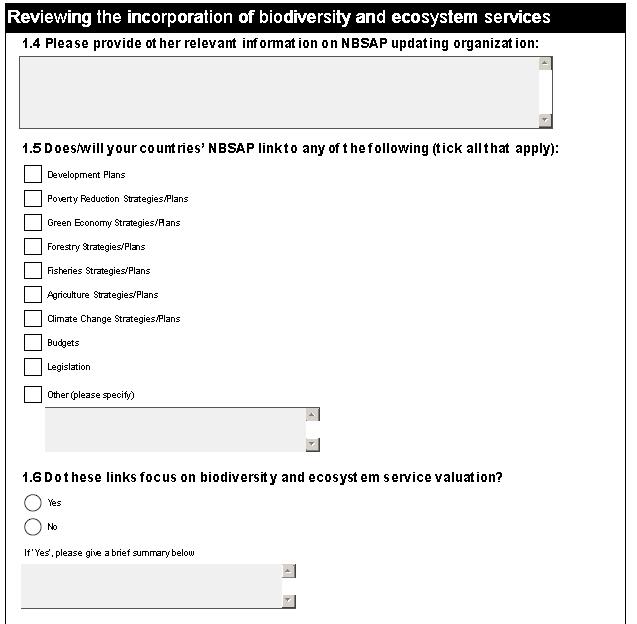
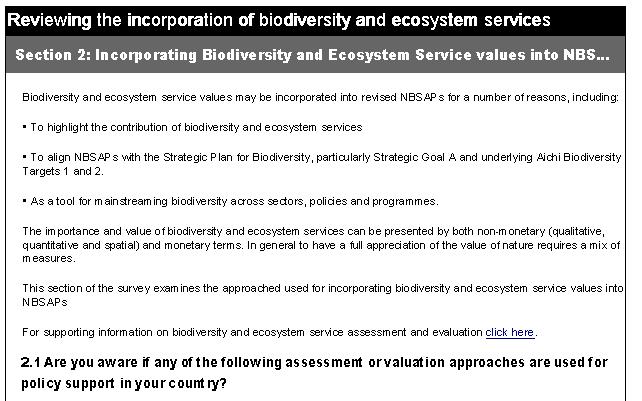
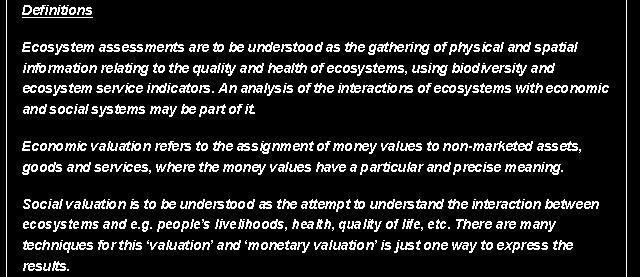
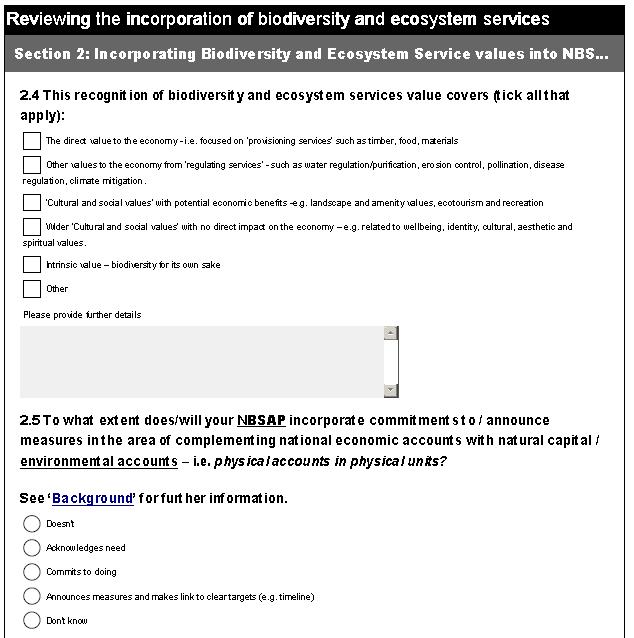
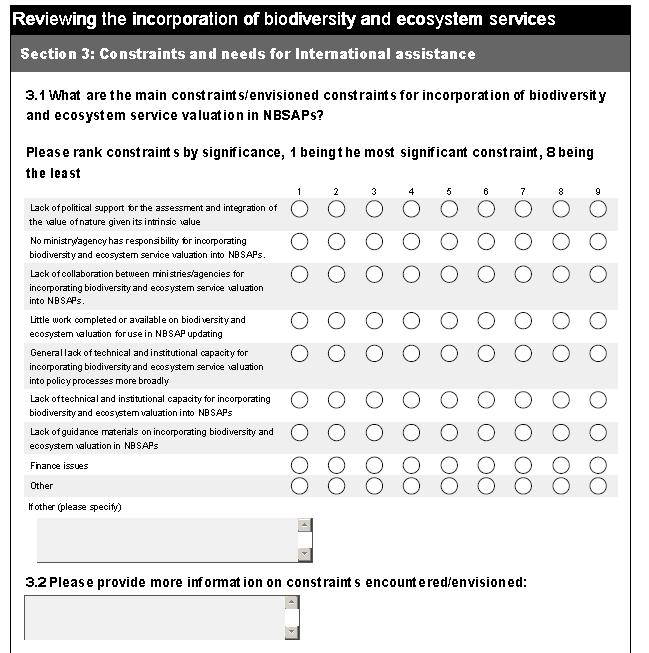
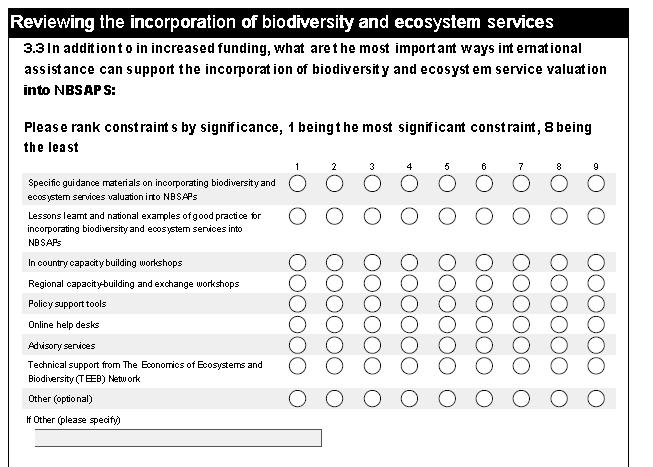
38 Questions to You (Defra Review / Questionnaire) 1. NBSAP Status and Links to other Strategies and Plans 2. Incorporating Biodiversity and Ecosystem Services in NBSAPs 1. What ecosystem assessment & (economic & social) valuation processes in your country? 2. Reference to ecosystem services in NBSAPs? 3. To what extent do NBSAPs reflect the value of biodiversity and ecosystem services? 4. What values are picked up (e.g. of provisioning, regulating and cultural services)? 5. Do NBSAPs commit to physical natural capital accounts? 6. Do NBSAPs commit to economic environmental accounts? 7. What do you see the right role for monetary valuation? What of other tools? 8. What do you see as the role of Monetary valuation in mainstreaming biodiversity? 3. Constraints and Needs for International Assistance (see TEEB Phase 3 survey (Chloe Hill) Please let us know of interesting practice in your countries on assessments, use of ES, valuing nature & monetary valuation, accounting & integration into NBSAPs & wider decision making. See web page for link to online questionnaire (via anna.chenery@unep-wcmc.org) and paper copies We ll share the results on practice with all who wish it.

39 TEEB Summary Making Natures Values Visible:improved evidence base for improved governance, awareness for action government (all levels), business, people is this enough to work out what to do? Measuring better to manage better:from indicators to accounts, valuation & certification Changing the incentives:payments, taxes, charges, subsidy reform, markets Protected areas:biodiversity riches that can also offer value for money, recreation and cultural identity, tourism. Ecological infrastructure and benefits:climate change (mitigation/adaptation), air pollution & health et al Natural capital and poverty reduction: investment for synergies livelihoods, food, water, fuel. Mainstream the economics of nature:across sectors, across policies, seek synergies across disciplines. always better to look at the whole board And engage the full set of players


40 Thank you TEEB Reports available on See also Patrick ten Brink IEEP is an independent, not-for-profit institute dedicated to the analysis, understanding and promotion of policies for a sustainable environment. See also IEEP s award winning Manual of European Environmental Policy
41 The CBD Strategic Plan for the period Aïchi Protocol Strategic goal A: Address the underlying causes of biodiversity loss by mainstreaming biodiversity across government and society Strategic goal B: Reduce the direct pressures on biodiversity and promote sustainable use Strategic goal C: To improve the status of biodiversity by safeguarding ecosystems, species and genetic diversity Strategic goal D: Enhance the benefits to all from biodiversity and ecosystem services Strategic goal E: Enhance implementation through participatory planning, knowledge management and capacity building CBD (2010); see also ten Brink, P., Eijs, A., Lehmann, M., Mazza, L., Ruhweza, A., and Shine, C., (2011). Transforming our approach to natural capital: the way forward. In The Economics of Ecosystems and Biodiversity in National and International Policy Making. Edited by Patrick ten Brink. Earthscan, London and Washington
42 Strategic goal A: Address the underlying causes of biodiversity loss by mainstreaming biodiversity across government and society Target 1: By 2020, at the latest, people are aware of the values of biodiversity and the steps they can take to conserve and use it sustainably. Target 2: By 2020, at the latest, biodiversity values have been integrated into national and local development and poverty reduction strategies and planning processes and are being incorporated into national accounting, as appropriate, and reporting systems. Target 3: By 2020, at the latest, incentives, including subsidies, harmful to biodiversity are eliminated, phased out or reformed in order to minimize or avoid negative impacts, and positive incentives for the conservation and sustainable use of biodiversity are developed and applied, consistent and in harmony with the Convention and other relevant international obligations, taking into account national socio-economic conditions. Target 4: By 2020, at the latest, Governments, business and stakeholders at all levels have taken steps to achieve or have implemented plans for sustainable production and consumption and have kept the impacts of use of natural resources well within safe ecological limits. CBD (2010)
43 Strategic goal B: Reduce the direct pressures on biodiversity and promote sustainable use Target 5: By 2020, the rate of loss of all natural habitats, including forests, is at least halved and where feasible brought close to zero, and degradation and fragmentation is significantly reduced. Target 6: By 2020 all fish and invertebrate stocks and aquatic plants are managed and harvested sustainably, legally and applying ecosystem based approaches, so that overfishing is avoided, recovery plans and measures are in place for all depleted species, fisheries have no significant adverse impacts on threatened species and vulnerable ecosystems and the impacts of fisheries on stocks, species and ecosystems are within safe ecological limits. Target 7: By 2020 areas under agriculture, aquaculture and forestry are managed sustainably, ensuring conservation of biodiversity. CBD (2010)
44 Strategic goal B:.cont. Target 8: By 2020, pollution, including from excess nutrients, has been brought to levels that are not detrimental to ecosystem function and biodiversity. Target 9: By 2020, invasive alien species and pathways are identified and prioritized, priority species are controlled or eradicated, and measures are in place to manage pathways to prevent their introduction and establishment. Target 10: By 2015, the multiple anthropogenic pressures on coral reefs, and other vulnerable ecosystems impacted by climate change or ocean acidification are minimized, so as to maintain their integrity and functioning. CBD (2010)
45 Strategic goal C: To improve the status of biodiversity by safeguarding ecosystems, species and genetic diversity Target 11: By 2020, at least 17 per cent of terrestrial and inland water, and 10 per cent of coastal and marine areas, especially areas of particular importance for biodiversity and ecosystem services, are conserved through effectively and equitably managed, ecologically representative and well connected systems of protected areas and other effective area-based conservation measures, and integrated into the wider landscape and seascapes. Target 12: By 2020 the extinction of known threatened species has been prevented and their conservation status, particularly of those most in decline, has been improved and sustained. Target 13: By 2020, the genetic diversity of cultivated plants and farmed and domesticated animals and of wild relatives, including other socio-economically as well as culturally valuable species, is maintained, and strategies have been developed and implemented for minimizing genetic erosion and safeguarding their genetic diversity. CBD (2010)
46 Strategic goal D: Enhance the benefits to all from biodiversity and ecosystem services Target 14: By 2020, ecosystems that provide essential services, including services related to water, and contribute to health, livelihoods and well-being, are restored and safeguarded, taking into account the needs of women, indigenous and local communities, and the poor and vulnerable. Target 15: By 2020, ecosystem resilience and the contribution of biodiversity to carbon stocks has been enhanced, through conservation and restoration, including restoration of at least 15 per cent of degraded ecosystems, thereby contributing to climate change mitigation and adaptation and to combating desertification. Target 16: By 2015, the Nagoya Protocol on Access to Genetic Resources and the Fair and Equitable Sharing of Benefits Arising from their Utilization is in force and operational, consistent with national legislation. CBD (2010)
47 Strategic goal E: Enhance implementation through participatory planning, knowledge management & capacity building Target 17: By 2015 each Party has developed, adopted as a policy instrument, and has commenced implementing an effective, participatory and updated national biodiversity strategy and action plan. Target 18: By 2020, the traditional knowledge, innovations and practices of indigenous and local communities relevant for the conservation and sustainable use of biodiversity, and their customary use of biological resources, are respected, subject to national legislation and relevant international obligations, and fully integrated and reflected in the implementation of the Convention with the full and effective participation of indigenous and local communities, at all relevant levels. Target 19: By 2020, knowledge, the science base and technologies relating to biodiversity, its values, functioning, status and trends, and the consequences of its loss, are improved, widely shared and transferred, and applied. Target 20: By 2020, at the latest, the mobilization of financial resources for effectively implementing the Strategic Plan from all sources and in accordance with the consolidated and agreed process in the Strategy for Resource Mobilization should increase substantially from the current levels. This target will be subject to changes contingent to resources needs assessments to be developed and reported by Parties. CBD (2010)

48 Annex Questionnaire Reviewing the incorporation of biodiversity and ecosystem services into NBSAPs UNEP-WCMC & IEEP on behalf of Defra, UK; a contribution to TEEB Phase 3
49
50
51
52
53
54
55
56

 and also available in")
57 etc The questionnaire can be ed to you (contact and also available in paper copy
58 Annex additional cases
59 Working for Water (WfW): SA The Manalana wetland (near Bushbuckridge, Mpumalanga) Restoration within wider PES scheme Severely degraded by erosion that threatened to consume the entire system WfW public works programme intervened in 2006 to reduce the erosion and improve the wetland s ability to continue providing its beneficial services Results The value of livelihood benefits from degraded wetland was just 34 % of what could be achieved after investment in ecosystem rehabilitation; Rehabilitated wetland now contributes provisioning services at a net return of 297 EUR/household/year; Livelihood benefits ~ 182,000 EUR by the rehabilitated wetland; x2 costs The Manalana wetland acts as a safety net for households. Sources: Pollard et al. 2008; Wunder et al 2008a; Sources: TEEBCases for TEEB for local and regional policy Recognising and demonstrating the values and potential for increased value critically important.