Global Supply Chains in Machinery Trade and the Sophisticated Nature of Production/Distribution Networks in East Asia. July 2005
|
|
|
- Dorthy McCoy
- 5 years ago
- Views:
Transcription
1 Draft Comments welcome Global Supply Chains in Machinery Trade and the Sophisticated Nature of Production/Distribution Networks in East Asia July 2005 Mitsuyo Ando (Hitotsubashi University) ** and Fukunari Kimura (Keio University) This version of the paper is prepared for the presentation at the Asia Pacific Trade Seminars (APTS) Meeting 2005 held at Hitotsubashi University, Tokyo, Japan on July 30-31, The microdata analysis of Japanese firms in this paper was conducted as a part of the project A study on structural changes in machinery industries and trends in major production items in Japan (March 2005). The METI database used in the paper was prepared and analyzed in cooperation with the Economic Research Institute of Japan Society (ERI) for the Promotion of Machine Industry (JSPMI), Japan Center for Economic Research (JCER), and the Research and Statistics Department, the Ministry of Economy, Trade, and Industry (METI), the Government of Japan. ** The author for correspondence: Mitsuyo Ando. Address: Faculty of Economics, Hitotsubashi University, 2-1 Naka, Kunitachi, Tokyo , Japan; Telephone: ; Fax: ; m-ando@econ.hit-u.ac.jp.
2 Abstract The most salient phenomenon in recent international trade in East Asia is the formation of international production/distribution networks. This paper applies the two-dimensional fragmentation framework (Kimura and Ando (2005)) to investigate the structure and characteristics of international production/distribution networks. Two important issues are investigated. The one is how the formation of international production/distribution networks, particularly in machinery industries, has changed the overall pattern in East Asian trade, both intra-regional and inter-regional. We find that about a half of intra-regional export expansion of East Asian countries in is induced by the increase in trade in machinery parts and components, which suggests the existence of large magnification effect in intra-regional trade volumes. The relative importance of markets outside East Asia, notably North America and EU markets, seems to rather decline a bit due to the expansion of East Asian markets themselves. Another issue is how corporate firms effectively combine two kinds of fragmentation, i.e., fragmentation in terms of geographical distance and disintegration. The statistical data of affiliates of Japanese firms in East Asia indicate that transactions with Japan are likely to be intra-firm, while transactions in local market tend to be arm s-length (inter-firm), which is consistent with our analytical framework claiming a close link between geographical proximity and outsourcing. Finally, the Baldwin-Kimura approach (Baldwin and Kimura (1998)) is applied to present the worldwide picture of production/distribution networks of Japanese firms.
3 1. Introduction It has been widely recognized in the academic/semi-academic literature of both international trade and development economics that the formation of international production/distribution networks in East Asia is an extremely important, novel phenomenon. The pattern of industrial location and international trade in East Asia is not a typical North-South pattern anymore. Vertical intra-industry trade, particularly in machinery industries, explosively increases, while the European-type horizontal intra-industry trade is rarely observed. De facto economic integration certainly proceeded in East Asia, but the path is not necessarily following the experience of the predecessors such as EU. It is a challenge for both academicians and policy makers to understand what happens in East Asia. The formation of international production/distribution networks is a quite recent phenomenon, only starting in the 1990s, and undermines or at least partially nullifies a large class of old theories and hypotheses. The influential East Asian Miracle report, i.e., the World Bank (1993), was written before the development of production networks, and thus the analysis failed to emphasize the crucial role of foreign direct investment (FDI) in development. The old export platform argument claimed Japanese production operations in East Asia as a strategy for circumventing trade disputes with the US and other markets. Such a story, however, currently explains only a small portion of international production/distribution networks in East Asia. Now, players in the production networks are not only Japanese firms, and the expansion of East Asian market itself is significant. How about the flying geese pattern argument? It cannot be applied anymore to the currently observed international location patterns of manufacturing sectors in the sense that they are dominated by more subtle production-process-wise location patterns, not by industry-by-industry location patterns. A simple link between development stages and competitive industries does not hold anymore. How about discussion on industrial promotion policy or MITI-type picking-winner policies? Such an old-fashioned industrial policy for import substitution is not at the center of policy discussion anymore. The focus of industry promotion policy by developing countries is placed on how to connect indigenous firms with international production/distribution networks. What would be the desired format of economic integration in East Asia? A new policy package must be included in the FTA framework in order to further promote
4 international production/distribution networks. These are all novel arguments and discussion in East Asia. The authors proposed a conceptual framework of two-dimensional fragmentation in the previous work (Kimura and Ando (2005)). It provides a useful analytical approach to understand the mechanics of international production/distribution networks in East Asia. It well explains location patterns of fragmented production blocks across countries with different location advantages, emphasizing the importance of service link that connects remotely located production blocks. Moreover, it effectively describes the logic of production/distribution networks extending beyond the boundary of firm. Arm s-length (inter-firm) fragmentation is an essential element in the formation of agglomeration, and such sophisticated networks in turn provide opportunities for indigenous firms penetrating into production networks developed by multinational enterprises (MNEs). As an extending analysis, this paper is devoted to some of the unsolved questions in connection with the conceptual framework and empirics of the international production/distribution networks. The first is how the formation of international production/distribution networks, particularly in machinery industries, has changed the overall pattern in international trade, both intra-regional and inter-regional. Are the US and EU markets getting to be less important with the expansion of East Asian market itself? How big is the magnification effect of parts and components trade in the expansion of East Asian intra-regional trade? The paper looks into these points regarding the first question. The second question is how corporate firms effectively combine two kinds of fragmentation. In transactions among Japan, NIEs, ASEAN, and China, is there any systemic pattern of intra-firm or arm s-length transactions? Do we observe significant changes over time? Although it is extremely difficult to comprehend these aspects of networks in statistics, the analysis using the micro data of Japanese affiliates can provide us some clues. The paper plan is as follows: the next section reviews the framework of two-dimensional fragmentation and establishes the link with empirical studies conducted in the paper. Section 3 presents the overall picture of intra-regional and inter-regional trade of East Asian countries. Section 4 concentrates on machinery industries and analyzes the nature of fragmentation in two dimensions, i.e., distance and
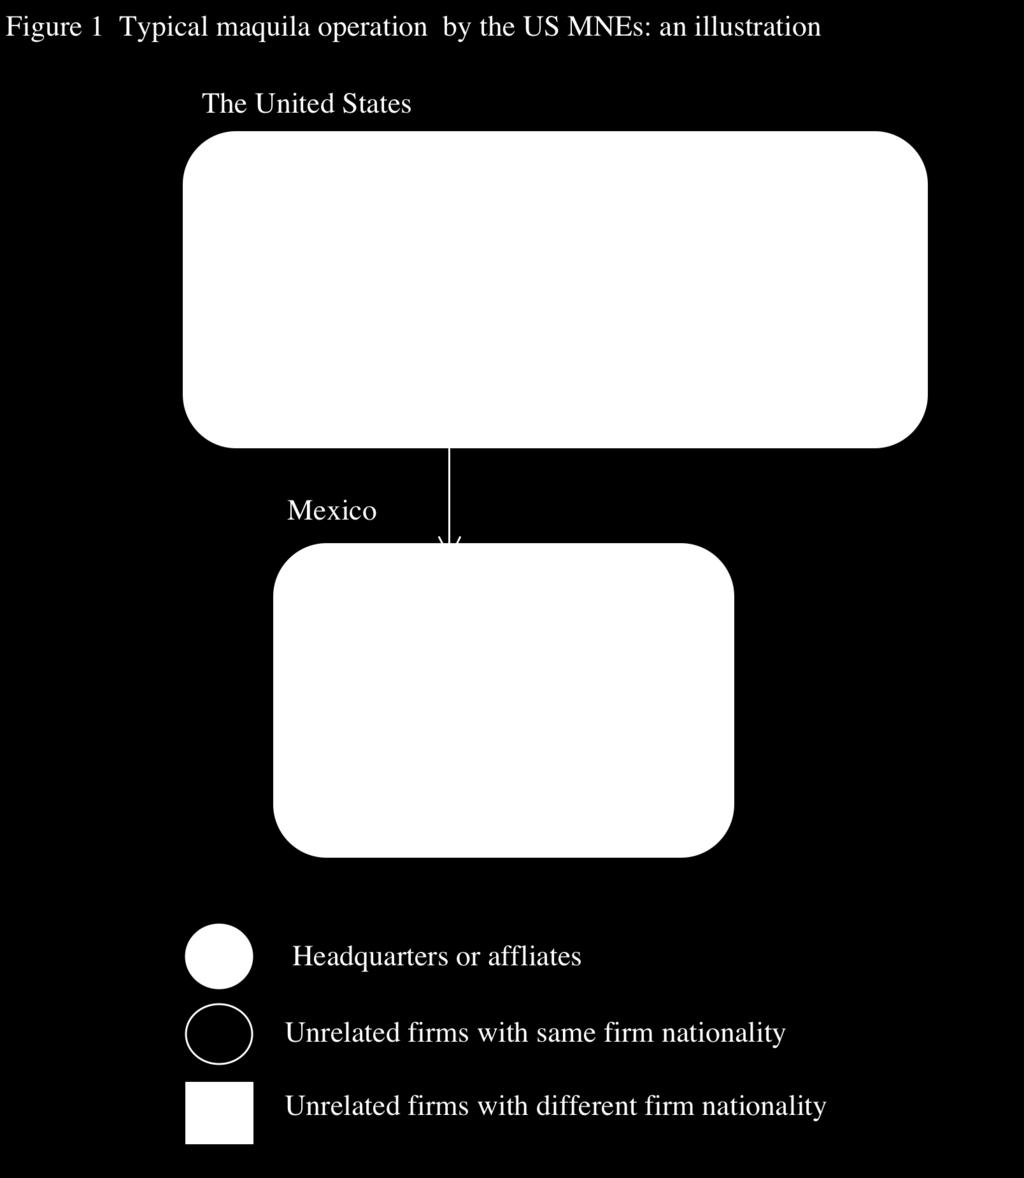
5 disintegration, by using the micro data of Japanese affiliates abroad. Section 5 employs the Baldwin-Kimura approach and presents the estimated pattern of transactions among three geographical locations (Japan, Asia, and the rest of the world) and three firm nationalities (Japanese, Asian, and others). The last section concludes the paper. 2. Conceptual framework of two-dimensional fragmentation The formation of international production/distribution networks has fundamentally changed the pattern of production location and international trade in East Asia. Although networks can be formulated in various industries, most important, both qualitatively and quantitatively, are those in machinery industries including general machinery, electric machinery, transport equipment, and precision machinery. Machinery industries deal with a large number of multi-layered vertical production/distribution processes, and East Asian firms including Japanese firms have a competitive edge in exploring modulation techniques and constructing vertical value chains. International production/distribution networks in East Asia are distinctive and most developed in the world at this point in time in (i) their significance in each economy in the region, (ii) their extensiveness covering a number of countries in the region, and (iii) their sophistication in subtle combination of intra-firm and arm s-length (inter-firm) transactions. The literature of the fragmentation theory and its empirical applications has grown since a seminal work by Jones and Kierzkowski (1990) and proved its applicability in analyzing cross-border production sharing at the production process level. International production/distribution networks in East Asia, however, have developed beyond the original idea of fragmentation, and some expansion of the analytical framework is needed in order to incorporate intra-firm and arm s-length transactions. Kimura and Ando (2005) propose the concept of two-dimensional fragmentation, in particular to analyze the mechanics of production networks in East Asia. Figure 1 illustrates a simple version of Maquila operation in the US-Mexico See Ando and Kimura (2005). Also see Arndt and Kierzkowski (2001), Deardorff (2001), and Cheng and Kierzkowski (2001) for the fragmentation theory.
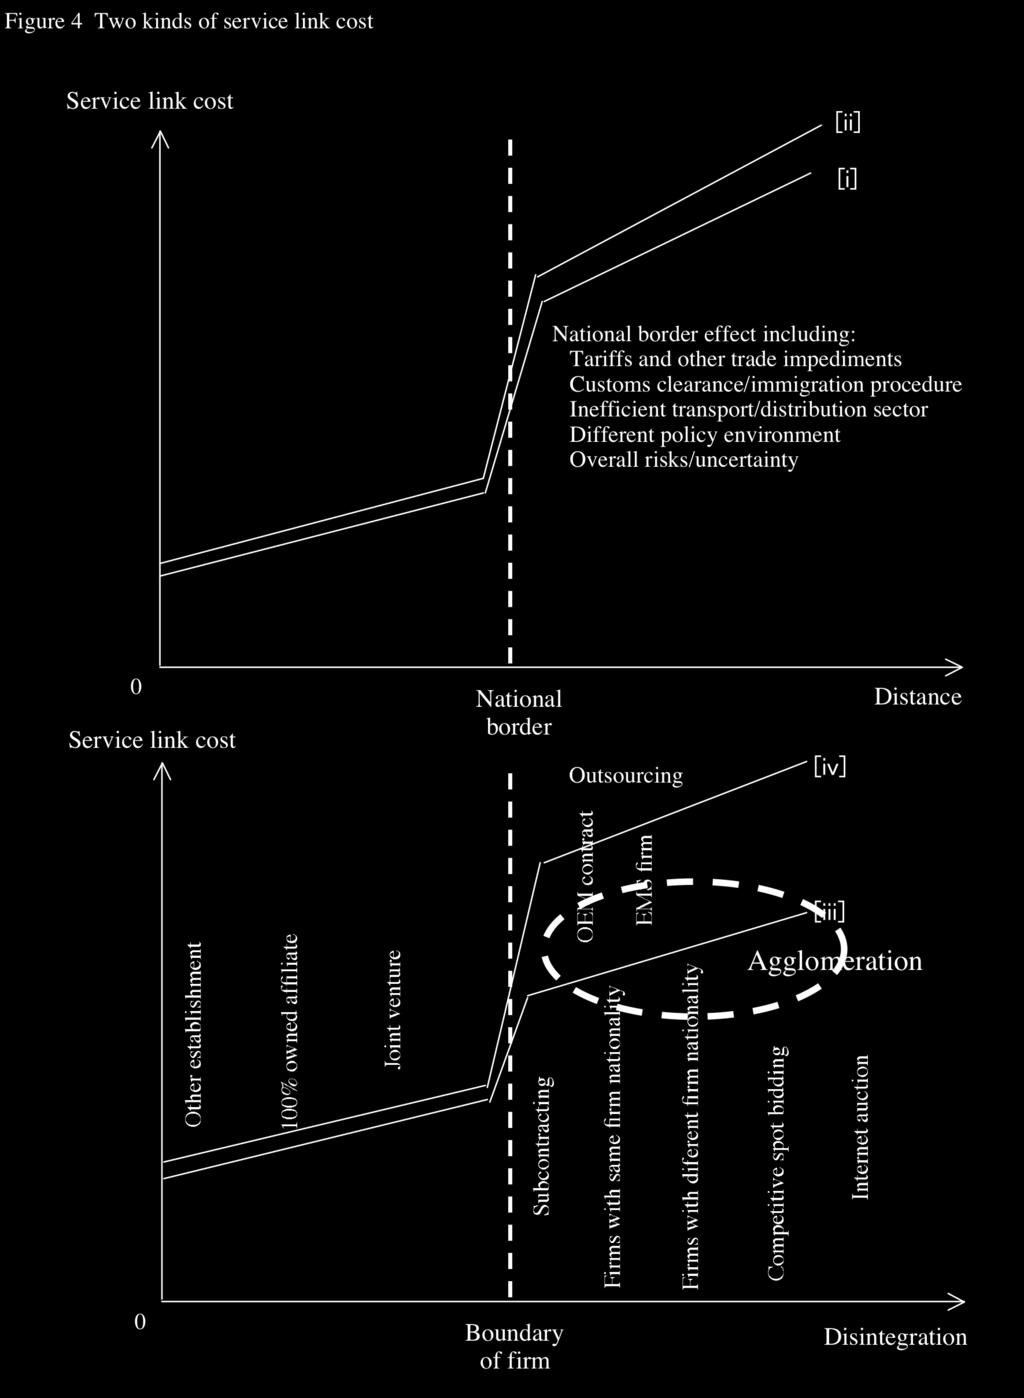
6 nexus. Cross-border production sharing between the US and Mexico is mostly a simple intra-firm fragmentation, accompanied with back-and-forth intra-firm transactions between headquarters in the US and an affiliate in Maquila, Mexico. A typical pattern is as follows: parts and components are sent from US headquarters to a factory in Mexico, the assembly process is conducted there, and the finished products are sent back to the US headquarters. On the other hand, production/distribution networks in East Asia contains a much more complicated combination of intra-firm and arm s-length transactions across a number of countries in the region. Figure 2 is drawn with reference to an actual example of a Japanese manufacturer in electronic machinery industry, extending production/distribution networks all over East Asia and the US. The framework of two-dimensional fragmentation tries to capture such a sophisticated structure of international production/distribution networks. Figure 1 Figure 2 Figure 3 presents fragmentation in a two-dimensional space. The horizontal axis denotes geographical distance. From the original position, a production block can be detached and placed in geographical distance. A dotted line in the middle is a national border, which distinguishes cross-border fragmentation from domestic fragmentation. On the other hand, the vertical axis represents the organization (integration and disintegration) of corporate activities. A fragmented production may be conducted by either intra-firm establishments or unrelated firms. The dotted line is a boundary of firm, distinguishing arm s-length (inter-firm) fragmentation or outsourcing from intra-firm fragmentation. 3 Disintegration and accompanied transaction cost have been long analyzed in the industrial organization literature on vertical integration. As for the references on Japanese subcontracting system, particularly corporate firms choices over vertical integration, subcontracting, and spot market bidding in parts and components procurement, see Kimura (2002). For the renewed interest in the global context, see, for instance, Grossman and Helpman (2003), Grossman and Helpman (2004), Grossman and Helpman (2005), Grossman, Helpman, and Szeidl (2005), which are based on the framework of contract theories.
7 Figure 3 When do corporate firms choose fragmentation? First, there must be a substantial cost reduction in the production of fragmented production blocks (see Table 1). Geographical distance may provide opportunities to explore different production conditions. In particular, cross-border fragmentation enables firms to enjoy diversified location advantages including workers wages, economic infrastructure, policy environment, and others. The disintegration axis would yield chances to utilize business partners strengths. Instead of doing everything in house, arm s-length fragmentation or outsourcing may make the whole production system more efficient. Second, service link cost for the connection between fragmented production blocks should not be too high. Fragmentation beyond national border and/or boundary of firm is inevitably accompanied by substantial service link cost, but such cost must be low enough to enjoy the total cost reduction. Table 1 Service link cost changes as illustrated in Figure 4 when fragmentation takes place along the distance or disintegration axis. When fragmentation occurs in the horizontal direction as [i] and [ii] in Figure 3, service link cost increases according to distance from the original position. In particular, once fragmentation crosses national border, service link cost jumps up because of the national border effect. When fragmentation takes place in the vertical direction as [iii] and [iv], service link cost increases as the controllability of a firm over the fragmented production block gets weaker. Various types of outsourcing along the disintegration axis from subcontracting to internet auction are illustrated in Figure 4. An important observation here is that geographical proximity saves service link cost or transaction cost as [iii] is drawn much lower than [iv]. Figure 4 In East Asia, geographical fragmentation and agglomeration go hand in hand.
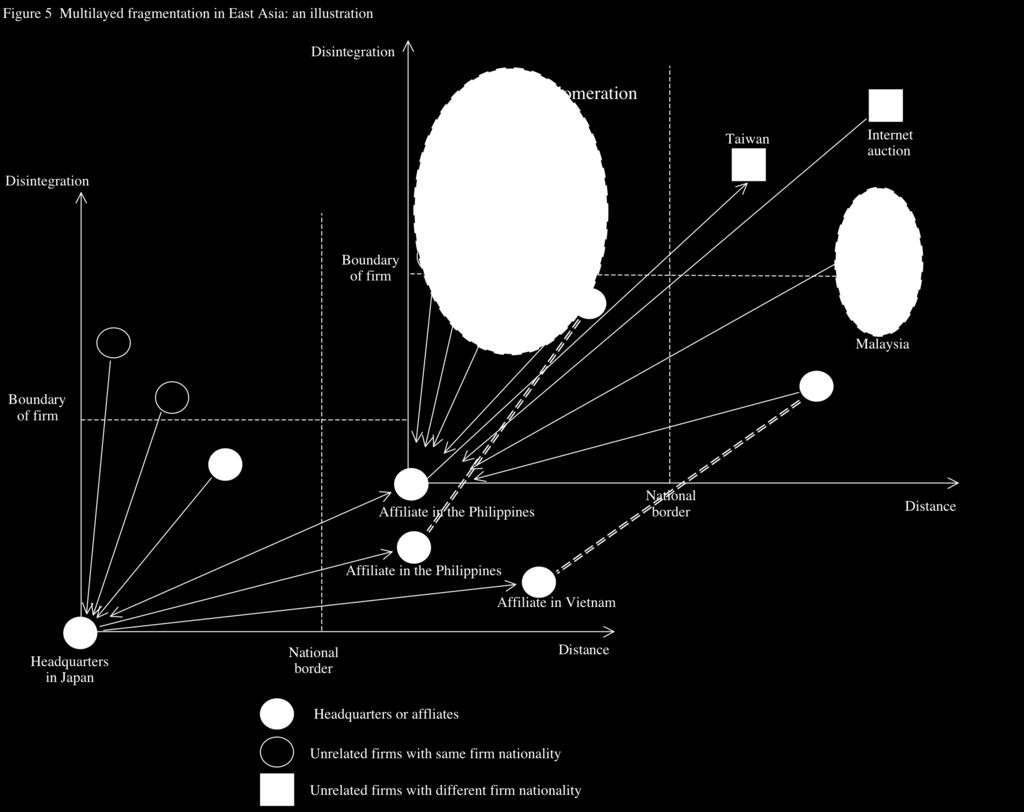
8 In contrast with market-oriented agglomeration in Europe, agglomeration in East Asia is often motivated by the production-side logic. The forces of fragmentation and agglomeration are countervailing in the first place; they are vectors pointing in the opposite directions. In particular, when a firm decides whether to make intra-firm fragmentation, fragmentation or agglomeration is a binary decision. However, at the industry/aggregate level, fragmentation and agglomeration may go together. The concentration of fragmented production blocks occurs at least through the following two channels: first, two kinds of service link cost do not have a monotonic pattern, and local minimal points of service link cost tend to attract a large number of production blocks. Particularly in cases of less developed countries (LDCs), each country, each local province, each city, or each industrial estate has different investment climate. Service link cost is not monotonic at all in both dimensions of distance and disintegration. Moreover, service link is often accompanied with strong economies of scale. Therefore, when a country successfully reduces two kinds of service link cost by proper policies, fragmented production blocks may rush in, and service link cost may be pushed down further. Second, the concentration of production blocks may also happen due to the close relationship between the service link cost along the disintegration axis and geographical proximity as indicated in Figure 4. The service link cost in arm s-length fragmentation is extremely sensitive to geographical distance. The closer the distance with business partners, the smaller the service link cost in searching potential business partners, consulting detailed specs of products, managing product quality and delivery timing, solving disputes over contracts, monitoring, and others. The northwest area in Figure 4 is a hot spot of this type of agglomeration. Here, the concentration of production blocks would reduce the service link cost, and the low service link cost would further attract production blocks; the arrows of causality would go in both directions. The concentrated production blocks in this mechanism generate interactive industrial structure among production blocks. The two-dimensional fragmentation framework captures multilayered fragmentation as Figure 5. By shifting the original position from headquarters in the home country to an affiliate abroad, for example, the complicated structure of fragmentation with intra-firm and arm s-length transactions can be depicted.
9 Figure 5 3. The evolution of intra- and inter-regional trade Now let us examine the first question: how the formation of international production/distribution networks in machinery industries has changed an overall pattern in international trade in East Asia, particularly the pattern of intra-regional and inter-regional trade. Before focusing on intra- and inter-regional trade patterns, we demonstrate the significance of machinery trade in East Asia. Figures 6 and 7 presents the shares of machinery goods and machinery parts and components in total exports to and imports from the world at the beginning of and at the end of the 1990s and in 2003 for major economies in East Asia and other regions. 4 The figures plot countries from the one with the highest export share of machinery parts and components, to address the relative significance of machinery intermediate goods trade. Figure 6 Figure 7 As both figures vividly show, the share of machinery goods in East Asian countries drastically increased in terms of both absolute and relative terms. At the beginning of the 1990s, most countries with relatively high shares of machinery parts and components were developed countries such as Japan, the United States, U.K, and Germany. In 2003, however, East Asian developing countries moved up to the left side, presenting high shares of both machinery intermediate exports and imports. This implies the existence of back-and-forth transactions and growing export-oriented operations in those countries. The trade pattern of Japan also suggests drastic changes in trade and production patterns in the region; while a large portion of its machinery exports composed of machinery final goods in 1990, half of its machinery exports composed of machinery parts and components, with increased shares of their imports, in See Table A.1 for a definition of machinery parts and components in this paper.
10 2003. In East Asia, inter-industry trade patterns between developed and developing countries seem to have considerably changed, and international production/distribution networks in machinery industries have been rapidly developed, involving a number of countries in the region. 5 In other regions, in contrast, higher shares of machinery trade and those of machinery parts and components trade are observed for some specific countries such as the U.S., Mexico, U.K, Germany, Hungary, Czech Republic, and Slovakia. This suggests the development of production networks in machinery industries between the U.S. and Mexico and between U.K./Germany and Central and Eastern European countries, but these networks do not extensively cover a number of countries in the regions like East Asia. Other countries, particularly those in Latin America except Mexico, are found on the right side with far lower shares of machinery exports. In addition, the shares of machinery exports are much lower than those of imports, suggesting import-oriented operations. Tables 2a-5a, in tern, present current-price exports of all products, machinery goods (total), machinery final goods, and machinery parts and components in East Asia including China, ASEAN4, NIEs3, and Japan in 1990, 2001, and 2003 and those in each country/group, by distinguishing intra-east Asian exports from inter-regional exports (expressed as others ). To investigate the relative importance of U.S. market for East Asian exports in particular, corresponding figures are also displayed in parenthesis. Note that Taiwan, which would be one of important players in international production networks in machinery industries, is not unfortunately included in East Asia due to the lack of data available from UN COMTRADE, and thus the value and share of intra-east Asian trade would be underestimated in these tables. Table 2 Ando (2005) analyzes changes in East Asian trade structure in the 1990s by decomposing each country s machinery trade (exports plus imports) with the world at the finely disaggregated level (HS six-digit) into one-way trade, vertical intra-industry trade (vertical IIT), and horizontal intra-industry trade (horizontal IIT), and emphasizes that vertical IIT, particularly vertical IIT in machinery parts and components, expanded. The explosive expansion of machinery intermediates trade indeed resulted in changes in main trade patterns in East Asia from one-way trade to vertical IIT.
11 Table 3 Table 4 Table 5 Clearly, the share of intra-east Asian exports in total exports (all products) by East Asia as a whole has risen, indicating the increasing relative importance, compared to the inter-regional exports. Such an increasing relative importance of intra-regional trade is more vividly observed in machinery trade, particularly machinery parts and components trade. In the case of machinery intermediates exports in East Asia as a whole, intra-regional shares climbed up to 58 percent in 2003 from 40 percent in The corresponding figures for Japan, NIEs3, ASEAN4, and China are 48 percent in 2003 (28 percent in 1990), 65 percent (54 percent), 60 percent (51 percent), and 56 percent (74 percent), respectively. 6 These figures confirm enhancing relative significance of intra-regional trade pattern to inter-regional trade pattern in machinery industries, particularly in machinery parts and components trade. In other words, the importance of markets outside the region for East Asian exports, including U.S. market, has relatively declined. Considering the expanded domestic demand according to economic growth of East Asian countries, which is not appeared as transactions beyond national borders, the relative importance of intra-east Asian market would have been enhanced more notably than suggested by the above figures. How fast intra-east Asian trade (inter-regional trade, East Asian trade) has grown in absolute terms since the 1990s, and what induced such an expansion of intra-east Asian trade? Tables 2b-5b (2c-5c, 2d-5d) present the growth from 1990 to 2003 in intra-east Asian exports (inter-regional exports, East Asian exports) for all products, total machinery goods, machinery final goods, machinery parts and components. During that period, intra-east Asian trade of all commodities expanded by Although the intra-east Asian share for machinery parts and components has declined in China, the value of machinery intermediate exports itself explosively increased. Moreover, the U.S. share indeed increased to over 20 percent at the end of the 1990s from the low share of 10 percent in 1992, but around 20 percent-share of U.S. market is more or less equivalent to the cases of other East Asian countries.
12 two to three times in absolute terms: the growth rates are 191 percent for East Asia, 160 percent for Japan, 170 percent for NIEs3, 247 percent for ASEAN4, and 226 percent for China. For machinery trade as a whole and machinery parts and components trade, the corresponding figures are much higher, and even in the short period from 2001 to 2003, surprisingly, their drastic growth was observed (Tables 2a/b-5a/b). 7 These figures imply that machinery trade should be and remain significant contributors to growth in intra-east Asian trade since the 1990s. To what extent did machinery trade contribute to intra-regional export growth? Tables 2b-5b (2d-5d) also show the percentage of the contribution of machinery trade to the growth in intra-east Asian trade (East Asian trade). Roughly speaking, 66 percent (63 percent) of the growth in intra-east Asian trade (East Asian trade) during 13 years, 191 percent (150 percent), can be explained by machinery trade, and half (over one-third) by machinery parts and components. In other words, a large portion of the growth in intra-east Asian trade was induced by the expansion of machinery trade, mostly that of machinery parts and components, in East Asia. This can be regarded as a sort of magnification effect of machinery intermediates trade, which is referred to by Yi (2003). In East Asia, back-and-forth transactions in international production networks exist, and they are reflected in this magnification effect. In the case of inter-regional trade in East Asia, similarly, machinery trade explain over 60 percent of the growth (Tables 2c-5c). The main factor of machinery trade contributed to the growth, however, is different from the case of intra-east Asian trade; around 60 percent of the growth in machinery trade (i.e., over 30 percent of the growth in all products) was induced by an expansion of machinery final goods, not that of machinery parts and components (Tables 2c-5c and Figure 8). It implies that machinery final goods produced in the international production networks in East Asia are sold to the United States, Europe, and so on, though the relative importance of these markets are rather decreasing as discussed above. The growth rates in machinery trade as a whole and machinery parts and components trade are 322 percent and 452 percent for East Asia, 163 percent and 261 percent for Japan, 310 percent and 429 percent for NIEs3, 828 percent and 886 percent for ASEAN4, and 640 percent and 992 percent for China, respectively.
13 Figure 8 4. Intra-firm and arm s-length transactions: changing behavior of Japanese firms The second question is how corporate firms combine two kinds of fragmentation in production/distribution networks. The intensive use of disintegration-type fragmentation or outsourcing arrangements is one of the salient phenomena in East Asia. Firms in East Asia have indigenous traditions of inter-firm linkages. We had an old legendary subcontracting system among Japanese firms, based on dualistic structure of large firms in the downstream and small/medium enterprises in the upstream. Taiwan had a tradition of peculiar horizontal subcontracting arrangements among machinery manufacturers. The Hong Kong Guangdong nexus developed innovative system of processing deal trade in textile and machinery industries. These traditions perhaps worked as prototypes of disintegration-type fragmentation in East Asia. The development of modulation technique was a technological backbone facilitating outsourcing arrangements. The formal empirical analysis of intra-firm and arm s-length transactions is plagued by serious deficiency of statistical data. The analysis using the micro data of Japanese affiliates abroad, however, provides some limited information on the characteristics of production/distribution networks. The analysis in this section is based on the micro data compiled by the Ministry of Economy, Trade, and Industry (METI), Government of Japan (the former name was the Ministry of International Trade and Industry (MITI)): The 1993F/Y, 1996F/Y, 1999F/Y, and 2002F/Y Survey of Overseas Business Activities of Japanese Companies. This database presents information on the performance of foreign affiliates of Japanese firms. In particular, the extensive surveys conducted every three years, which are used in this section, include detailed information on overseas business activities such as intra-firm and arm s length transactions. In this data set, foreign affiliates include both affiliates abroad with no less than 10 percent ownership by Japanese parent firms and affiliates of affiliates abroad with no less than 50 percent ownership by affiliates abroad, except those in finance, insurance, or real estates. We must note that the effective return ratios are unfortunately as low as 60 percent since the survey is approved statistics.
14 Table 7 presents the number of Japanese affiliates located in East Asia and their performance in terms of total sales/purchases, by-destination sales/by-origin purchases ratios, and intra-firm transaction ratios in 1992, 1995, 1998, and As Table 7 displays, machinery industries (industry 290 to 320) hold over 30 percent and approximately 40 percent of the total number of Japanese affiliates in East Asia and their total sales/purchases in 2001, respectively. In particular, electric machinery (300) and transport equipment (310) sectors compose of a large portion of Japanese machinery affiliates in East Asia in terms of the number and their activities. To clarify features of their transactions, Tables 8-9 focus on intra-firm and arm s length transactions by Japanese electric machinery affiliates and Japanese transport equipment affiliates in East Asia, NIEs4, ASEAN4, and China, respectively, which are calculated based on Table 7 and corresponding tables to Japanese affiliates located in NIES4, ASEAN4, and China. 8 In the tables, local means the country in which the affiliate concerned is located, third countries are countries other than Japan and local, and East Asia indicates countries in East Asia other than Japan and local. Table 7 Table 8 Table 9 The nature of fragmentation and its changes over time can be observed particularly in the largest sector, electric machinery (300), and patterns of by-destination sales and by-origin purchases vividly present the development of international production/distribution networks. The most salient phenomenon is large and increasing share of sales/purchases with other East Asian countries, suggesting the extensiveness of networks and their development: shares of other East Asian countries increased from 18 percent (nine percent) in 1992 to 22 percent (20 percent) for sales and 15 percent (eight percent) in 1992 to 28 percent (20 percent) in the electric machinery sector The corresponding tables to Japanese affiliates in NIES4, ASEAN4, and China are omitted from the paper, which are available upon request.
15 (machinery sectors as a whole). In addition, increasing shares of Japan in sales and decreasing shares of Japan in purchases indicate the expansion of back-and-forth cross-border production sharing as well as the development of local vendors. Decreasing trend of local sales ratios suggests switching weights from import-substituting-type industries to export-oriented, network-forming industries. Ratios of intra-firm/arm s-length transactions conform to our two-dimensional fragmentation framework. Intra-firm transaction ratios for transactions with Japan, other East Asian countries, and local get smaller in this order. In other words, intra-firm transactions are large in transactions with Japan while arm s-length transactions are important in local transactions, and transactions with other East Asian countries are in the middle. This observation proves a close link between geographical proximity and disintegration-type fragmentation, indicating the formation of agglomeration of fragmented production blocks, as discussed in section 2. The above-mentioned characteristics seem to be reflected most closely in the case of Japanese affiliates in ASEAN4 (Tables 8-9). In the case of Japanese affiliates in China, we must note that operations by Japanese firms in China were seriously started only recently (see values of sales and purchases in Table 8). 9 Rapid increases in local purchases ratios from 16 percent in 1992 to 37 percent in 2001, eventually reaching up to the level of ASEAN4, suggest the formation of local vertical links in agglomeration in China. On the other hand, declining trend in purchases from Japan, mostly intra-firm purchases, is clearly observed: shares of purchases from Japan (intra-firm purchases from Japan) in total purchases by Japanese electric machinery affiliates in China are 84 percent (78 percent) in 1992 and 38 percent (25 percent) in In China, purchases from Japan, particularly intra-firm purchases from Japan, seem to be significantly replaced by the local arm s length purchases according to the above-mentioned The performance of Japanese electric machinery affiliates in China drastically enlarged from 70 billion JPY in 1992 to 1,298 billion JPY in 2001 for sales and from 47 billion JPY in 1992 to 919 billion JPY in 2001 for purchases. The number of affiliates also confirm the recent expansion of Japanese firms operations in China: the number of Japanese electric machinery affiliates in China in the dataset is 30 (54) in 1992 and 281 (552) in 2001 in the electric machinery sector (machinery sectors as a whole), which accounts for around seven percent and 27 percent of Japanese electric machinery in East Asia, respectively.
16 development of agglomeration in the local market, and intra-firm purchases from other East Asian countries, probably mainly ASEAN countries. Although arm s length transaction ratios are large for transactions with other East Asian countries by Japanese electric machinery affiliates in ASEAN4, intra-firm transaction ratios are large by those in China. Such a difference in intra-firm transaction ratios with other East Asian countries may indicate proximity among ASEAN countries and remoteness of China from ASEAN4. Low intra-firm sales ratios in selling to local market perhaps reflect regulations on local distribution sector. In contrast with the electric machinery sector, the transport equipment sector (310) is affected by import-substitution policies. Extremely high ratios of local sales in total sales reflect import-substitution policies applied by most of the East Asian countries, though the ratios have a decreasing trend Global networks of Japanese firms: the Baldwin-Kimura approach The last section tried to capture the activities of Japanese firms in East Asia by analyzing patterns of by-destination sales/by-origin purchases. These statistical figures, however, do not directly indicate the magnitude of Japanese firms activities in both exporting from Japan and producing in East Asia; since intermediate inputs embodied in traded commodities may be counted multiple times, the amount of gross sales does not necessarily reflect the importance of each transaction. In addition, those figures do not directly imply who is trading with whom, considering firm nationality. For instance, arm s length transactions in local market by Japanese affiliates in East Asia include not only transactions with other nationality firms but also those with other Japanese affiliates in the local market. Thus, this section introduces a concept of value added contents and attempts to quantify the importance of each channel of transactions, reflecting firm nationality. To quantify the whole Japanese firms activities in different locations and embodied value added contents in international transactions, this section employs the Ando (2005) demonstrates that even in the transportation equipment sector, in which one-way trade is still the main pattern of trade in the whole sector largely due to import substitution policy, vigorous transactions of parts and components across borders were observed in 2000 while they were seldom found at the beginning of the 1990s.
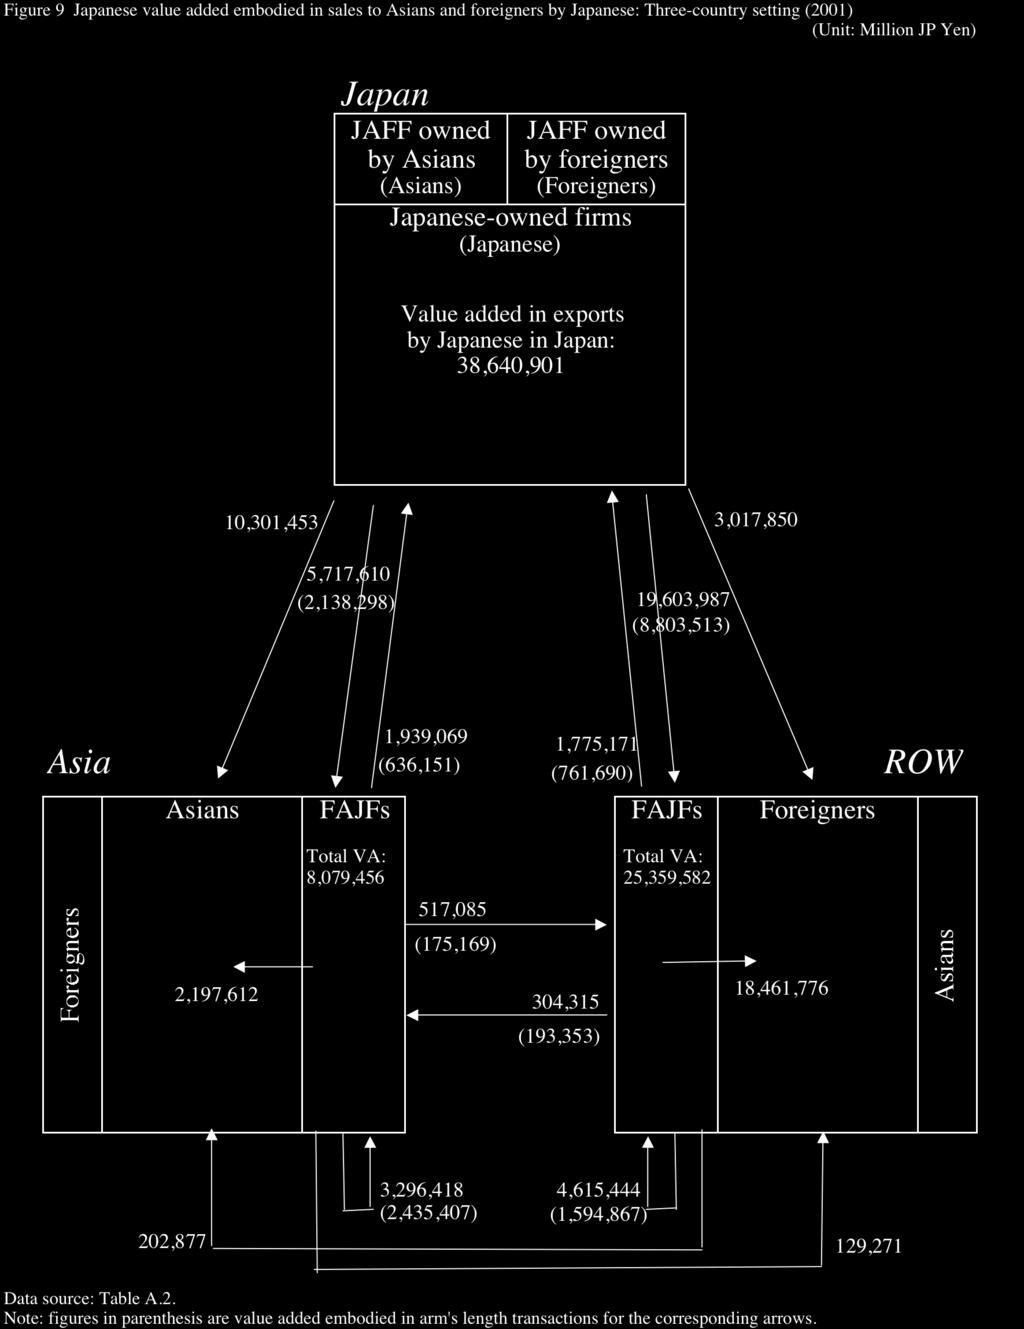
17 firm nationality approach, which was first proposed by Baldwin and Kimura (1998) and Kimura and Baldwin (1998) in a two-country setting, was extended to a three-country setting by Kimura (1998), and was recently applied to the Japanese firms activities in 2000 by Ando and Kimura (2005). In this section, the previous model in a three-country setting is slightly extended by incorporating intra-firm and arm s length transactions estimated in section 4. The firm nationality approach in a three-country setting thinks of three geographical territories, i.e., Japan, Asia, and the rest of the world (ROW) as well as three nationals, i.e., Japanese, Asians, and foreigners (the national of ROW). "Japanese" consist of Japanese-owned firms located in Japan, households and governments located in Japan, and foreign affiliates of Japanese firms (FAJFs) located in Asia and ROW. Asians and foreigners are defined in the symmetric way. Three nationals reside in three different locations, and thus 9 blocks are drawn as in Figure 9. Although transactions within a block and between blocks are, conceptually, illustrated as 81 (9 times 9) arrows in total, we can fill out 14 arrows of transactions because only statistical data from the Japanese side are readily available. Figure 9 The figures shown for 14 arrows in Figure 9 stand for the estimated Japanese value added contents of each transaction embodied at the starting point of the corresponding arrow in 2001, based on the estimates in Table A.2 in the Appendix. The figures in parenthesis in Figure 9 are value added embodied in arm's length transactions for the corresponding arrows. The detailed explanation of estimation method is also given in Table A.2. Although these figures are only rough estimates with a number of reservations on the data set, the value added account provides useful insights on the activities of Japanese multinational enterprises (MNEs). Major findings are the following three: first, the activities of FAJFs in Asia become significant, and the formation of Asia stands for Asian countries east of Pakistan in this section. Note that "Japanese" in this definition is different from those on the residency basis or those in the sense of factor holders; we treat FAJF as controlled by Japanese and count the whole activities of FAJF as activities by Japanese.
18 agglomeration is observed. 5.7 trillion yen of Japanese value added contents are exported by Japanese in Japan to FAJFs in Asia, while Japanese in Asia earn 8.1 trillion yen of value added. 3.3 trillion yen of value added contents earned by FAJFs are embodied in transactions among FAJFs in Asia, in which arm s-length transactions have large shares, suggesting active vertical transactions in the agglomeration by FAJFs. Second, there are three major channels when Japanese intend to sell their products to Asians in Asia, i.e., to produce in Japan and export directly, to produce in Japan and distribute through FAJFs in Asia, and to produce in Japan and distribute through FAJFs in Asia. The channel, to produce in Japan and export directly, accounts for 72 percent of total value added contents embodied in sales of Japanese to Asians in Asia, to produce in Japan and distribute through FAJFs in Asia 11 percent (seven percent through intra-firms and four percent through arm s length), and to produce in Asia and sell locally 15 percent. 13 We can guess that these products certainly include a large portion of machinery parts and components, suggesting active arm s-length/across-firm-nationality transactions occur in production/distribution networks. Third, FAJFs in Asia do not directly sell much to the ROW including the US and EU markets. This of course does not necessarily mean that Japanese value added contents are barely exported to the US or EU. Rather, machinery parts and components supplied by Japanese companies may perhaps be crucial inputs when firms with different nationalities intend to export to the US and EU markets. This again suggests the existence of vertical production sharing among firms with different nationalities. 6. Concluding remarks This paper applies the two-dimensional fragmentation framework to empirically examine the structure and characteristics of international Total value added contents embodied in sales of Japanese to Asians in Asia here are estimated as the sum of those through the following channels: to produce in Japan and export directly, to produce in Japan and distribute through FAJFs in Asia, to produce in Japan and distribute through FAJFs in ROW, to produce in Japan and distribute through FAJFs in Asia, and to produce in ROW and export to Asia.
19 production/distribution networks. The analysis on international trade data, particularly trade in machineries and machinery parts and components, verifies the importance of international production/distribution networks in the East Asian economies, and enhancing relative importance of intra-east Asian markets to other markets outside of the region including the U.S market for East Asian exports. The investigation of the data set of affiliates of Japanese firms in East Asia suggests the microstructure of vertical production chains effectively combining intra-firm and arm s-length transactions. The application of the Baldwin-Kimura approach presents the overall picture of worldwide production/distribution networks in the case of Japanese firms, showing a sharp contrast between operations in East Asia and those in the rest of the world. The authors believe that the paper successfully reconfirms the distinctive characteristics of international production distribution networks; i.e., their significance, extensiveness, and sophistication. References Ando, M. (2005) Fragmentation and Vertical Intra-industry Trade in East Asia. Presented at Claremont Regional Integration Workshop with Particular Reference to Asia, Claremont McKenna College, and Japan Economic Association, Spring. Ando, M. and Kimura, F. (2005) The Formation of International Production and Distribution Networks in East Asia. In T. Ito and A. Rose, eds., International Trade (NBER-East Asia Seminar on Economics, Volume 14), Chicago: The University of Chicago Press. Arndt, S. W., and Kierzkowski, H. (2001). Fragmentation: New Production Patterns in the World Economy, Oxford: Oxford University Press. Baldwin, R. E., and Kimura, F. (1998) Measuring U.S. International Goods and Services Transactions. In R. E. Baldwin, R. E. Lipsey, and J. D. Richardson, eds., Geography and Ownership as Bases for Economic Accounting, Chicago: The University of Chicago Press, 1998: Cheng, L. K., and Kierzkowski, H. (2001). Global Production and Trade in East Asia, Boston: Kluwer Academic Publishers. Deardorff, A. V. (2001). Fragmentation in Simple Trade Models. North American Journal of Economics and Finance, 12:
20 Grossman, G. M. and Helpman,E (2003) "Outsourcing versus FDI in Industry Equilibrium." Journal of the European Economic Association, vol. 1, no.2. Grossman, G. M. and Helpman,E (2004) "Managerial Incentives and the International Organization of Production." Journal of International Economics, vol. 63, no.2. Grossman, G. M. and Helpman,E (2005) "Outsourcing in a Global Economy." Review of Economic Studies, vol. 72, no.1. Grossman, G.M., Helpman, E. and Szeidl. A. (2005) "Complementarities between Outsourcing and Foreign Sourcing." American Economic Review vol. 95. Jones, R. W., and Kierzkowski, H. (1990). The Role of Services in Production and International Trade: a Theoretical Framework. In R. W. Jones and A. O. Krueger, eds., The Political Economy of International Trade: Essays in Honor of R. E. Baldwin, Oxford: Basil Blackwell. Kimura, F. (1998) Japanese Multinationals and Regional Integration in Asia. In Kiichiro Fukasaku, Fukunari Kimura, and Shujiro Urata, eds., Asia & Europe: Beyond Competing Regionalism. Brington: Sussex Academic Press. Kimura, F. (2002) Subcontracting and the Performance of Small and Medium Firms in Japan. Small Business Economics 18, 2002: Kimura, F. and Ando, M. (2005) Two-dimensional Fragmentation in East Asia: Conceptual Framework and Empirics. International Review of Economics and Finance (special issue on Outsourcing and Fragmentation: Blessing or Threat edited by Henryk Kierzkowski) Vol. 14, Issue 3, 2005: The Ministry of Economy, Trade and Industry (METI), Government of Japan. (2003a) The 36th Survey of Japanese Affiliates of Foreign Firms (Japanese version). Tokyo: Printing Office, Ministry of Finance, Government of Japan. The Ministry of Economy, Trade and Industry (METI), Government of Japan. (2003b) The 32nd Survey of Overseas Business Activities of Japanese Companies (Japanese version). Tokyo: Printing Office, Ministry of Finance, Government of Japan. Yi, K-M. (2003) Can Vertical Specialization Explain the Growth of World Trade? Journal of Political Economy 111, pp World Bank. (1993) The East Asian Miracle: Economic Growth and Public Policy. Oxford: Oxford University Press.
21

22
: transportation, Elements (examples): wage level, access to telecommunications, inefficiency in resources,")
23 Table 1 Tradeoffs in two-dimensional fragmentation Service link cost connecting production block Production cost per se in production blocks Fragmention Cost due to geographical distance Cost reduction from location advantages along the distance axis Elements (examples): transportation, Elements (examples): wage level, access to telecommunications, inefficiency in resources, infrastructure service inputs such distribution, trade impediments, as electricity, water, and industrial estates, coordination cost technological capability Fragmentation Transaction cost due to losing controllability Cost reduction from (dis)internalization along the disintegration axis Elements (examples): Information Elements (examples): availability of gathering cost on potential business various types of potential business partners partners, monitoring cost, risks on the including foreign and indigenous firms, stability of contracts, immature dispute development of supporting industry, settlement mechanism, other deficiency in institutional capacity for various types of legal system and economic institutions contracts, degree of incomplete information

24
25

26

27
28 Table 2a Development of intra-regional exports in East Asia Table 2b Factors of growth in intra-east Asian exports (%) (Millions US$, %) (i) Growth in intra-east Asian exports ( ) All products Value Share Value Share Value Share Machinery goods (total) Machinery goods: parts and components - Machinery final goods Intra-East Asia 54, , , Machinery parts and components Others 82, , , (ii) Contribution to growth in intra-east Asian exports (U.S.) (39,624) (28.9) (81,426) (20.3) (82,543) (15.8) Machinery goods (total) Machinery final goods 18.1 (28) Total 137, , , Machinery parts and components 47.7 (72) Machinery goods: final goods Table 2c Factors of growth in inter-regional exports (%) Intra-East Asia 50, , , (i) Growth in inter-regional exports ( ) All products Others 168, , , Machinery goods (total) (U.S.) (70,183) (32.0) (130,088) (34.2) (143,634) (28.7) - Machinery final goods Machinery parts and components Total 219, , , (ii) Contribution to growth in inter-regional exports Machinery goods: total Machinery goods (total) 60.5 Intra-East Asia 105, , , Machinery final goods 34.8 (58) - Machinery parts and components 25.7 (42) Others 251, , , (U.S.) (109,807) (30.8) (211,513) (27.1) (226,177) (22.1) Table 2d Factors of growth in East Asian exports (%) (i) Growth in East Asian exports ( ) Total 356, , ,022, All products Machinery goods (total) All products - Machinery final goods Intra-East Asia 270, , , Machinery parts and components Others 432, , , (ii) Contribution to growth in East Asian exports (U.S.) (174,978) (24.9) (332,883) (24.2) (355,643) (20.2) Machinery goods (total) Machinery final goods 26.7 (42) Total 703, ,374, ,759, Machinery parts and components 36.4 (58) Data source: authors' calculation, based on UN COMTRADE Note: "East Asia" here includes China, ASEAN4, NIES3, and Japan. Due to lack of data available from UN COMexports, (i) Taiwan is not included in East Asia, (ii) data for China in 1992 and Hong Kong in 1993 are used in calculating intra-east Asian exports in 1990, (iii) data for the Philippines are not included in calculating intra-east Asian exports in 1990.
29 Table 3a Development of intra-regional exports in Japan Table 3b Factors of growth in Japanese intra-east Asian export (%) (Millions US$, %) (i) Growth in Japanese intra-east Asian exports ( ) All products Value Share Value Share Value Share Machinery goods (total) Machinery goods: parts and components - Machinery final goods 72.0 Intra-East Asia 21, , , Machinery parts and components Others 55, , , (ii) Contribution to growth in Japanese intra-east Asian exports (U.S.) (26,401) (34.2) (39,191) (28.2) (35,694) (22.2) Machinery goods (total) Machinery final goods 14.8 (23) Total 77, , , Machinery parts and components 49.9 (77) Machinery goods: final goods Table 3c Factors of growth in Japanese inter-regional exports (%) Intra-East Asia 22, , , (i) Growth in Japanese inter-regional exports ( ) All products 34.0 Others 118, , , Machinery goods (total) 30.7 (U.S.) (49,971) (35.3) (60,832) (38.8) (59,307) (32.4) - Machinery final goods Machinery parts and components 50.6 Total 141, , , (ii) Contribution to growth in Japanese inter-regional exports Machinery goods: total Machinery goods (total) 72.4 Intra-East Asia 44, , , Machinery final goods 34.2 (47) - Machinery parts and components 38.3 (53) Others 174, , , (U.S.) (76,373) (34.9) (100,023) (33.8) (95,001) (27.6) Table 3d Factors of growth in Japanese exports (%) (i) Growth in Japaense exports ( ) Total 218, , , All products 64.5 Machinery goods (total) 57.4 All products - Machinery final goods 29.5 Intra-East Asia 69, , , Machinery parts and components Others 217, , , (ii) Contribution to growth in East Asian exports (U.S.) (90,944) (31.7) (122,549) (30.4) (117,539) (24.9) Machinery goods (total) Machinery final goods 22.6 (33) Total 286, , , Machinery parts and components 45.3 (67) Data source: authors' calculation, based on UN COMTRADE. Note:"Intra-East Asia" here includes China, ASEAN4, and NIES3. Due to lack of data available from UN COMTRADE, Taiwan is not included in East Asia.
30 Table 4a Development of intra-regional exports in NIEs3 Table 4b Factors of growth in NIEs' intra-east Asian export (%) (Millions US$, %) (i) Growth in NIEs' intra-east Asian exports ( ) All products Value Share Value Share Value Share Machinery goods (total) Machinery goods: parts and components - Machinery final goods Intra-East Asia 23, , , Machinery parts and components Others 20, , , (ii) Contribution to growth in NIEs' intra-east Asian exports (U.S.) (9,600) (21.9) (20,881) (14.6) (21,247) (11.2) Machinery goods (total) Machinery final goods 16.6 (23) Total 43, , , Machinery parts and components 56.6 (77) Machinery goods: final goods Table 4c Factors of growth in NIEs' inter-regional exports (%) Intra-East Asia 18, , , (i) Growth in NIEs' inter-regional exports ( ) All products 91.3 Others 43, , , Machinery goods (total) (U.S.) (17,336) (28.2) (32,909) (27.2) (36,329) (24.2) - Machinery final goods Machinery parts and components Total 61, , , (ii) Contribution to growth in NIEs' inter-regional exports Machinery goods: total Machinery goods (total) 76.9 Intra-East Asia 42, , , Machinery final goods 43.4 (56) - Machinery parts and components 33.5 (44) Others 63, , , (U.S.) (26,936) (25.6) (53,790) (20.4) (57,576) (16.9) Table 4d Factors of growth in NIEs' exports (%) (i) Growth in NIE's exports ( ) Total 105, , , All products Machinery goods (total) All products - Machinery final goods Intra-East Asia 104, , , Machinery parts and components Others 148, , , (ii) Contribution to growth in NIEs' exports (U.S.) (61,841) (24.4) (92,466) (20.0) (96,642) (17.1) Machinery goods (total) Machinery final goods 28.2 (38) Total 253, , , Machinery parts and components 46.6 (62) Data source: authors' calculation, based on UN COMTRADE. Note: "Intra-East Asia" here includes China, ASEAN4, and Japan. Due to lack of data available from UN COMTRADE, (i) Taiwan is not included in East Asia, and (ii) data for Hong Kong in 1993 are used in calculating intra-east Asian exports in 1990.
31 Table 5a Development of intra-regional exports in ASEAN4 Table 5b Factors of growth in ASEAN4's intra-east Asian expor (%) (Millions US$, %) (i) Growth in ASEAN4's intra-east Asian exports ( ) All products Value Share Value Share Value Share Machinery goods (total) Machinery goods: parts and components - Machinery final goods Intra-East Asia 5, , , Machinery parts and components Others 5, , , (ii) Contribution to growth in ASEAN4's intra-east Asian exports (U.S.) (3,162) (30.0) (14,335) (19.2) (13,102) (14.8) Machinery goods (total) Machinery final goods 14.9 (24) Total 10, , , Machinery parts and components 47.6 (76) Machinery goods: final goods Table 5c Factors of growth in ASEAN4's inter-regional exports (%) Intra-East Asia 2, , , (i) Growth in ASEAN4's inter-regional exports ( ) All products Others 4, , , Machinery goods (total) (U.S.) (2,004) (31.8) (12,776) (29.1) (15,157) (30.9) - Machinery final goods Machinery parts and components Total 6, , , (ii) Contribution to growth in ASEAN4's inter-regional exports Machinery goods: total Machinery goods (total) 56.0 Intra-East Asia 7, , , Machinery final goods 26.7 (48) - Machinery parts and components 29.3 (52) Others 9, , , (U.S.) (5,166) (30.7) (27,110) (22.9) (28,259) (20.5) Table 5d Factors of growth in ASEAN4's exports (%) (i) Growth in ASEAN4's exports ( ) Total 16, , , All products Machinery goods (total) All products - Machinery final goods Intra-East Asia 40, , , Machinery parts and components Others 37, , , (ii) Contribution to growth in ASEAN4's exports (U.S.) (13,594) (17.4) (47,819) (19.8) (48,835) (17.3) Machinery goods (total) Machinery final goods 20.9 (35) Total 78, , , Machinery parts and components 38.3 (65) Data source: authors' calculation, based on UN COMTRADE. Note: "Intra-East Asia" here includes China, NIES3, and Japan. Due to lack of data available from UN COMTRADE, (i) Taiwan is not included in East Asia, and (ii) data for the Philippines are not included in calculating intra-east Asian trade in 1990.
32 Table 6a Development of intra-regional exports in China Table 6b Factors of growth in Chinese intra-east Asian export (%) (Millions US$, %) (i) Growth in Chinese intra-east Asian exports ( ) All products Value Share Value Share Value Share Machinery goods (total) Machinery goods: parts and components - Machinery final goods Intra-East Asia 4, , , Machinery parts and components Others 1, , , (ii) Contribution to growth in Chinese intra-east Asian exports (U.S.) (460) (8.1) (7,018) (16.2) (12,500) (15.2) Machinery goods (total) Machinery final goods 25.7 (44) Total 5, , , Machinery parts and components 33.1 (56) Machinery goods: final goods Table 6c Factors of growth in Chinese inter-regional exports (%) Intra-East Asia 7, , , (i) Growth in Chinese inter-regional exports ( ) All products Others 2, , , Machinery goods (total) (U.S.) (872) (8.5) (23,572) (39.7) (32,841) (27.6) - Machinery final goods Machinery parts and components Total 10, , , (ii) Contribution to growth in Chinese inter-regional exports Machinery goods: total Machinery goods (total) 48.8 Intra-East Asia 11, , , Machinery final goods 33.6 (69) - Machinery parts and components 15.3 (31) Others 4, , , (U.S.) (1,332) (8.3) (30,590) (29.8) (45,340) (22.6) Table 6d Factors of growth in Chinese exports (%) (i) Growth in Chinese exports ( ) Total 15, , , All products Machinery goods (total) All products - Machinery final goods Intra-East Asia 55, , , Machinery parts and components Others 29, , , (ii) Contribution to growth in Chinese exports (U.S.) (8,599) (10.1) (70,050) (26.3) (92,626) (21.1) Machinery goods (total) Machinery final goods 30.7 (59) Total 84, , , Machinery parts and components 21.6 (41) Data source: authors' calculation, based on UN COMTRADE. Note: "Intra-East Asia" here includes ASEAN4, NIES3, and Japan. Due to lack of data available from UN COMTRADE, (i) Taiwan is not included in East Asia, and (ii) data for China in 1992 are used in calculating intra-east Asian trade in 1990.

33
34 Table 7 Sales and purchases by Japanese affiliates in East Asia Number of Year Industry affiliate s! (a) Sales 1992 Total sales (millions JPY)! By-destination sales ratio (%) Intra-firm transaction ratio (%) Japan Local Third countries Japan Local Third countries East Asia North America Europe East Asia North America Europe Manufacturing 1, ,886, Machinery ,202, , ,872, ,998, , Total 2, ,556, Manufacturing 2, ,299, Machinery 1, ,080, , ,107, ,094, , Total 4, ,578, Manufacturing 3, ,324, Machinery 1, ,485, , ,191, ,140, , Total 6, ,235, Manufacturing 4, ,382, Machinery 2, ,825, ,083, , ,538, ,575, , Total 6, ,984,
35 (Continue) Japan Local Third countries Japan Local Third countries Year Industry!! East North Asia America Europe East JPY) Asia North America Europe (b) Purchases Manufacturing 1, ,383, Machinery ,465, Number of affiliate s Total purchases (millions By-origin purchases ratio (%) Intra-firm transaction ratio (%) , ,469, , , Total 2, ,817, Manufacturing 2, ,913, Machinery 1, ,478, , ,834, ,007, , Total 4, ,558, Manufacturing 3, ,501, Machinery 1, ,764, , ,711, ,380, , Total 6, ,222, Manufacturing 4, ,780, Machinery 2, ,416, , , ,249, ,945, , Total 6, ,783, Data source: auhors' calculation, based on METI database. Note: machinery industries are genenral machinery (290), electric machinery (300), transport equipment (310), and precision machinery (320).
36 Table 8 Intra-firm and arm's length transactions by Japanese electric machinery affiliates in East Asia Japanese affiliates in East Asia Japanese affiliates in NIEs4 Japanese affiliates in ASEAN (a) Sales Value 2,872,411 5,107,148 5,191,673 8,538,606 1,705,646 2,792,722 2,161,123 3,541,688 1,082,829 1,984,190 2,234,930 3,594,633 Share (i) Japan intra-firm arm's length (ii) Local intra-firm arm's length (iii) Other East Asia intra-firm arm's length (i+ii+iii) East Asia (total) intra-firm arm's length (millions JPY, %) Japanese affiliates in China , , ,951 1,297, (b)purchases Value 1,469,212 2,834,205 3,711,079 6,249, ,256 1,454,721 1,700,051 2,652, ,155 1,156,828 1,451,967 2,602,418 Share (i) Japan intra-firm arm's length (ii) Local intra-firm arm's length (iii) Other East Asia intra-firm arm's length (i+ii+iii) East Asia (total) intra-firm arm's length Data source: author's calculation, based on METI database. 46, , , ,
37 Table 9 Intra-firm and arm's length transactions by Japanese transport equipment affiliates in East Asia Japanese affiliates in East Asia Japanese affiliates in NIEs4 Japanese affiliates in ASEAN (a) Sales Value 1,998,597 3,094,685 2,140,129 4,575, , , , , ,662 1,920, ,530 2,379,450 Share (i) Japan intra-firm arm's length (ii) Local intra-firm arm's length (iii) Other East Asia intra-firm arm's length (i+ii+iii) East Asia (total) intra-firm arm's length (b)purchases Value 789,842 2,007,679 1,380,996 2,945, , , , , ,345 1,379, ,594 1,658,388 Share (i) Japan intra-firm arm's length (ii) Local intra-firm arm's length (iii) Other East Asia intra-firm arm's length (i+ii+iii) East Asia (total) intra-firm arm's length Data source: author's calculation, based on METI database. (millions JPY, %) Japanese affiliates in China , , , , ,209 90, , ,
38