Mapping smallholder agriculture using simulated Sentinel-2 data; optimization of a Random Forest-based approach and evaluation on Madagascar site
|
|
|
- Eugenia Nicholson
- 5 years ago
- Views:
Transcription


1 Mapping smallholder agriculture using simulated Sentinel-2 data; optimization of a Random Forest-based approach and evaluation on Madagascar site Lebourgeois, V., Dupuy, S., Vintrou, E., Ameline, M., Butler, S. and Bégué, A. 37 th International Symposium on Remote Sensing of Environment, Tshwane, May 2017
2 Study area Constraints Complex landscape, fragmented Small field sizes High within plot and cultivation practices heterogeneity Cloudy conditions Synchronized agro-system and ecosystem phenologies related to rainfall etc Rainfed crops Irrigated crops Natural vegetation

 % clouds LANDSAT 8 SPOT 5")
3 Satellite data Chronogram of the acquisitions Cloud proportion 100% 80% 60% 40% 20% Growing season D01 D02 D03 D04 D05 D06 D07 D10 D12 D13 D18 D19 D20 D21 D22 D08 D09 D11 D14 D16 D17 D15 0% 0 01-Aug Sep Oct Nov Dec Jan Feb Mar Apr May Jun Jul Spatial resolution (m) % clouds LANDSAT 8 SPOT 5 PLEIADES Quicklooks

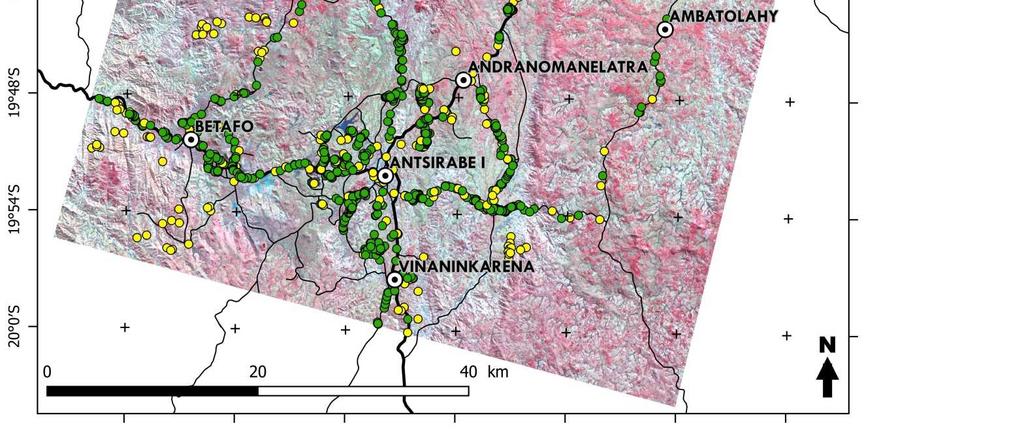
4 Ground data Localization

5 Ground data Ground polygon samples Digitized over very high spatial resolution imagery (PLEIADES 0.5 m)
6 Ground data Nomenclature (adapted from JECAM nomenclature) Level 1 Cropland Level 2 Land Cover Cereals Level 3 Crop Group 484 Leguminous 78 Oilseed crops 133 Level 4 Level 5 Crop Class Crop Subclass Maize 191 Maize 191 Oats 23 Oats 23 Rice 270 Rainfed rice 112 Irrigated rice 158 Beans 68 Beans 68 Peas 10 Peas 10 Groundnuts 53 Groundnuts 53 Soya beans 80 Soya beans 80 Other crops 19 Other crops 19 Crop 1415 Annual crop 1310 Other crops 117 Root or tuber crops 287 Grasses and other fodder crops 98 Grasses and other fodder crops Casava 62 Casava 62 Potatoes 97 Potatoes 97 Sweet potatoes 128 Sweet potatoes 128 Fruit-bearing vegetables 53 Tomatoes 53 Cabbages Vegetables and melons 211 Leafy or stem vegetables 41 Other leafy or stem vegetables 7 Non Crop 899 Root bulb or tuberous vegetables Carrots 59 Onions (incl. Shallots) 10 Taro 48 Ligneous crop 105 Fruit crops 105 Fruit crops 105 Fruit crops 105 Built-up surface 79 Built-up Surface 79 Built-up Surface 79 Built-up Surface 79 Fallows 68 Old fallows 16 Old fallows 16 Old fallows 16 Young fallows 52 Young fallows 52 Young fallows 52 Bare soils 16 Bare soils 16 Bare soils 16 Pasture 49 Pasture 49 Grassland 225 Herbaceous savannah 176 Herbaceous savannah 176 Natural spaces 677 Forest 151 Forest 151 Forest 151 Rocks 84 Rocks 84 Rocks 84 Shrub land 201 Savannah with shrubs 201 Savannah with shrubs 201 Water bodies 48 Water bodies 48 Water bodies 48 Water bodies 48 Wetland 27 Wetland 27 Wetland 27 Wetland


7 Method General approach (1) Segmentation of the whole study area into objects Irrigated rice Rainfed rice Maize Carotts Var.1 Var.2 Var.3 Var.4 (2) Feature extraction to build a Learning database (based on training samples) Var.1 Var.2 Var.3 Var.4 (3) Train Random Forest with the learning DB to obtain an optimized classifier for each nomenclature level
8 Method Experiments (1) Hierarchical vs. classical approach (with or without masking cropland) (2) Analysis of the importance of the variables to build a learning database - per source (HSR time series / VHSR / ancillary) - per type (reflectances / spectral indices / textures / ancillary) (3) Analysis of the contribution of eachsource/type to the classification accuracy


9 Method Segmentation using 0.5m PLEIADES imagery More than 6 million objects for the whole 60*60 km study area
10 Method Feature extraction HSR time series VHSR - PLEIADES Réflectances Green Red NIR SWIR 168 Blue Green Red NIR Panchro 10 Indices NDVI NDWI 105 Mean MNDWI Mean Brightness Mean NDVI Brightness Mean v 3 Textures Panchro+NIR Correlation Windows sizes : 5*5 / 9*9 / 17*17 / 21*21 / 35*35 Contraste Windows sizes : 5*5 / 9*9 / 17*17 / 21*21 / 35*35 Dissimilarity Windows v 50 sizes : 5*5 / 9*9 / 17*17 / 21*21 / 35*35 Entropy Windows sizes : 5*5 / 9*9 / 17*17 / 21*21 / 35*35 Variance Windows sizes : 5*5 / 9*9 / 17*17 / 21*21 / 35*35 Ancillary Altitude Pente Surface 5 Surface = 341 v satellite variables
11 + - Variables Method Optimized Random Forest classifiers SLOPE_M D16S_MIR_M D09S_MIR_M D16S_MND_M D09S_NDW_M D17S_MND_M D16S_NDV_M D22L_NDV_M D03L_ROU_M D03L_NDV_M MNT_S D22L_ROU_M D15P_NDV_M D13L_MND_M D09S_MND_M D03L_VER_M D15P_BLE_M D11S_MIR_M D11S_NDW_M Permutation Importance Measure 94 variables Level 1 Crop/ Non Crop
12 Results Optimization Crop Non Crop Crop Non Crop Crop Non Crop Crop Non Crop Cropland (level 1) Land Cover (level 2) Crop Group (level 3) Crop Class (level 4) Crop Subclass (level 5) The number of features to be extracted can be reduced from 1.5- to 6-fold
13 Results Classical vs. hierarchical approach Difference in class f-score between hierarchic and classic approaches at Sub Class level (Level 5)
14 Results Classifications accuracy using the hierarchical approach Cropland (level 1) Land Cover (level 2) Crop Group (level 3) Crop Class (level 4) Crop Subclass (level 5) Crop Non Crop Crop Non Crop Crop Non Crop Crop Non Crop Overall Accuracy 91.7% 96.6% 90.7% 70.2% 83.2% 64.1% 81.3% 64.4% 80.2% Kappa The overall accuracy and Cohen s Kappa obtained via the hierarchical approach for each level of the JECAM nomenclature
15 Results In detail.f-scores for each class and level of the nomenclature Level 1 Cropland Crop 0.93 Non Crop 0.89 Level 2 Land Cover Annual crop 0.98 (0.067) Cereals 0.79 (0.065) Leguminous 0.40 (0.067) Oilseed crops 0.61 (0.015) Other crops 0.69 (0.036) Root or tuber crops Level 3 Crop Group Vegetables and melons 0.66 (0.061) 0.57 (-0.001) Level 4 Level 5 Crop Class Crop Subclass Maize 0.63 (0.010) Maize 0.61 (0.006) Oats 0.79 (0.104) Oats 0.67 (0.123) Rice Rainfed rice 0.65 (0.040) 0.78 (0.054) Irrigated rice 0.82 (0.015) Beans 0.56 (-0.008) Beans 0.54 (-0.027) Peas Peas Groundnuts 0.51 (-0.046) Groundnuts 0.55 (0.023) Soya beans 0.67 (-0.026) Soya beans 0.69 (0.025) Other crops Other crops Grasses and Grasses and 0.76 (0.027) other fodder crops other fodder crops 0.73 (0.048) Casava 0.48 (-0.030) Casava 0.49 (-0.009) Potatoes 0.57 (0.030) Potatoes 0.57 (0.015) Sweet potatoes 0.52 (-0.033) Sweet potatoes 0.49 (0.029) Fruit-bearing vegetables 0.58 (-0.017) Tomatoes 0.64 (-0.009) Leafy or stem vegetables Root bulb or tuberous vegetables 0.44 (-0.024) 0.44 (-0.016) Cabbages 0.51 (-0.111) Other leafy or stem vegetables Carrots 0.39 (-0.018) Onions (incl. Shallots) Taro 0.26 (-0.017) Ligneous crop 0.71 (0.065) Fruit crops 0.82 (0.051) Fruit crops 0.78 (0.019) Fruit crops 0.74 (0.057) Built-up surface 0.83 (0.031) Built-up Surface 0.91 (0.004) Built-up Surface 0.88 (0.044) Built-up Surface 0.86 (0.037) Fallows Old fallows Old fallows Old fallows 0.48 (0.146) Young fallows 0.54 (0.147) Young fallows 0.63 (0.086) Young fallows 0.53 (0.038) Bare soils Bare soils Bare soils Pasture 0.61 (-0.019) Pasture 0.64 (-0.048) Grassland 0.85 (0.042) Herbaceous savannah 0.82 (0.043) Herbaceous savannah 0.76 (0.048) Natural spaces 0.94 (0.063) Forest 0.77 (0.073) Forest 0.77 (0.076) Forest 0.70 (0.054) Rocks 0.87 (-0.005) Rocks 0.87 (0.016) Rocks 0.85 (0.025) Shrub land 0.84 (0.033) Savannah with shrubs 0.84 (0.049) Savannah with shrubs 0.80 (0.026) Water bodies 0.92 (0.037) Water bodies 0.91 (0.030) Water bodies 0.92 (0.042) Water bodies 0.87 (0.030) Wetland 0.81 (0.142) Wetland 0.82 (0.133) Wetland 0.79 (0.077) Wetland 0.70 (0.094)

 for each level of the")
16 Results PER SOURCE Analysis of variable importance PER TYPE Proportions of different sources/types of variables among the 30 most important variables (ranked by MDA measure) for each level of the nomenclature
17 Results Contribution of each type/source of data to the accuracy HSR Auxilary VHSR ALL Reflectances Indices Auxilary Reflectances Indices Textures Dataset 1 Reflectances Indices Auxilary Reflectances Indices Dataset 2 Reflectances Indices Auxilary Dataset 3 Reflectances Indices Dataset 4 Reflectances Dataset 5 Indices Dataset 6 Auxilary Reflectances Indices Textures Dataset 7 Reflectances Indices Textures Kappa All Dataset 1 Dataset 2 Dataset 3 Dataset 4 Dataset 5 Dataset 6 Dataset 7 Cropland Land Cover Crop Group Crop Class Sub Class Crop Crop Crop Crop Non Crop Non Crop Non Crop Non Crop
 25 classes OA : 65% K : 0.")
18 Results Maps Level 1 (Cropland) 2 classes OA : 92% K : 0.82 Level 5 (Crop Subclass) 25 classes OA : 65% K : 0.61
19 Conclusions Relevance of the approach Optimization: gain in time computation for feature extraction Advantage of hierarchical approach over classical one Good classification accuracies for Cropland and Land Cover Difficulties remain for discriminating crop classes (especially rainfed crops!) Recommendations VHSR variables (including textures) are not discriminant in our case Temporal information is more important, even with a lower spatial resolution (and mixed pixels!) What s next? Adding phenological variables Using Sentinel-2 data and testing the potential of high revisit frequency and new spectral bands (red-edge) for crop class discrimination


20 Sen2Agri (UCL project funded by ESA) Demonstration phase in Madagascar Study area: 300*300km (9 Sentinel-2 tiles) Application of the Sen2Agri processing chain for mapping cropland and the main crop types at pixel level from S2 an L8 data OA = 64.9% Kappa = 52.2%
 Production forecast / yield anomalies Temporal")

21 Sen2Agri (UCL project funded by ESA) Applications Agricultural Statistics (irrigated and rainfed cropland) Production forecast / yield anomalies Temporal evolution of rainfed rice surfaces Land use planning Map of suitable land for agriculture Restitution of the Sen2Agri mid season map products in Antananarivo, March 2017