Impact of Agricultural Production on Climate Change
|
|
|
- Bethanie Floyd
- 5 years ago
- Views:
Transcription

1 Impact of Agricultural Production on Climate Change Aaron J. Glenn Research Scientist - Micrometeorology Brandon Research & Development Centre March 22, 2017
2 What is micrometeorology? A part of meteorology that deals with observations and processes in the smallest scales of time and space, approximately smaller than 1 km and less than a day (i.e., local processes) (AMS Glossary of Meteorology). Microscale meteorology is the study of short-lived atmospheric phenomena smaller than mesoscale, about 1 km or less (wikipedia). Studies take place in the bottom of the atmospheric boundary layer or the surface layer. Exchange processes of energy, gases, etc., between the atmosphere and the surface (water, land, plants) are important topics. 2
3 What kind of research do you do? Influence of the atmosphere on agricultural activities: Traditional agricultural meteorology Climate and global change phenomenon Microclimate modification Influence of agricultural activities on the atmosphere: Energy Balance: Surface albedo Partitioning between sensible and latent heat flux Air Quality: GHG exchange between cropland and lower atmosphere NH 3 volatilization, dust and particulate matter emissions 3

4 Global Energy Balance Intergovernmental Panel on Climate Change,
 Nitrous oxide (N 2 O) Ozone (O 3 ) Various fluorinated gases IPCC, 2001")
5 Greenhouse Gases Water vapour (H 2 O) Carbon dioxide (CO 2 ) Methane (CH 4 ) Nitrous oxide (N 2 O) Ozone (O 3 ) Various fluorinated gases IPCC,
6 Impact of Agricultural Production on Climate Change Salinger,
7 Impact of Agricultural Production on Climate Change 7

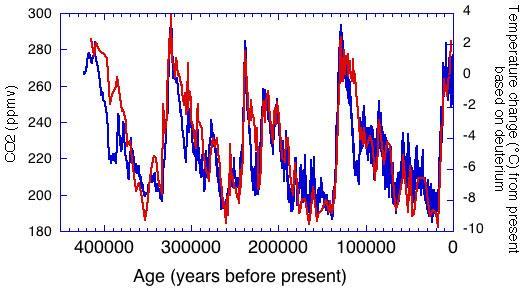
8 Global Climate Change 8

9 Global Climate Change World Meteorological Organization,
10 Local Climate Change Significance of annual and seasonal temperature increases at Brandon Research & Development Centre from 1895 to 2008 Minimum Maximum Mean Annual Winter Spring + NS + Summer + NS + Fall + NS NS + indicates significant trends, NS indicates non-significance Data are from the Environment Canada Adjusted and Homogenized Canadian Climate Database 10
11 Local Climate Change A climate change scenario* for field site near Kenton, Manitoba * * Air Temperature ( C) Precipitation (mm) GS Precipitation (mm) Frost-free period (days) GDD > 5 C Reference ET (mm) Moisture Deficit (mm) *Canadian Centre for Climate Modelling and Analysis (CCCma), AR4, Coupled Global Climate Model, generated using Climate WNA v

12 Global Carbon Cycle Wikipedia.org 12

13 Global Nitrogen Cycle PhysicalGeography.net 13

14 Agriculture and GHG Inventories Contribution of Agriculture to GHG inventories: Canada 8% Manitoba 30% 14

15 Agriculture and GHG Inventories 15
16 Agriculture and GHG Inventories Contributions of individual trace gases to agricultural GHG inventories: CO 2 0-1% - Balance between photosynthesis and respiration (soil and plant) minus harvest C 16

17 Agriculture and GHG Inventories Brady and Weil,

18 Agriculture and GHG Inventories Baker et al.,
19 Agriculture and GHG Inventories Contributions of individual trace gases to agricultural GHG inventories: CH 4 50% - Ruminant enteric fermentation (cow burps), manure handling and storage (anaerobic decomposition) 19
20 Agriculture and GHG Inventories Contributions of individual trace gases to agricultural GHG inventories: CH 4 50% - During beef production in western Canada: 80% GHG cow-calf herd (84% enteric CH 4 ), 20% feedlot 20

21 Agriculture and GHG Inventories Contributions of individual trace gases to agricultural GHG inventories: N 2 O 50% - Nitrification and denitrification, function of N input to soil 21
22 Agriculture and GHG Inventories Contributions of individual trace gases to agricultural GHG inventories: N 2 O 50% - Nitrification and denitrification, function of N input to soil NO NR 2NO NiR 2NO NOR N O NOS N (+5) (+3) (+2) (+1) (0) 22
23 Agriculture and GHG Inventories GHG emissions from agricultural activities can be seen as an inefficient use of resources (soil resources, direct and indirect non-renewable energy-use) Poor management of soil organic matter Direct Energy: 20% direct fossil fuel combustion on farm Indirect Energy: 40-50% manufacture and transportation of N fertilizer N is removed from the system in grain and oilseed, needs replacement to maintain productivity Agroecosystems are intensively managed...for better or for worse 23
24 Case Study: Carbon Balance of Cropland Has cropland in southern Manitoba reached a steady-state in terms of net C balance? Can we deliberately affect the cropland C balance through improved organic matter management and can we detect the impact in the short term? 24

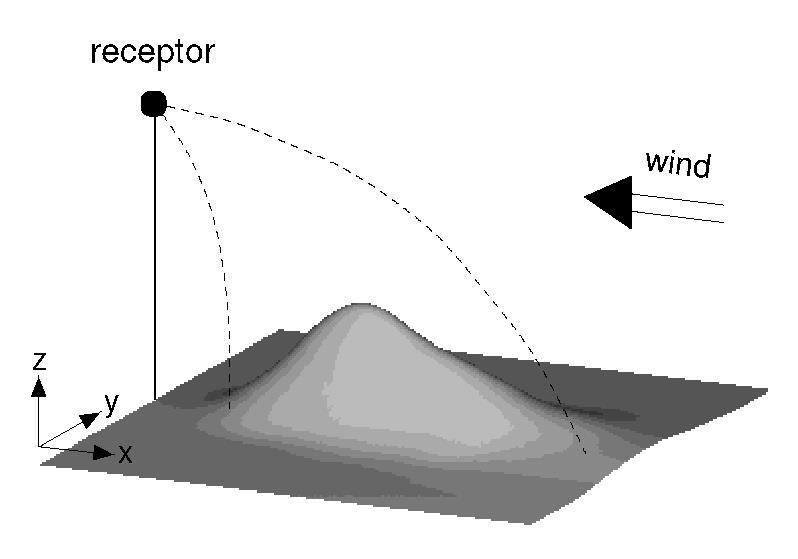
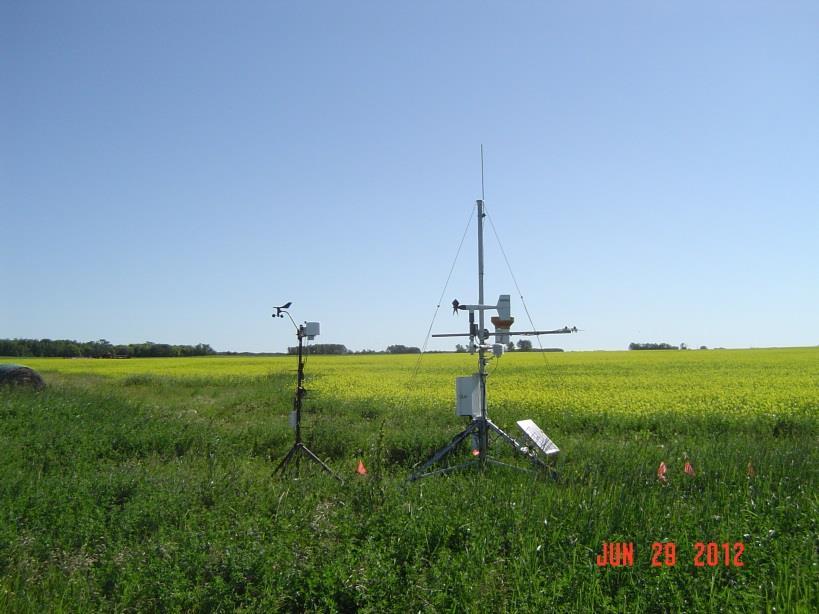
25 Kljun
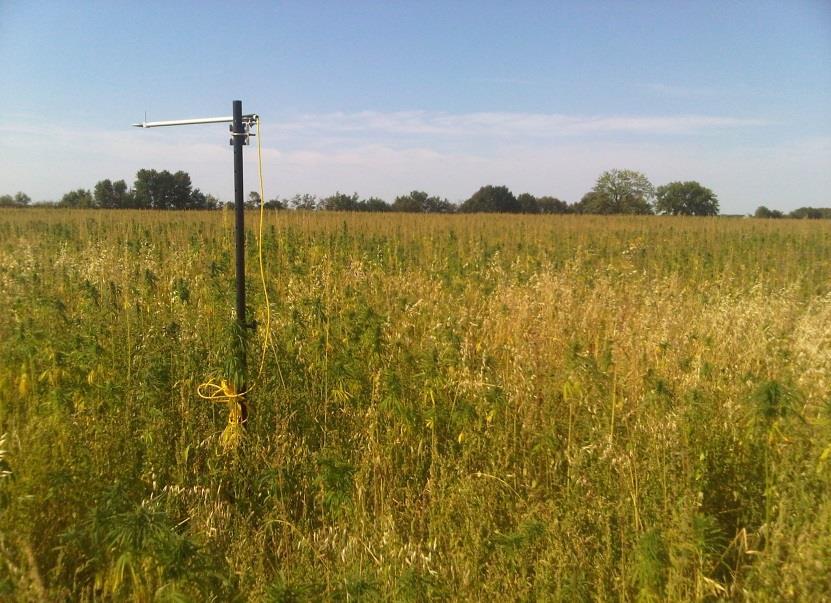
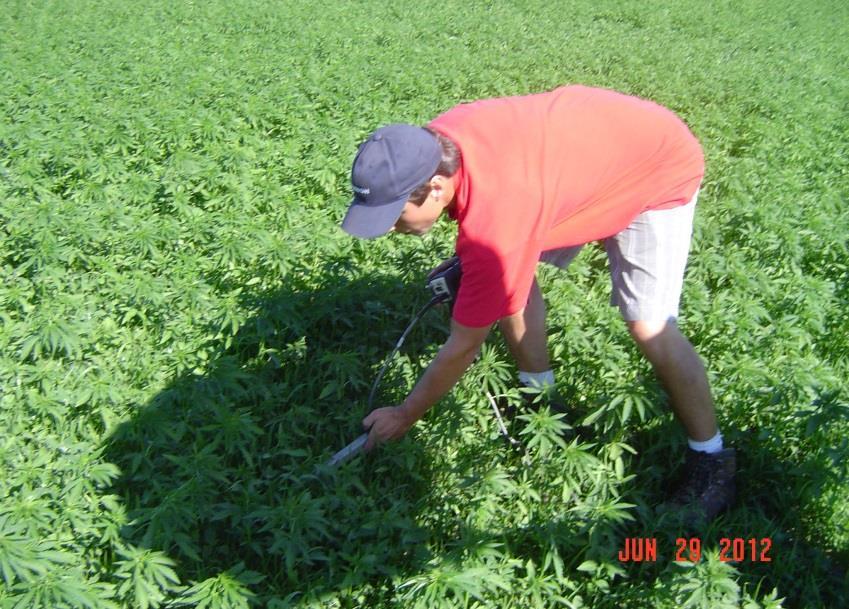
26 Case Study: Carbon Balance of Cropland Compost Barley-Peas Hemp C source C sink 26
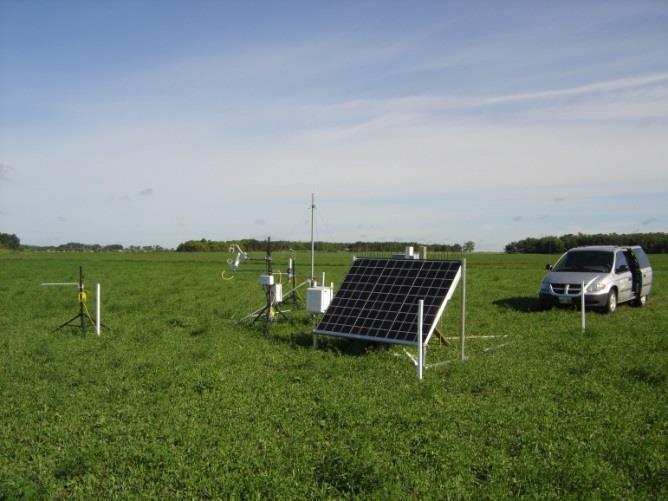
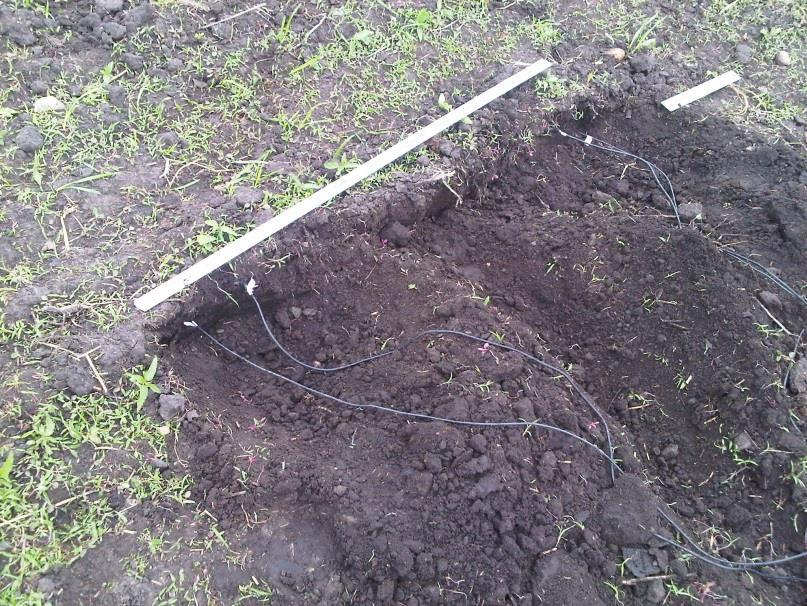
27 Case Study: Carbon Balance of Cropland 27
28 Case Study: Carbon Balance of Cropland kg C ha -1 Hemp Barley-Peas Gross Primary Production 7,400 5,100 Ecosystem Respiration 7,100 4,700 Net Ecosystem Production Compost Application 1,250 N/A Harvested Biomass Net Cropland Carbon Balance
29 Improved Management of the Carbon Cycle Compost & manure application with improved distribution to offset crop C removal More organic production, ~50% less energy-use emissions Include 3-5 year perennial stands in annual rotations More biomass production belowground and longer growing season Decrease in non-renewable energy use Graze in situ for maximum benefits Reforestation and restoration of wetlands Re-plant and plant more shelterbelts Agroforestry and sustainable woodlot management 29
 More research on organic matter mineralization Variable rate application to match topography and soil zones Inclusion of green manures & cover crops in")
30 Improved Management of the Nitrogen Cycle Slow-release N sources that match crop demand (compost, manures, legume crops and residues, enhanced efficiency fertilizers) More research on organic matter mineralization Variable rate application to match topography and soil zones Inclusion of green manures & cover crops in rotation 30

31