The impact of rising costs on agriculture in South Africa
|
|
|
- Bonnie Hutchinson
- 5 years ago
- Views:
Transcription
1 The impact of rising costs on agriculture in South Africa John Purchase Undercover Farming Expo 6 March 2013
2 Global demographics Source: Absa
3


4
5 Supermarket phenomenon Retailers, the Giants of the Chains, and Powerful - Wal-Mart sold 337 billion worth of food from 8400 stores in 15 countries in Carrefour & Tesco next. - Concentration (Top 20) down from 23,4% (2003) to 21% (2010) - Private versus retailers labels/brands - Neighbourhood concept: proximity & convenience - Powerful: Information about consumers - Supply chains incredibly important: Internationalisation - Move to Green Economy, Fair Trade, Smallholder procurement, increased convenience, tasting areas, etc. - Shopping experience: Lock-in customers Source: Marcos Fava Neves
6 BRICS to drive Modern Retail growth Forecast Rank Country bn Rank Country bn Rank Country bn 1 US US China China China US Japan Japan India France India Japan India France Russia UK Russia Brazil Germany Brazil France Italy UK UK Russia Germany Germany Mexico Italy Indonesia 167 2,326 2,827 3,681 Note: 2014F is calculated using fixed exchange rates based on the average rates of 2009 from to ). Source: IGD Research, December 2009


7 Global resources: Arable land Source: Absa
8 Rising Land Prices Make Land in Some Land rental prices for 3 t/ha oilseeds, 2009 Countries Attractive 500 Index of land prices (1980=100) USA (Iowa) Argentina Rent ($/ha) Uruguay Iowa Brazil (MG) Ukraine Mozambique Nonmarket
9 Suitable Land for Expansion but Concentrated in a Few Countries Sudan, C ongo,, Mozam Madag, Zambia FAO potential of 2.7 M ha More realistic is 450 M ha Based on land that is not forested or protected 400 Brazil, Argen Russia 300 Potential additional area Current area Austr SS Africa Latin America E. Europe & CA E and S Asia MENA Australia Rest of world Source: World Bank and IIASA


10 Regions with Land Scarcity also face Water Scarcity Percent of population facing absolute water scarcity Series Source: IWMI


11 Energy ESKOM Electricity Price increases April 2008: 27,5% April 2009: 31,3% April 2010: 24,8% April 2011: 25,8% April 2012: 25,8% April : 8% pa granted for 5 years On-farm electricity generation?
12 Fuel prices Price trends for Crude oil and fuel from December 2006 to December 2012: Crude oil: 74.5 % increase Petrol: % increase Diesel: % increase Price trends for Crude oil and fuel from December 2011 to December 2012: Crude oil: 0.3 % increase Petrol: 12.7 % increase Diesel: 8.6 % increase Crude oil (US$ $/barrel) Dec-06 Apr-07 Aug-07 Dec-07 Apr-08 Aug-08 Dec-08 Apr-09 Source: NAMC, 2013 Crude oil Petrol 95 ULP Gauteng Diesel 0.05% S Gauteng Aug-09 Dec-09 Apr-10 Aug-10 Dec-10 Apr-11 Aug-11 Dec-11 Apr-12 Aug-12 Dec Fuel price (R/litr re)
13 International price trends for selected fertilisers Price trends for international fertilisers and R/$ exchange rate from December 2006 to December 2012: Urea: 94.1 % increase DAP: % increase MOP: % increase R/$: 23.7 % depreciation Price trends for international fertilisers and R/$ exchange rate from December 2011 to December 2012: Urea: 8.3 % increase DAP: 13.7 % decrease MOP: 0.1 % increase R/$: 5.7 % depreciation Jan 2005 = 100 Fertilizer index Urea Di-Ammonium Phosphate (DAP) Muriate of Potash (MOP) Dec Mar- Jun-07 Sep Dec Mar- Jun-08 Sep Dec Mar- Jun-09 Sep Dec Mar- Jun-10 Sep Dec Mar- Jun-11 Sep Dec Mar- Jun-12 Sep Dec n 2005 = 100 R/$ index Ja Source: NAMC, 2013
14 Local price trends for selected fertilisers Price trends for international fertilisers and R/$ exchange rate from December 2006 to December 2012: Urea: 94.1 % increase DAP: % increase MOP: % increase R/$: 23.7 % depreciation Price trends for international fertilisers and R/$ exchange rate from December 2011 to December 2012: Urea: 8.3 % increase DAP: 13.7 % decrease MOP: 0.1 % increase R/$: 5.7 % depreciation = 100 Index January De MAP Urea Potassium Chloride Apr Au De Apr Au De Apr Au De Apr Au De Apr Au De Apr Au De Source: NAMC, 2013
15 Vehicle costs over time for different sized vehicles Vehicle costs trends from 2004 to 2012: Rand axle vehicle Capitol cost: 18.4 % increase Fixed cost: 37.8 % increase Running cost: % increase 6-axle vehicle Capitol cost: 38.3 % increase Fixed cost: 53.3 % increase Running cost: 133 % increase 7-axle vehicle Capitol cost: 40.4 % increase Fixed cost: 57.5 % increase Rand Rand Capital Cost Fixed Cost Running Cost Capital Cost Fixed Cost Running Cost Capital Cost Fixed Cost Running Cost Running cost: % increase Source: Max Braun Consulting Services, 2013
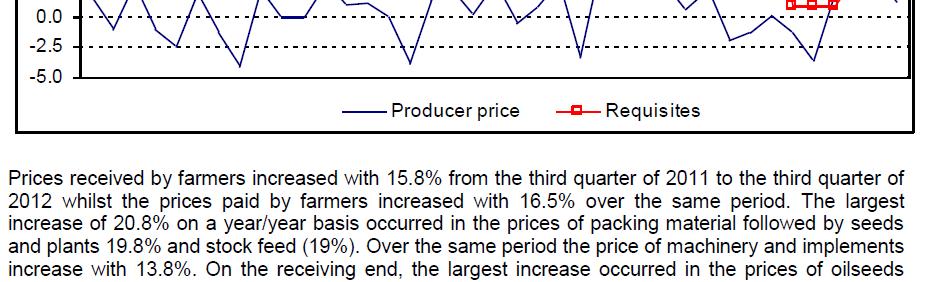
16 Selected input prices: 3 rd Quarter 2012 vs3 rd Quarter 2011 Source: AMT

17 Impact of minimum wage on total wage bill With the same number of workers, ag wage bill increases by approx. R2 billion Difficult to calculate exact job losses given various scenarios on productivity gains etc. that still need to be analysed but only on top ten industries an estimated loss of jobs could be plausible

18 Source: AMT Cost curve
19 SA Food inflation expected to be 9,0% in 2013 (MTBPS, 2012) Source: AMT

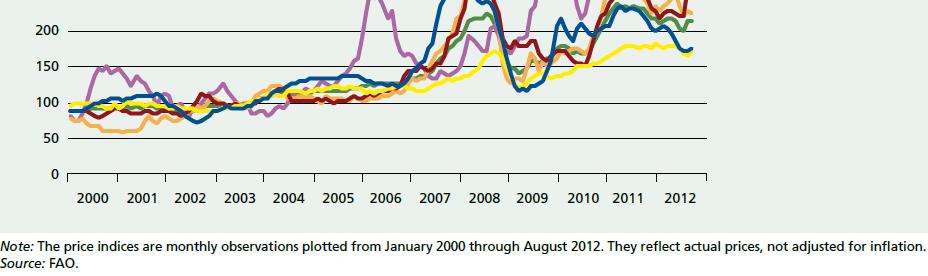
20 FAO Food Price Index
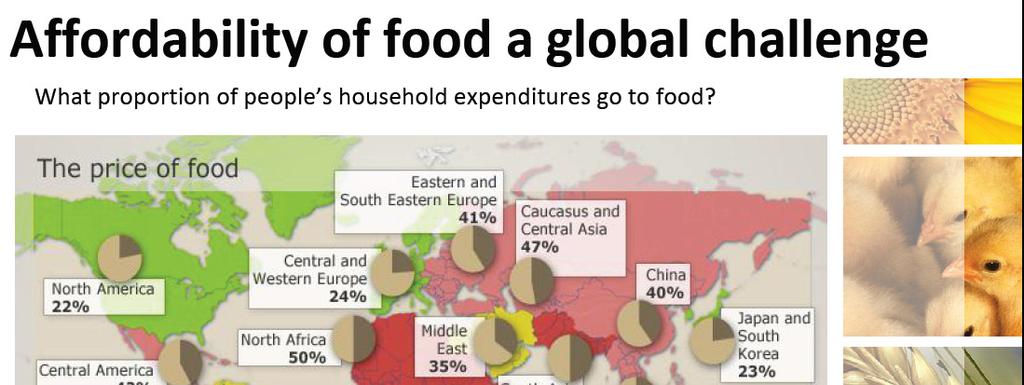
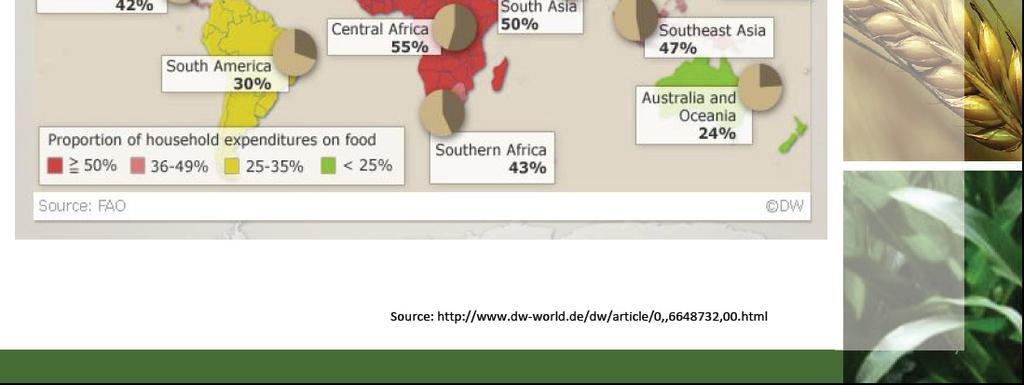
21 Food Security Imperative Many definitions to food security, but the one we will use is the FAO definition (World Food Summit 1996): A situation that exists when all people, at all times, have physical and economic access to sufficient, safe and nutritious food to meet their dietary needs and food preferences for an active and healthy life.
22 Components of Food Security FOOD UTILISATION Nutritional Value Social value Food safety FOOD ACCESS Affordability Allocation Preference Purchasing power key to access Food Security FOOD AVAILABILITY Production Distribution Exchange/trade Stability over TIME Complex concept: Difficult to measure and evaluate.
23
24 Conclusion Huge global food demand driving demand for scarcer resources - driving resource/input prices up Our sustainability challenge: Produce more with less Technology/innovation critical to overcome cost-price squeeze and improve productivity Need to critically rethink our agriculture, viz. renewable energy; proximity to markets (logistics); water and nitrogen use efficiency; precision, conservation and undercover agriculture, etc.