Dietary Grouping Strategies to Improve Profitability on Dairy Farms!
|
|
|
- Whitney Ward
- 5 years ago
- Views:
Transcription


1 XIX Congreso ANEMBE Oviedo, June 2014, Oviedo, Spain! Improving cost-efficiency and profitability! Dietary Grouping Strategies to Improve Profitability on Dairy Farms! V.E. Cabrera & A. Kalantari! University of Wisconsin-Madison Dairy Science!
2 Considering nutritional grouping! Take home messages! Opportunity to improve economic efficiency! Considering additional nutritional groups! Diets closer to requirements! Saves feed costs and increases income over feed costs! Improved profitability! IOFC gains far exceed additional expenses or losses! Additional benefits! environmental concerns! health conditions!
 to all cows (groups)!")

3 Feeding all lactating cows equally! A larger number of cows are overfed! Same ration (TMR) to all cows (groups)! All lactating cows receive same nutrient density diet! Preferred high rations! Low producing animals receive more nutrients than required! One diet for all! Would never optimize production and efficiency! VandeHaar, 2011!


4 Improve feed efficiency! + feeding groups! Improved nutrient use efficiency! Diet closer to cow requirements! Less nutrient excretion! Decreased environmental concerns! Wang et al., 2000! Less overfed animals! Decreased over conditioned cows! Lower feeding costs! Higher milk income over feed cost!
! 196 WI farms! Constraints to feeding more ration groups! 1. Milk drops when cows are moved!")

5 Why farmers do not group more?! Trying to find most important constraints! 2-page mailed survey! Results (responses)! 196 WI farms! Constraints to feeding more ration groups! 1. Milk drops when cows are moved! 2. Desire to keep management simple! 3. Conflicts with grouping for reproduction! 4. Farm facilities do not allow it! 5. Not enough labor or personnel to handle it! 211 MI farms! Contreras-Govea et al., 2013!

6 A simulation study...!

7 Strategies for grouping cows! Depend on farm and herd characteristics! Individual cow nutrient requirements! Energy! Protein (RUP, RDP, MP)! Farm characteristics! Capacity to handle lactating feeding groups! Number of lactating cows on the herd! States! Adapted from McGilliard et al., 1983; St-Pierre and Thraen, 1999!
8 Milk (and components)! Cow-specific lactation curves! Milk based on! Herd ME305! Cow PPA or ME305! Stochasticity! Components! Herd! Stochasticity! Base function! Woods! Adjusted Woods! De Vries, 2001! Component, kg! Milk, kg! 1.80! 1.62! 1.44! 1.26! 1.08! 50! 43! 36! 29! 22! Lact 1! Lact 2! 15! 0! 61! 122! 183! 244! 305! 2 nd lactation Fat! Protein! 0.90! 0! 61! 122! 183! 244! 305! Days after calving!


9 Initial individual cow BW! Cow-specific BW! Daily BW and BCS change according to:! Lactation! DIM! Stochasticity! 1. Available from farm records, or! 2. Stochastic distribution! Body weight, kg! 625! 610! 595! 580! 565! Lactation > 1 Mean=600 kg! 550! 0! 200! 400! 600! 800! Days after calving!
CM and BW! Cluster!")
CM! C P NEl McGilliard et al., 1983!")
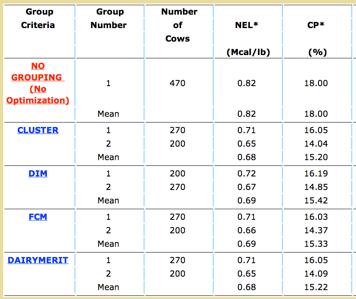
10 Criteria for nutritional grouping! Several criteria exist! Days after calving (DIM)! Based on stage of lactation! Dairy merit! Function of both F(P)CM and BW! Cluster! Seems to be MOST efficient criterion! Fat (protein) corrected milk! Based on level of production measured as F(P)CM! C P NEl McGilliard et al., 1983! St-Pierre and Thraen, 1999!
!")

11 Nutritional grouping! Two main types of groups! Obligated groups! Fresh (< 22 DIM)! Dry (~> 220 DCC)! Daily assigned! Optional groups! Actual additional groups! Daily assigned! Monthly re-grouped!
12 Cow and herd simulation! Monte Carlo approach! Next event scheduling! Pregnancy! Abortion! Dry-off! Parturition! Involuntary culling! Death! Immediate replacement! After a cow leaves the herd! Two-step! 1. Binary outcome of event:! Happens or not! E.g., uniform distribution!! 2. DIM of the occurrence! When it happens! E.g., Weibull distribution! Replicates! 1,000 replicates for each cow within specific herd!
13 Cow simulation! Follows actual COW card! Variable!Unit! Cow ID! #! Description! Cow identification! Parity! #! Lactation! DIM! d! Days in milk, days after calving! DCC! d! Days in pregnancy (DIP)! Fat! %! Fat component on milk! Protein! %! Protein component on milk (%)! PPA*! %! Predicted producing ability! ME 305*!kg/305 d! Mature equivalent milk production! BW! kg! Live body weight! *Either PPA or ME305 used to assess cow s milk class. PPA preferred if available
14 Studied herds! All data collected at the cow-level! Herd (size)! 570! 787! 727! 331! 1460! Herd ME 305, kg! 16,140! 12,884! 13,897! 13,348! 14,188! 1 st lactation, %! 43! 39! 39! 38! 45! Average DIM! 187! 178! 201! 208! 189! 21-d PR, %! 18! 19! 19! 17! 18! Culling risk, %! 32! 37! 36! 35! 40! Abortion, %! 7! 11! 11! 16! 7! BW available!!!!!!


15 ...And we are finding!
16 Herd 787, nutritional diets! Months after starting simulation
17 Cow 6338(727) = 78% milk, 1 yr! 3rd Lactation BW Milk DMI -$23 milk, -$200 feed, +$177 IOFC Group-pen availability State of cow -846 Mcal -137 kg CP
18 Cow10020(727) = 92% milk, 1 yr! 1st Lactation Milk BW DMI -$18 milk, -$43 feed, +$25 IOFC -165 Mcal -32 kg CP
19 Economic efficiency! +$43 +$53 +$61 +$66 +$22 +$47 +$57 +$66 +$70 +$20 +$55 +$63 +$73 +$45 +$19
20 Energy efficiency! +0.69% +0.75% +0.73% +0.63% +0.38% +1.02% +0.93% +0.96% +0.58% +0.26%
21 Nitrogen efficiency! +0.84% +0.91% +0.93% +0.69% +0.75% +0.71% +0.94% +0.41% +0.61% +0.25%

22 Impact of milk depression! 9.1 kg Δgroup -0.10% -0.13% -0.07% -0.06% -$ % -$21 -$23 -$19 -$16 Herd 787


23 Decision support tool!

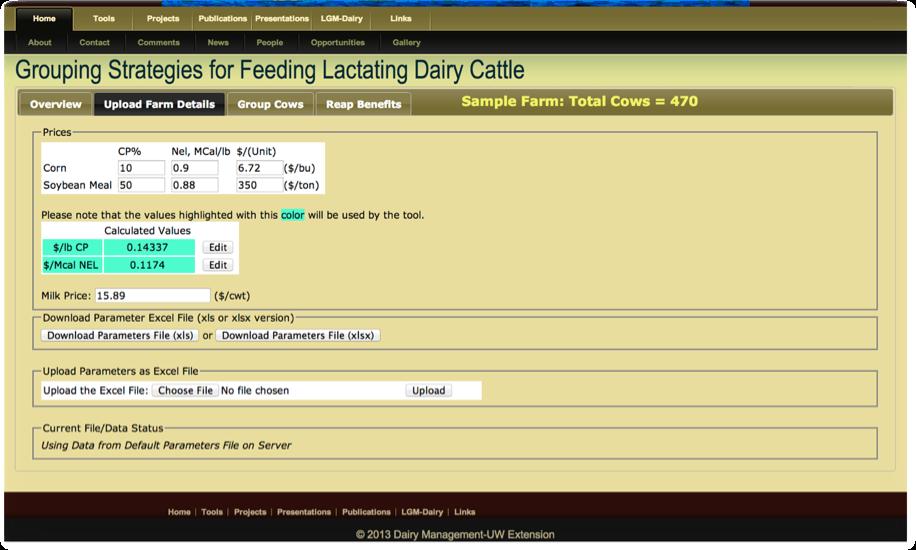
24 A simplified online tool! Herd-specific assessments (DairyMGT.info)!


25 Additional costs and benefits! Impacts grouping feeding strategies! Management cost! Additional labor! Extra management! Avoid costs! Additives and supplements savings! Milk depression! Cow social interactions!
26 Grouping Strategies! Farm/herd possibilities and decision-making! Current Groups NO How many can? Current diet Group sizes Added Cost & Benefits YES How many does? How many can? Current diet Group sizes Added Cost & Benefits


27 Tool demonstration!

28 Online simulator!
29 Anatomy of Grouping Strategies for Feeding Lactating Dairy Cattle

30 Navigation tabs No. cows Nutrient price Milk price Herd Farm Data Identification! Lactation! Days in milk! Milk butterfat! Milk protein! Body weight!
31 Grouping Illustration! Economic impact of nutritional grouping! Current Situation! Lactating Cows!! Current Groups!! NEL! Mcal/lb! 470! None! 0.80! CP, %! 17! Possible Situation! Groups! 3! Group Sizes! Milk loss! Added Costs! Saved costs! 100, 100, 270! 2.27 kg/d x 4 d! $1,000/month! None!
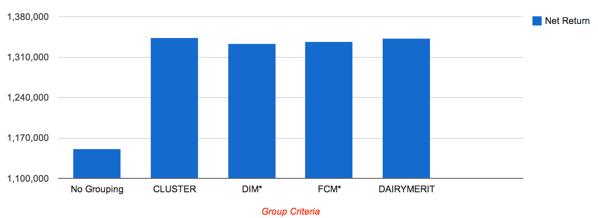
32 Decision Support System Illustration! Cluster grouping criteria! Current Situation!! Group! Cows! NEL! CP! IOFC! #! Mcal/lb! %! $/cow.d! All! 470! 0.80! 17.00! 6.9! $1,189! $1,336! Annual value of grouping $135,000/herd Possible Situation!! Group! Cows! NEL! CP! IOFC! #! Mcal/lb! %! $/cow.d! 1! 100! 0.62! 13.07! 4.7! 2! 100! 0.65! 14.18! 7.2! 3! 270! 0.71! 16.05! 9.3! All! 470! 0.68! 15.02! 7.9!


33 Wisconsin herds analysis!

34 Analysis from dairy farm records! 30 Wisconsin dairy farms! No grouping vs. 3 groups! Same size groups! Grouping criterion! Cluster! Same prices for all! $0.35/kg milk! $0.315/kg CP! $0.1174/Mcal NEl! Projected body weight! 500 kg primiparous! 600 kg multiparous!
35 Analysis from dairy farm records! 30 Wisconsin dairy farms! Lactating cows (n=30)! No grouping! 3 Groups! Gain! Income Over Feed Cost! $/cow.yr! Minimum! <200! 697! 1,059! 161! Mean! 788! 2,311! 2,707! 396! Maximum! >1,000! 2,967! 3,285! 580! Increase of IOFC ($/cow per year)! Between 7 and 52%! Mean = $396! Range = $161 to $580!

36 Acknowledgements! This project is supported by Agriculture and Food Research Initiative Competitive Grant No from the USDA National Institute of Food and Agriculture!


37 Thanks! 2011 Wisconsin Milk Marketing Board, Inc.!