Report On the vegetables production and processing
|
|
|
- Rosaline Houston
- 5 years ago
- Views:
Transcription


1 Report On the vegetables production and processing in Armavir, Aragatsotn, Lori, Shirak and Tavush marzes of Armenia Prepared by Sergey Matevosyan 1 P a g e Yerevan, 2011
2 Contents BACKGROUND... 3 GEOGRAPHY AND SOILS OVERVIEW... 8 ARMENIAN LAND PRIVATIZATION AGRICULTURAL SECTOR CONSTRAINTS AND OPPRTUNITIES FOR ARMENIAN AGRICULTURE VEGETABLE PRODUCTION VEGETABLE PRODUCTION (HA/TON) IN ARAGATSOTN, ARMAVIR, SHIRAK, LORI AND TAVUSH MARZES DOMESTIC PROCESSORS: SCALE, PRODUCT VARIETY, VOLUMES AND CAPACITY, INCLUDING ASSESSMENT OF PRODUCTION CAPACITY, USED EQUIPMENT AND TECHNOLOGY POTENTIAL OF EACH MARZ IN TERMS OF UTILIZATION OF SELECTED GROUPS OF FRESH VEGETABLES AVAILABLE SEEDS, PRICES AND SOURCES OF SUPPLY CULTIVATION PROCESS (IRRIGATION, FERTILIZATION ETC.) OF VEGETABLES, COST ANALYSIS, HARVEST PERIODS FOR SELECTED GROUPS OF VEGETABLES COST ANALYSIS FOR SELECTED GROUPS OF PROCESSED VEGETABLES THROUGH A UNIFIED METHODOLOGY FOR COST CALCULATION FRESH VEGETABLES PROCUREMENT MECHANISMS EXISTING (INCLUDING PRICE TENDENCY, LOGISTICS AND ETC) MAIN PRODUCERS AND IMPORTERS AND MAJOR LOCAL AND FOREIGN BRANDS OF PROCESSED VEGETABLES IN THE MARKET, PRESENCE AND PRICING COMPARATIVE ANALYSIS OF STRENGTHS & WEAKNESSES OF IDENTIFIED PROCESSORS IN THE LOCAL MARKET ANALYSIS OF RISK FACTORS OF VEGETABLE PROCESSING INDUSTRY CERTIFICATION NEEDS HINDERING EXPORTING OPPORTUNITIES FOR VEGETABLE PROCESSING COMPANIES P a g e
3 Background Тhe Fund for Rural Economic Development in Armenia (FREDA), established in the framework of the Rural finance component of the Farmer Market Access Program in Armenia, assigned this assessment on the vegetables production and processing sector in Armavir, Aragatsotn, Lori, Shirak and Tavush marzes of Armenia to the Team of consultants with Sergey Matevosyan as the Team Leader. To stimulate economic growth and to impact development of rural smallholder farmers and rural small and medium size enterprises the Fund/ Rural finance component is engaged/interested in providing of innovative financial services to Armenian farmers. To increase FREDA s opportunities to target potential companies in the sector the Team of consultants was assigned to provide FREDA with wide range of information on the vegetables production and processing sector in Armavir, Aragatsotn, Lori, Shirak and Tavush marzes marzes of Armenia, including information on prices, sales volumes, varieties of end produce, access to markets, description of processing companies in those marzes in terms of their produce, technological sophistication, market linkages terms of availability of fresh vegetables and production volumes, varieties, prices, production methods of vegetables, availability of inputs and other information which will help to estimate the present status of the sector and to create opportunities for its development. Variety of survey tools/research mechanisms, information sources and analysis methods were used by the Team to conduct the survey: including desk research (e.g. data regarding existing and potential production volumes of vegetables, its' use in industrial purposes, domestic processing enterprises in mentioned marzes, statistics on vegetables processing industry of the regions etc.); primary research (e.g. face-to-face interviews, on site observations etc.) and analysis itself using various analytical tools and approaches. The following information Sources were used during the assessment: - National Statistical Service of RA - Ministry of Agriculture of RA - Agricultural Departments of relevant Marzpetarans - Processing companies - Industry experts - Farmers - Relevant local and International projects - Other researches, studies etc. reports; Internet resources 3 P a g e
4 Data Collection To get information concerning the survey purposes and objectives, the following methods were used. Agricultural expert interviews Interviews with farmers growing vegetables Interviews with advanced farmers On-site observations of processing enterprises and their premises Interviews with vegetable processing enterprises' management and technical staff Observation and interviews with retail chain participants in Yerevan Observation and interviews of sales personnel of stores selling seeds Observation and interviews of sales personnel of stores selling fertilizers Observation and interviews of sales personnel of stores selling pesticides Research Sample Overall, over 180 interviews with various groups presented above were conducted by the Team: farmers - 11 processors - 4 advanced farmers - 25 retail chain representatives - 4 input suppliers - 5 industry experts The Team was led by the following principals in selection of the respondents in the listed groups as well as sample sizes. Selection of Processing Companies At the beginning of the research the Team planed to survey all vegetable processing companies 1 in selected marzes. The number of those enterprises is 11 2 based on data checked from different official sources. Selection of Farmers 1 Some of the canneries do not process vegetables and are focused on fruits & berries only 2 Including MaxIdea which does not operate since P a g e
5 To conduct coordinated interviews with the farmers the following approaches were implemented to select the respondents: A decisive factor/determinant in definition of the number of interviews in each Marz was the size of lands intended for cultivation of selected types of vegetables in each Marz 3. The minimal number of farmers to be interviewed in each Marz was set 10. Distribution of number of interviews corresponding to each Marz allows to represent the Marzes in a way they are presented in general population. In the cases when distributing total number of interviews proportionally a Marz was presented with less than 10 interviews, those Marzes were grouped and then 1 Marz in the group was selected for interviewing. Geographical area is the main criterion for grouping the Marzes. And the main criteria for selection of a specific Marz in a group were the information about cultivation of selected types of vegetables. Communities/villages in a Marz were selected based on the information provided by processing companies. Those villages were selected from where the processors currently procure fresh vegetables. Farmers were selected based on social networks besides the best way to select farmers in each community would be random selection based on the list of farmers. But due to unavailability of such lists above mentioned method was implemented. The following criteria were applied to select the farmers: The fact of cultivation of selected types of vegetables in 2010 The fact of sale of vegetables to processing enterprises during 2009 and/or 2010 Based on the above mentioned criteria the following types of farmers were observed: Farmers who have cultivated the selected types of vegetables in 2010 and have sold vegetables to processors in 2009 and Number of those farmers in the sample is 70: Farmers who have cultivated the selected types of vegetables in 2010 and have not sold the vegetables to processors in 2009 and Number of those farmers in the sample is 32: Farmers who did not cultivate the selected types of vegetables in Number of those farmers in the sample is 32. As non cultivating farmer was considered the one who has 3 Information about land sizes on which the selected types of vegetables are cultivated was provided by National Statistical Service of Republic of Armenia. 5 P a g e
6 agricultural land, makes cultivation on that land but thoes not cultivate the selecte types of the vegetables. So, the total number of farmers observed is 134. Farmers, who had been informed of advanced cultivation technologies, made investments end expenditures, had cultivated vegetables of selected group and recorded income were selected to conduct in-depth interviews as those farmers were considered as advanced. 4 detailed interviews have been carried out with such farmers. To provide information on processed vegetables existing in local market and to present the best sales of processed products retail outlets were observed. For selection of specific retail points the Team designed 5 types based on their size and the fact of being involved in the network. Those specific stores which corresponded to those types and where available to participate in interview and observation have been selected. Totally 25 stores were observed, 5 of which are supermarket networks, 5 non-network supermarkets, 5 big stores, 5 middle stores and also 4 agricultural input (seed, patricide and fertilizer) stores were surveyed during the study. 6 P a g e
7 Historical overview Armenia was a highly industrialized country during the Soviet times with 70% of GDP accounted for by industry and 40% for the total employment, 66% of the population was urban. After the collapse of the Soviet Union in 1991 Armenia faced a number of drastic changes in its economic life. Firstly, breaking economic ties with Soviet republics. Secondly, the internal situation within Armenia 1988 earthquake, war with Azerbadjian over Nagorno Karabakh, blockade by Turkey resulted in a drastic reduction in industry with GDP decreasing by 55% in 1993 compared to Hence, the quality of life declined sharply and around 50% of the population found itself in poverty. Against this background Armenia started liberalization reforms with land privatization in 1991, price liberalization in 1992, and large-scale privatization in As in other transitional countries hyperinflation caused economic instability which was considered to be overcame in 1996, when single digit inflation was achieved. As a result of land privatization in Armenia around 330,000 farms were formed based on the previous collective and state farms. 886 large state-owned agricultural enterprises provided 66% of the gross agricultural output before privatization and private farms produced the remaining 34%. Land plots were allocated to those 330,000 farmers, averaging 1.4 to 1.7 hectares of arable land. In reality, many farmers cultivated significantly larger plots due to emigration and the possibility to lease land from the state. A great deal of the agricultural land has been privatized, however little support was provided to small land holders. Subsequently livestock and agricultural equipment were privatized. Due to delays in privatization of the food processing industry and the sectors catering to farming needs, Armenia could not establish adequate structures for technical servicing of farms and for the sale of produce. Trying to solve a crucial problem of irrigation and establishing such structures became a necessity. Farmers had the option of either keeping to the old format, or turn to individual farming, which they preferred. Thus, collective and state farms were dismantled in % of plow land, 79% of perennial plantations, and 44.1% of hayfields were privatized and allocated to new owners. The state kept the remaining 20% of land under its control. The new farms were small, averaging 1.26 ha. At the same time 350,000 livestock were sold to private owners and around 30% of other assets (real estate, transport and machinery equipment) were also privatized. All this resulted in an increase of agricultural outputs. 7 P a g e
8 In 1994 the major part of state-owned enterprises in the agricultural sector were privatized while agro-technology, fertilizer and chemical supply, seed growing, pedigree breeding, and water supply remained under state ownership. In the end, Armenia s economy registered two-digit annual economic growth between 2000 and2008, followed by a 15.9% decline in GDP in 2009 following the world economic crisis. Geography and Soils overview The Republic of Armenia is situated in the Caucasus region of the Near East. The country encompasses an area of 29,800 square kilometers. Armenia shares its border with Azerbaijan to the east, Turkey to the west, and Georgia to the north. To the south lies the Nakhichevan Autonomous Republic, a territory of Azerbaijan separated from the remainder of that country, by a panhandle of Armenia land extending to a 35-kilometer stretch of border with Iran. Armenia s topography is rugged highland plateau with elevations ranging from between 1,000 to 2,500 meters. Agricultural productivity in Armenia is heavily influenced by its geographical setting and climate. Armenia is situated in a high mountainous zone, with 40.5% of its territory sitting 2,000 meters above sea level. For the most part, it is poor in arable land; on a per-capita basis, 0.4 hectares of land is suitable for agricultural purposes, and 0.14 hectares is arable land. Overall only 10% of land is arable. The area receives little precipitation, with 2,400 cubic meters of water annually per-capita as compared with the annual per-capita average of 18,000 cubic meters in the former Soviet Union. There are some regions in Armenia that are arable and extremely fertile; most of these areas are concentrated in the Ararat Valley. This area produces a significant amount of the total agricultural output of the republic. Overall, the agricultural soils 4 are neutral or basic with ph from 7 to 9. Some 85 percent of arable land has a slope of less than 7 degrees and the steeper areas are often planted with perennial crops. The incidence of soil erosion is therefore limited. About 40 percent of the total land area is not suitable for agriculture. Agricultural soils differ across the main agricultural zones. In high areas with altitudes of 1000 to 2000 metres, soils are carbonate, chestnut type or varieties of black soils with good water holding capacities. The first two are more shallow and stony, with low organic matter and thus low production potential. At altitudes above 2000 metres, there are mountain and meadow-steppe soils, which are used mainly as pasture. 4 Report on Alternative Crop Production, Working Group 8 P a g e


9 Table 1: Land Balance by types of land Land Balance Arable land % % % % Perennial plantations % % % % Grass land % % % % Pastures % % % % Other % % % % TOTAL Agricultural land % % % % Source: NSS; State Cadastre of RA, Land Balance 2010 Source: Sustainable agriculture in Armenia 9 P a g e


10 Table 2: Territorial distribution by altitude Altitude above sea level, m Areas of altitudinal zones Thousand km 2 % Above Source: Ministry of Agriculture The map below presents the zones division of the territory of Armenia and the table shows each particular zone s main characteristic. Source: Sustainable agriculture in Armenia 10 P a g e

11 11 P a g e Source: Sustainable agriculture in Armenia
12 Armenia is divided into nine main agricultural zones: The territory of Armenia is divided into nine agricultural zones: 1. Ararat valley. Includes Ararat and Armavir marzes. The total area of the zone is ha (10.8 percent of the total area of the country). Agricultural lands occupy 56 percent of the area, the main portion of which is 800-1,000 m above sea level. Farming is exclusively by irrigation. 2. Uplands of Ararat valley. Includes former regions of Ashtarak, Nairi, Talin and Kotayk. Covers ha of area (10.3 percent). Agricultural lands occupy 53 percent of the area. Includes areas of m above sea level and higher. Farming is both by irrigation and supplementary rainfall. 3. Central zone. Includes Arapan and Aragatz region of Aragatsotn marz and Hrazdan region of Kotayk marz and covers an area of ha (6.5 percent). Agricultural lands occupy 50 percent of the area. Includes areas of m above sea level. Farming is mainly in rain fed conditions. 4. Sevan basin. Includes the Gegharkunik marz. Agricultural lands occupy 61 percent of the area. The first sub-zone is situated at up to m above sea level and the second sub-zone above m. There is a need for irrigation in the first sub-zone. 5. North-eastern zone. Includes former Ijevan, Noyemberyan, Tumanian and Tavush administrative regions. Agricultural lands occupy 22 percent of the area. The lower subzone is situated at up to 900 m above sea level and the second sub-zone above 900 m. Farming is conducted mainly in rain fed conditions and partially by irrigation. 6. Lori-Pambak zone. Includes former Gugark, Tashir and Stepanavan administrative regions. Agricultural lands occupy 59 percent of the area. It is divided into two sub-zones, mountain forests (up to m) and mountain steppe (above m). In both subzones farming is conducted in rain fed conditions. 7. Shirak zone. Includes former Amasia, Ani, Akhurian, Ashotsk administrative regions. Agricultural lands occupy 60 percent of the area. The first sub-zone is situated at up to m above sea level and the second sub-zone above m. There is a need for irrigation in the first sub-zone. 12 P a g e
13 8. Vaik zone. Includes the Vayots Dzor marz. Agricultural lands occupy 33 percent of the area. It is divided into three sub-zones (up to m, up to m, and above 1 900m). The first two sub-zones require irrigation. 9. Zangezur zone. Includes the Syunik marz. Agricultural lands occupy 27.8 percent of the area. In the first sub-zone (up to 900 m) farming is conducted in irrigated conditions, in the second and third sub-zones mainly in rain fed conditions. Armenia is a country of climate contradictions; even over small distances one can see substantial changes of climate because of the complex terrain. The country has all types of climate; from arid subtropical to cold high mountainous. The average annual air temperature is 5.5 C. The highest annual average temperature is C. At altitudes above 2500 m, the average annual temperatures are below zero. The summer is temperate, at the end of July the temperature is 16.7 C, and in Ararat valley it varies between C. The highest absolute temperature recorded is 43 C. Winters are cold with January the coldest month, with an average temperature of -6.7 C. The absolute lowest temperature recorded is -42 C. Winters in the north east and south east of the country are temperate. The average annual precipitation amounts to 592 mm. The most arid zones are the Ararat valley and Meghri region with annual precipitation around mm. Maximum precipitations are recorded in high mountainous areas at around 1000 mm per year. In the Ararat valley, average precipitation in the summer months does not exceed mm. The average annual wind velocity in Armenia is distributed unevenly between 1.0 to 8.0 meters per second. In some regions, particularly in the Ararat valley, mountain valley winds are quite common. In summer, their velocity reaches 20 m/s and more. Armenian Land Privatization Armenia was the first former Soviet Republic to introduce a comprehensive land privatization program. This was completed in 1991, and Armenia, alone among Newly Independent States countries (NIS) also called the CIS or Commonwealth of Independent States, put stateowned land in the hands of individual farmers. Armenia s Parliament began passing laws to gradually implement this reform in summer1990, beginning with a law on private property that resulted in the adoption of the land code of January 30, Within a two month period, four-fifths of all cultivated land was privatized, at a time surpassing every other former Soviet republic including Russia, which up to that point had done little more than publicize its intent to implement reform. On January 1, 1993, the number of privatized farms stood at 13 P a g e
14 243,000 with a total area of more than 209,300 hectares. In 1992, the number of privatized farms totaled 164,500. Land privatization initially resulted in a crop output rise of 30%, and a 15% increase in agricultural production, but in subsequent years output has fallen largely due to the effects of economic blockade. Armenia adopted the first private property law in the NIS in February Land privatization was the single most important factor contributing to household food security during In an increasingly market-driven economic environment, privatization had the potential to play a positive role in reviving the traditionally famous wine production industry in Armenia. Nonetheless, privatization of land was beleaguered by serious negative repercussions. Even under normal circumstances, poor subsistence farmers could barely produce enough for their own household food consumption. Armenia is a highly food insecure country with 28% of the population undernourished. The rate of recovery from the shocks of transition differs among farms, depending on their location and natural resources, access to solvent markets and management. In mountainous, re-mote, or insecure areas, the limited crop/market choice and the need to ensure household food security often traps farmers in low-input low-output scenarios. Before privatization, 886 large state-owned agricultural enterprises accounted for 66% of the gross agricultural output, while individual part-time small farms produced the remaining 34%. The land in Armenia, privatized immediately upon acquiring independence, allowed for the return of farmland to farmers. Some 320,000 farmers had been allocated small farms - with scattered parcels of land - averaging between hectares of arable land. In practice, given emigration and the ability to lease land from the state reserve, some farmers farmed considerably larger plots. The bulk of agricultural land has been privatized but there was little support for small land holdings. Farmers, like the rest of the population, had been impoverished by hyperinflation in the early nineties, which limited earning opportunities. Access to formal credit for many small farmers remains difficult, not because credit is unavailable but because both collateral and sustainable disbursement opportunities are limited. As a result, access to quality inputs and machinery is difficult. Livestock and a substantial part of agricultural equipment were privatized shortly thereafter. However, delays with the privatization of the food processing industry and the sectors catering to farming needs resulted in a situation where the country still was not able to establish adequate structures for technical servicing of farms and for the sale of produce. The creation of such structures as well as the resolution of an important problem in the Armenian context, irrigation, became imperative. In , the process of land distribution was separated from farm restructuring. In principle the members of a collective farm had the option of maintaining the previous structure. In practice, the members opted for individual farming, and most collective and state farms were 14 P a g e
15 dismantled in 1992 and By the end of 1993, 69% of plow land, 79% of perennial plantations, and 44.1% of hayfields were privatized and widely dispersed among new owners. The remaining 20% of land was retained under state control for further distribution. The resultant individual farms were generally small at an average 1.26 ha denying economies of scale. Simultaneously 350,000 head of cattle were sold to private owners. Approximately 30% of remaining assets (real estate, transport. machinery. and equipment) were also privatized. As a result, agricultural outputs gradually increased in the subsequent three years. The major share of supply, storage, processing, and marketing enterprises remained under state control, and deceleration of their privatization considerably hampered development for the three years following land privatization. In 1994, the Government incorporated and introduced the major part of state-owned enterprises in the agricultural sector for privatization. By the end of 1995, 77 enterprises had been sold to private owners. State-owned enterprises mainly carried out activities on agro-technology, fertilizer and chemical supply, seed growing, pedigree breeding, and water supply. Table 3 shows the number of small farms formed to date after land privatization was Arable farms, average ha or less than 0.5 ha per capita. Significant proportion of the hayfields and all pasture lands remained state owned. Table 3: Small farms ( ) N. of small Farms (ths.) Land Area (ths. ha) Average Size (ha) Source: NSS, Land Balance Table 4 compares commercial and small farms/household plots contribution to Gross Agricultural Output. Table 4: Gross agricultural output by farms Total Gross Agricultural Output (GAO) (bln. AMD at current prices) Produced by Household plots (individual farms) (%) Produced by Commercial Organizations (%) Source: NSS 96.2% 97.2% 97.6% 97.1% 97.2% 96.8% 96.9% 3.8% 2.8% 2.4% 2.9% 2.8% 3.2% 3.1% 15 P a g e
16 Agricultural Sector Agriculture is one of the Armenian economy s essential sectors, of central importance for employment and rural incomes. Agriculture declined as a contributor to the fast growing Armenian national economy until The share of employment in agriculture remains relatively constant due to a gradual decrease of non-agricultural employment opportunities restricting labor movement from the agricultural sector. Food processing is the agri-food sector with strongest growth potential, which accounted for about 37 percent of total industrial output in 2003 and is contributing significantly to redress the trade imbalance in the sector. The sector has begun to recover in recent years, helped by new investments, market oriented restructuring among privatized and attempts to exploit export markets, especially in Russia. Table 5: Economic Structure ( ) Agriculture (mln. AMD) 504, , , , , , ,566 (mln.usd) 945 1,077 1,336 1,853 2,083 1,499 1,747 Industry (mln. AMD) 535, , , , , , ,292 (mln.usd) 1,003 1,424 1,550 2,093 2,455 1,791 2,258 Services & other 1,097,94 (mln. AMD) 868, ,455,405 1,799,351 2,257,568 1,945,919 2,047,767 (mln.usd) 1,628 2,399 3,498 5,260 7,378 5,249 5,610 TOTAL GDP at Market Prices (mln.amd) As % of GDP Agriculture 26.40% 22.00% 20.90% 20.10% 17.50% 17.60% 18.20% Industry 28.10% 29.10% 24.30% 22.70% 20.60% 21.00% 23.50% Services 45.50% 49.00% 54.80% 57.10% 61.90% 61.50% 58.30% TOTAL 100% 100% 100% 100% 100% 100% 100% Source: NSS The agricultural sector growth recorded during reflects increase of individual domestic consumers incomes leading to expansion of domestic demand, allied to increases in international and domestic prices for agricultural products. The agricultural sector contribution to GDP fluctuated between 26.4% percent in 2004 to 18.2% in P a g e
17 Table 6: Gross Agricultural Output ( ) Gross Agricultural Output (GAO) (bln. AMD at current prices) Plant Growing GAO (bln.amd) Plant Growing GAO (% of GAO) Animal Husbandry GAO (bln.amd) Animal Husbandry GAO (% of GAO) Source: NSS % 58.4% 64.1% 67.8% 63.9% 62.3% 61.5% % 41.6% 35.9% 32.2% 36.1% 37.7% 38.4% Agriculture in Armenia is greatly influenced by topography with most cultivated land lying within an altitude range of m; largely dependent on irrigation; land reallocation is rapid and disorganized. The majority of farms are now just about self-sufficient, though unable to produce volumes required for commercial enterprise. Small farmers produce food for their family and sell small surpluses at market. The improvement of farm production systems requires a well-operating processing industry, marketing and technical assistance, a loan system, and an effective extension service. Table 7: GAO per marz (2010), per ha TOTAL Marzes Agricultural Land Used (ths.ha) TOTAL GAO bln.amd GAO PER MARZ 2010 (ths. AMD/ha) Aragatzotn Armavir Lori Shirak Tavush Higher GAO/ha was recorded for Armavir and Tavush in 2010, comparing with Shirak, Lori and Aragatsotn marzes. Much fruit, vegetable and grape production is concentrated in these two leading marzes, while the other regions cultivate grains, low value produce or specialize in livestock production. In the 1990s many orchards and vineyards were replaced with grain for food security reasons. Subsequently farmers became more market oriented and started 17 P a g e
18 re-establishing orchards and vineyards, using species with improved productivity, complemented by investment in grape and fruit processing industries. Table 8: Owned and leased land: distribution by marzes (2010) Rural Population (ths.p.) Agricultural land available (ths.ha) Agricultural land owned by individuals/ farms (ths.ha) Agricultural land owned by commercial organizations (ths.ha) Leased from community and/or state reserves (ths.ha) TOTAL Used (ths.ha) Land size per rural capita (ha) (1+2+3) Aragatsotn Armavir Lori Shirak Tavush Yerevan* Total Of the total ths. ha land area suitable for agriculture in the selected marzes; ths. ha belongs to individual small farms and commercial organizations, while the balance of ths. ha remains state owned, of which 60.3 ths. ha belongs to communities, subject to privatization, lease or community management, and the rest is retained in a state reserve to provide for future growth and for the needs of new landless families. Most of the state-owned land is pasture and grass land, which is approximately 80 %, and orchards and vineyards area is about 2% respectively. Armenian agriculture largely is made up of smallholder farms. An average farm comprise between 0.6 ha and 1.8 ha of land, of which 90% is privately owned, and the remainder leased. Farms in the irrigated areas are significantly smaller than others, indicating higher population density and scarcity of good land in irrigation-dependent areas. The family land is divided on average into three parcels: one plot nears the house, in the family through Soviet times; two other parcels are at the perimeter of the village, acquired since the 1991 land distribution. The absence of primary processing facilities at village level means small farmers in Armenia today are highly dependent on seasonal marketing operations. 18 P a g e
19 Armenian farmers face difficulties with transportation of produce to market, lack of agricultural machinery and limited use of purchased inputs, deteriorating irrigation systems, and limited access to commercial credit. The essential need is to support new and promote formed associations of growers, based on crop specialization, which has comparative advantage and can provide for adequate returns to inputs and labor, to become competitive in local and international markets. Strong relationships should be established with processors in wholesale markets. The establishment of viable producer associations would provide the grounding for a machinery services facility, group production credit, marketing and value-added farm gate, and a focus for advisory support. Constraints and Opportunities for Armenian agriculture The agricultural sector in Armenia is characterized by classic constraints on production and profitability in impoverished, subsistence-oriented smallholder agriculture, aggravated by the legacy of an abrupt transition from a command economy. Firstly, a very large number of farmers have little or no technical knowledge and skills, having entered the sector via land privatization as a survival strategy to cope with the collapse of other sectors of the economy. This is manifested in poor crop and animal husbandry and management, including excess seeding rates, little use of fertilizer and plant protection measures, and inadequate livestock feeding, health and sanitary practices. Secondly, the small farm sizes and priority accorded to food self-sufficiency can and do lead to poor returns, soil and pasture degradation, and to production patterns that are unsuitable and unsustainable for local agro-ecological conditions. Thirdly, technology and infrastructure including farm machinery and irrigation inherited from the pre-transition period is often inappropriate in terms of scale, cost and service requirements. Fourthly, even after many years of adjustment, there is still a seriously disabling absence of the information, instruments and institutions needed to efficiently operate a market-oriented rural economy, particularly in terms of input supply, technical and mechanical services, marketing, rural finance and agri-business. This inhibits access to affordable improvements to production and productivity, and prevents rationalization through diversification. Fifthly, the Government has tended to be weak and inconsistent with respect to the maintenance and development of coherent and supportive policy, regulatory and coordination environments. Consequences include the deterioration of genetic resources; 19 P a g e
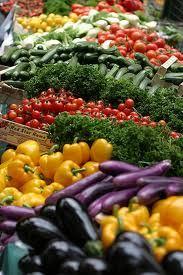
20 difficulties in controlling endemic disease; unavailability or inadequate use of improved varieties and certified seed; lack of appropriate applied research; poor quality control at the farm and processing levels; and farmers being discouraged from becoming proactive entrepreneurs. As it now stands, the objectives of the agricultural strategy are to: achieve real income growth for farmers through increased agricultural productivity; provide opportunities for real income growth for off-farm rural population. These objectives are to be achieved by: strengthening the efficiency of the agriculture and food sectors vis-à-vis the domestic market; developing import substitution in the sub-sectors where Armenia has a comparative and competitive advantage; and developing exports in the sub-sectors where Armenia has, or can build up, a comparative and competitive advantage. It identifies the following action areas: economic and agricultural policies; efficiency and profitability of agricultural production; land-use and natural resource management; agricultural support services to farmers, including rural finance; agricultural marketing and processing; and food security. Given the country s present structures and its goal to improve agricultural output and fight poverty in rural areas, the strategy shall target both small-scale surplus-producing and subsistence production farms. It also accords importance to new technologies, particularly to increase the range of reliable seed varieties, to irrigation and marketing, and to the development of agro-processing and agri-business, and appropriate rural financial services. In recognizing the need to establish appropriate local level organizations to mediate many of the actions, the strategy shall address measures to promote farmers and other rural producer and entrepreneurial groups. These measures include: improving the legal framework for such groups; establishing regular policy dialogue; reviewing the incentive framework and tax policies; and strong support of the donor community in promoting groups in agricultural and rural development projects. Vegetable production The variety of climate and soils makes the country suitable for the production of cereals, potato and other vegetables, fruits and grapes. Main crops grown are wheat, barley and potatoes, which serve both as subsistence and cash crops. The reliance on wheat for home consumption is understandable in view of the level of food insecurity in the country, but is only marginally profitable as imported grains are significantly cheaper. Yields of the major crops are believed to be only 50-60% of potential yields. For 20 P a g e


21 example, compared to 1990, the area put down to cereals has increased by 30% while the gross harvest has increased by only 10-15%. By contrast, potatoes are a vitally important food and cash crop, and have good export potential. Potato areas have increased over the last decade from 22 ths. ha in 1990 to an average of 30 ths. ha in , about 10-15% of which is under early potatoes. Similarly, fruit production has excellent potential and indeed was previously the most profitable element of the crop sub-sector. In the dire food and fuel crisis of the early 1990s, the area covered by fruit gardens was reduced from 54 ths ha down to 35 ths. ha 5 a decrease of 35.2%. Finally, vegetable cultivation is widespread, with the ths. ha under cultivation in the 1980s increasing to ths. ha by the late 2000s. Overall yields of vegetables seem to be quite satisfactory. The below map introduces specialization of marzes of RA by types of crops produced 5 Survey and Analysis of raw material base for processed fruits (including dried fruits), P a g e
22 In 2010, cereals were cultivated on ths. ha with a production equivalent to ths. tons; wheat was the major cereal crop, followed by barley and maize. Compared to 1990, the area under cereals as of 2010 increased by some 30% percent, though compared with 2009 it slightly decreased (by 7.8%). Potato is a vitally important food staple for Armenia. In 2010, the potato crop was grown on about 28.3 ths. ha with the total production equivalent to ths. tons (seed and ware included). The area under potato in 2010 was also less than in 2009 by 11.5%. Both early and main crop potatoes are grown, with the former representing normally about percent of the potato area. Early potatoes are grown exclusively under irrigation in the warmer, lower lying areas, mainly in the Ararat plain, while main crop potatoes are cultivated in the Lori, Shirak and Gegharkunik provinces. Over the past decade, Armenia has reached self-sufficiency in potato production and started exports of potatoes to neighboring Georgia (though on non-regular basis). Farmers are familiar with basic potato growing technology, but often use rustic and inadequate storage infrastructures to keep the potatoes over the winter. Several factors account for the low yields: poor seed quality, inadequate fertilizer application, insufficient crop protection. Vegetable cultivation covers about 19.3 percent of the total arable land (23.5 ths ha in 2010). Though in 2010, the area under vegetables stayed almost the same as in 2009 (1.7% less), the output was significantly lower (almost 20% less), which is mostly explained by negative weather conditions. The type of cultivated vegetables varies with altitude. At lower altitude, tomato, pepper, cucumber, eggplant, early cabbage and watermelons are popular, while at higher altitudes these are replaced by main crop cabbage, carrot and radish. The most specialized areas for intensive tomato, onion, cucumber and green chickpea production are concentrated in the Ararat valley (Ararat and Armavir marzes) and in Tavoush province, while the cultivation of cabbage, cauliflower, carrots and beet root mostly covers the lowaltitude irrigated agricultural zones. In 2010, the total vegetable production reached ths. tons. From 1980, the areas under vegetable crops, varying in some areas between ha have not changed significantly. The cultivated area rose spectacularly in 1991 and, by 1992, it had increased to ha (by more than 43 percent, compared with 1990) Although overall production increased in the same two years by only 27 percent, the marketing infrastructure was apparently unable to handle the increase, resulting in considerable spoilage in the fields and on farms. As a result of this experience, the area in 1993 was lowered by some ha. Overall yields of vegetable seem to be very good by any standards, considering that most of the crop is produced in the open. 22 P a g e
23 The country s cropping structure underwent a dramatic shift in the two years 1991 and The proportion of annual food crops increased at the expense of forage crops, perennials and industrial crops. The shift to annual food crops continued in Grain area was higher than in 1992 and surpassed, for the first time in history, ha. Vegetable area was down by ha, mainly due to farmers disappointment with marketing and prices in 1992; there was a further significant reduction in areas of forage crops, fruits and vineyards. Crop production in the past has been rather variable, with large yield fluctuations, in part because of weather. Input supplies under the FSU, although not optimal, were much better than they are presently and more stable from year to year. However, crop yields have been generally low, and even accounting for the country s agro-ecological conditions, the yields of the major crops are believed to be only percent of potential yields. While most of Armenia s regions do produce vegetables, the three major areas for commercial sale production are as follows: Ararat Valley, Upper Ararat, and Armavir. Most of the production in other regions is produced for self or local consumption. Generally, 10% or less of the production finds its way into the processing industry. This level may be slightly higher during the winter months. The regional distribution of cropping patterns depends largely on altitude and temperature conditions, which can be grouped into three broad zones: low altitude (<1 200 m), middle altitude ( m) and high altitude (>1 800 m). Irrigated areas within these three broad zones are estimated at some ha, ha and ha, respectively. It is worth to note, that the only provider of comprehensive information on vegetables and other crops cultivation lands is the NSS. It is noteworthy, that the Ministry of Agriculture also uses the database of NSS as well as the State Cadastre of RA. 23 P a g e
24 1. Vegetable production (ha/ton) in Armavir, Aragatsotn, Lori, Shirak and Tavush marzes of Armenia This section addresses the types of vegetables, production quantity value, prices, costs and earnings margins. Estimations are based on information received and collected during field visits and interviews with sector representatives. Products Overview In 2010, overall area under vegetables was 23.5 ths. ha with a total production of ths. tons. Over 62% of the area under vegetables is concentrated in Ararat and Armavir marzes, which contributes to 76% of the total volume in the republic. Currently, the domestic production of vegetables satisfies the domestic need and is being exported in limited volumes (e.g. to Russia, Georgia etc.). Major vegetables include tomato, cucumber, onion, cabbage, eggplant, pepper (sweet and hot) and watermelon. Apart from these vegetables beet, carrot, cauliflower, garlic, and different leafy greens are also widely grown. Production of leafy greens (cilantro, garden cress, dill, tarragon, basil and parsley) has remained relatively stable in recent years. Pea, shallot and cauliflower are also cultivated but in smaller amounts. The type of vegetables grown in Armenia has been gradually diversified in the recent years, though still in not significant volumes and mostly oriented towards fresh market. New crops include cherry tomato, fresh market tomato, capia pepper, Hungarian and American peppers, Chinese cabbage, Brussels sprout, pickling cucumber etc. In recent years, production areas under tomato, eggplant, pepper and cucumber have expanded, especially after winter wheat and through the use of early maturing varieties under film. One of the factors that contributed to this expanded production is the processing industry. The protected vegetable production technology was introduced in the 1970s and took off in the 1990s. However, as seen from the below graphs trends of vegetable production (in terms of sown areas and output) in Armenia are not stable: fluctuating from 22 ths ha in 1993, reaching its peak of 27 ths ha in 2004 and coming down to 23.5 ths. ha in NSS 24 P a g e
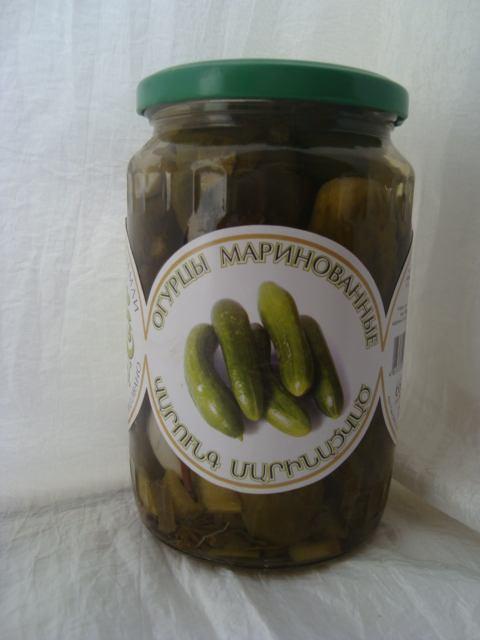
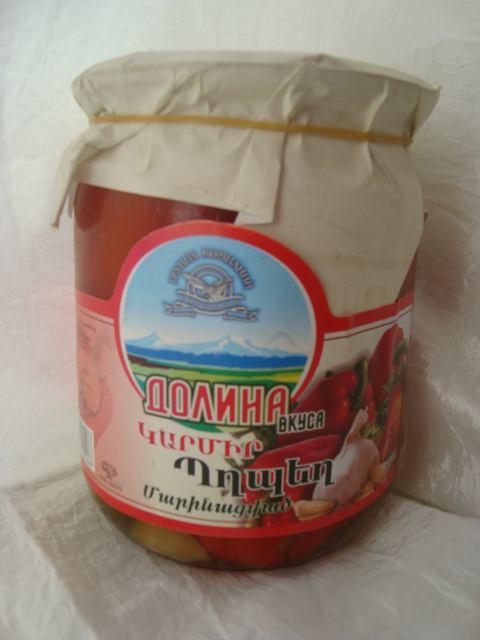
25 While sown areas do not change that much, collected harvest for the same period fluctuates rather significantly: from 450 ths tons in 1993, reaching its peak of 840 ths. tons in 2007 and about 700 ths. in Given the primary focus of this assessment (varieties being procured for processing) the following vegetables have been selected and agreed with FREDA to review: tomato, cucumber, eggplant, peppers and green beans. Carrot and garlic were also included in this study since these two varieties are used in almost all types of processed vegetables as supplementary ingredients. Table 9: Vegetables under review (fresh and processed) Fresh vegetables Processed Dried and/or frozen Cucumber Tomato Sweet pepper (green & paprica) Hot pepper Pickled cucumbers Tomato paste Pickled tomato Vegetable mixes Stuffed pepper Vegetable mixes Pickled green pepper Pickled hot pepper Vegetable mixes Dried tomato Frozen green pepper Frozen paprica Eggplant Eggplant "barbeque" Dried eggplant Vegetable mixes Green beans Pickled green beans Frozen green beans Garlic Carrot Pickled tomato, cucumber etc. Vegetable mixes Stuffed pepper Vegetable mixes The above table 9 shows the most common varieties of vegetables consumed fresh, processed and dried. Cucumbers - Estimates for total production of cucumbers vary from 55.2 ths. tons in 2010 to more than 71 ths. tons for Production varies from year to year according to the weather, availability of water, demand from processors (based on the previous year economic results), inputs quality and supply and cultivation practices. Special varieties of small cucumbers are being demanded by processors. 25 P a g e
26 Tomato Traditionally Armenia has been producing substantial volumes of tomatoes and supplying other republics of FSU (reaching 100 ths. tons fresh only). Though, nowadays production volumes are not that large (251,916 ths. tons in 2010), it remains one of the major vegetables being grown in the country (35.6% of total). Lion part of tomato produced in Armenia is grown in Ararat and Armavir marzes (95% of total). Pepper (sweet & hot) - Production of pepper in general is limited. The estimates by industry specialists indicate that there are about 8-10 ths. tons produced annually and this figure is rather stable from year to year. Most of the produce is being marketed fresh. Though it is used in a number of processed varieties of vegetables (mostly vegetable mixes), nevertheless the volumes purchased by processors is far beyond of the ones for tomato or cucumbers. Eggplant is another traditional and popular vegetable in Armenia, widely used in every-day diet both: cooked (at home) and processed. While processed, eggplant is used in various vegetable mixes, barbecue etc. It is the second by value (following tomato) purchased by processors in Though the data on areas under eggplant is not available in National Statistical Service, industry specialists estimate that there are about ths. tons of eggplant produced annually in the country. Green beans pickled green beans is relatively new variety offered by processors in both: domestic and export markets. Nevertheless, this is viewed as a gourmet product but the demand is limited. Most of processors consider processed green beans as an «additional» variety in the product range, rather than a primary product (e.g. tomatos) that generates substantial sales in local or export market. Garlic though garlic is considered to be one of the most expensive/high value vegetables quite demanded in both: domestic and export markets (e.g. Georgia), areas under garlic are not that large (about 900 ha in 2010 only). In processing, garlic together with carrot is used mostly as a supplementary ingredient (rather than a main product). Carrot in 2010 in Armenia there has been grown about 20 ths. tons of carrot, the lion part of which (98-99%) is utilized in fresh market (including households using that for home-made preserves). In processing carrot (like garlic) is used mostly as a supplementary ingredient in a variety of products (e.g. vegetable mixes, pickles etc.). 26 P a g e
27 Areas under vegetables through selected marzes NSS is the only source of comprehensive data on vegetable cultivation in the country. The Ministry of Agriculture also uses the data provided by NSS. All figures on vegetables, including one of sown areas, in National Statistics Service of RA are presented by major individual types of vegetables (e.g. tomato, cucumber, onion etc.) and by product groups/other vegetables (e.g. eggplant, pepper, greens etc.). There are inconsistencies between the figures provided by NSS and the State Cadastre although efficiency and accuracy of statistical data has recently improved. Table 10: Areas under crops by marzes (hectares) Marzes Cereals Potato Vegetables Gourd plantations / field compared with 2009, % compared with 2009, % compared with 2009, % compared with 2009, % Aragatsotn 23, , Armavir 6, , , , Lori 8, , , Shirak 34, , , Tavush 8, , Yerevan TOTAL 81,296 11,997 12,819 3,054 Source: NSS According to the NSS, in 2010 the total area of cultivated vegetables in selected marzes comprised 12.8 ths. ha, of which Armavir marz 8.2 ths. ha (or 64.1%) followed at quite some distance by Lori (10.2%), Shirak (10.0%), Tavush (7.4%) and Aragatsotn (6.3%) marzes. The below table 11 represents areas under selected varieties of vegetables in the mentioned marzes of RA. 27 P a g e
28 Table 11: Area under selected vegetables by marzes of Armenia Marzes Area under vegetables, ha Tomato, ha Cucumber, ha Vegetables Green beans, ha Other vegetables (inc. eggplant, pepper), ha Carrot, ha Armavir 8,172 2,137 1, , Aragatzotn Garlic, ha Lori 1, Shirak 1, Tavush Yerevan TOTAL 12,819 2,658 1,534 1,098 3, Source: NSS Table 11 clearly demonstrates the distribution of area under selected vegetables in selected marzes of RA. Thus, amongst selected marzes of Armavir, Aragatsotn, Lori, Shirak and Tavush the obvious leader is Armavir. In terms of areas sown, Armavir marz provides 80% of tomato fields in this group; 73% of cucumber and 76% of other vegetables (mainly including eggplant, pepper). Tavush marz is leading in this group in terms of areas under beans (including green) with 59.3% of total in this group of marzes. While carrot is being mostly produced in Shirak marz about 61% of total area under carrot, garlic is the only commodity Lori marz is the leader in the group by 41% of total area of these marzes. As it can be clearly seen from the below table, selected vegetables are planted rather unequally in terms of areas/hectares allocated for, total production volumes and geographic location. This is mostly explained by the fact that Ararat valley is the main area with suitable climatic and weather conditions for varieties such as tomato, cucumber, eggplant, pepper etc. and often the season can be expanded allowing farmers to collect second harvest. Though selected varieties of vegetables are grown in other regions as well, but in rather limited quantities for home/own consumption mostly. 28 P a g e
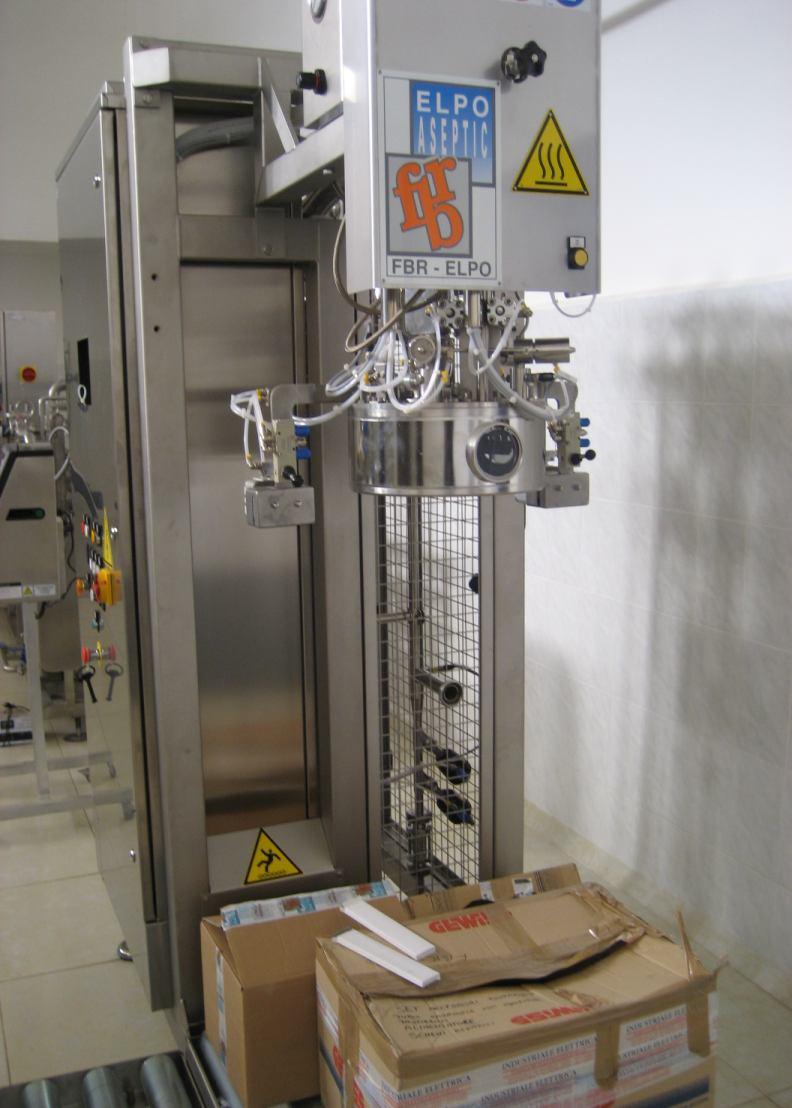
29 Table 12: Share of each category of vegetables in total of the country Vegetables Area under vegetables, % of total area under vegetables in the country Tomato, % of total area under Cucumber, % of total area under Green beans, % of total under green Other vegetables (inc. eggplant, pepper), % of total area under other Carrot, % of total area under Garlic, % of total area under Marzes tomato cucumber beans vegetables carrot garlic Armavir 34.80% 32.80% 49.80% 12.90% 44.00% 4.30% 6.20% Aragatzotn 3.40% 1.90% 3.40% 1.10% 4.00% 1.60% 3.90% Lori 5.60% 1.40% 4.30% 9.50% 3.00% 11.70% 17.90% Shirak 5.50% 0.40% 2.00% 1.60% 2.40% 36.70% 8.50% Tavush 4.00% 3.00% 7.10% 36.50% 2.70% 4.10% 6.20% Yerevan 1.30% 1.30% 1.80% % 1.60% 1.20% Source: NSS; Team calculations To analyze existing production volumes of vegetables in the selected marzes, it is important to understand productivity of those fields. In general, as indicated by the sector specialists, the average productivity of vegetables crops in Armenia is not bad despite of quality of supplied/available inputs in the market. Average Yield Capacity (centner/ha) Average yield capacity (centner/ha) As it can be seen from the above graph, after collapse and privatization processes in the beginning of 1990-ies, the sector slowly recovered reaching as high gross yields as 327 centners per hectare (in 2009) of all vegetables grown. (In 2010, due to unfavorable climatic/weather conditions agricultural lands under crops were damaged and the yields were significantly lower: about 280 center per hectare). 29 P a g e
30 Industry specialists consider productivity of vegetables in Armenia as acceptable since most of that is produced by farmers specialized in vegetable production. Distribution by Geographic Location As mentioned earlier, geographically production of vegetables in Armenia is mainly concentrated in Ararat Valley, i.e. in Armavir and Ararat Marzes (over 60% of all area under vegetables). In terms of harvest/production volumes contribution of these two marzes is even higher reaching 76.2% of total production, whereas all the rest marzes contribute only 23.8% only. Table 13: Harvest of vegetables by marzes, 2010 Cereals Potato Vegetables Gourd plantations / field Marzes 2010 (tons) 2010 compared with 2009, % 2010 (tons) 2010 compared with 2009, % 2010 (tons) 2010 compared with 2009, % 2010 (tons) 2010 compared with 2009, % Aragatsotn 42, , , , Armavir 18, , , , Lori 14, , , Shirak 80, , , Tavush 14, , , , Yerevan , , TOTAL 169, , ,479 79,184 Source: NSS Table 14 represents volumes of production selected group of vegetables in the total vegetable production in Armenia as well as distribution by selected marzes. There are no separate data on pepper and eggplant (but united in other vegetables category) counted by National Statistic Service and research team used own data checked with other sources. Selected varieties of tomato, cucumber, green beans, eggplant, pepper, carrot and garlic comprise 75.1% of total vegetables produced in Armenia. The rest 24.9% comprise varieties either not used or used at limited scale in processing industry such as: cabbage, onion, beet, pea etc. 30 P a g e
31 Amongst selected vegetables tomato is the traditional leader amongst vegetables produced in Armenia (since Soviet times) comprising 35.6% of all vegetable produce followed by other vegetables category, which unites eggplant and pepper varieties with 25.8% and at quite some distance cucumber 8.9%, carrot 2.9%, garlic 1.2% and green beans 0.6%. Table 14: Harvest of selected vegetables by selected marzes, 2010 of which selected vegetables Other vegetables (inc. Marzes Total Harvest, (tons) Tomato, (tons) Cucumber, (tons) Green beans, (tons) eggplant, pepper), (tons) Carrot, (tons) Garlic, (tons) Armavir 270,409 87,891 39,038 1,170 81,011 1, Aragatzotn 22,082 2,677 1, , Lori 12, , Shirak 28, ,446 7, Tavush 7,258 1,579 1,262 1,005 1, Yerevan 3,750 1, TOTAL 344,479 93,875 43,608 2,574 93,522 10,352 2,449 Source: Ministry of Agriculture of RA; Team calculations Table 15 represents the distribution of harvest within each category of vegetables amongst selected marzes. While discussing tomato, cucumber and pepper and eggplant the obvious leader in this group of marzes is Armavir marz with 34.9%, 61.7% and 44.3 % respectively, Tavush marz supplies 24.0% of green beans respectively in this group of marzes. Shirak marz, known by the good quality of its carrot, is the leader in this category producing 35.9% of all carrot in Armenia. The cultivation of a particular type of vegetable in any of the Marzes is related with the climatic conditions of the given Marz. 31 P a g e
32 Table 15: Share of selected vegetables in total harvest, 2010 of which selected vegetables Other Marzes Share of selected group of vegetables in total harvest of the marz Tomato, % of total tomato harvest Cucumber, % of total tomato harvest Green beans, % of total tomato harvest vegetables (inc. eggplant, pepper), % of total tomato harvest Carrot, % of total tomato harvest Garlic, % of total tomato harvest Armavir 78.0% 34.9% 61.7% 27.9% 44.3% 5.0% 8.5% Aragatzotn 58.9% 1.1% 2.5% 1.6% 4.5% 1.0% 3.2% Lori 21.9% 0.1% 0.4% 6.8% 0.3% 5.0% 3.7% Shirak 41.7% 0.2% 0.9% 1.2% 1.3% 37.4% 8.6% Tavush 73.0% 0.6% 2.0% 24.0% 0.5% 1.1% 2.5% Yerevan 69.5% 0.4% 1.4% - 0.2% 1.2% 1.2% TOTAL 71.5% 37.3% 68.9% 61.5% 51.2% 50.7% 27.8% Statistical data on types of vegetables is applied by NSS just recently, therefore it is not possible to track trends during past years in production of those. (As mentioned eggplant, pepper and some other varieties of vegetables are classified within one group). Given the existing situation, our team tried to collect data from other related sources such as Ministry of Agriculture, Marzpetarans, Agriculture Support Centers, etc. Table 16 shows that except Armavir marz, other marzes supplied rather modest volumes/ share of selected groups of vegetables to processors in In general, as told by surveyed processors as well, nowadays processing industry is buying/collecting not more than 10% of total harvest of selected groups of vegetables. The rest of the harvest of selected vegetables is sold fresh, consumed by farmers and/or bartered. Table 16: Supply of selected group of vegetables by selected marzes 7 Vegetables procured for processing in 2010 Armavir Shirak Lori Cucumber 82% Tomato 58% Green pepper 66% Red pepper 58% Hot pepper 56% Egg plant 72% Garlic 8% 6% 7% Green beans 83% Carrot 8% 24% 7 Source: the Team 32 P a g e
33 Production Potential of selected vegetables in selected marzes Two major factors should be kept in mind while analyzing production potential of selected varieties of vegetables: a. climatic conditions required for production of certain types of vegetables b. available land resources in terms of type, irrigation etc. Climatic zonality of Armenia (and selected marzes) is discussed in details in previous sections of the report. Thus, selected group of vegetables can be divided into two major groups: - varieties of vegetables that require enough humidity and high temperature for seeds to germ (starting from 12oC) and for effective growth (not less than 22oC). These varieties do not grow if temperature conditions are not appropriate. - varieties of vegetables, seeds of which germ starting from 2-4oC and the growth starts in temperatures of 10-20oC. Higher temperatures negatively affect these varieties. Based on the above limitations, one can see that tomato, cucumber, pepper, eggplant etc. belong to the first category production of which in industrial (for processing) volumes is concentrated mainly in Ararat and Armavir marzes. This does not mean that they do not grow in other marzes (e.g. often tomatoes are grown to be harvested green and pickled in home conditions). In Ararat and Armavir marzes, the number of sunny days during the year and average temperature are high/good for production of mentioned varieties in large volumes (often twice a year). Second group of vegetables (carrot, garlic) is usually produced in marzes with less favorable climatic conditions such as Gegharkunik, Kotayk, Syunik, Shirak. The below table shows the distribution of irrigated land resources by marzes of RA and their use for production of selected groups of vegetables. As one can see Armavir marz is in the best situation: nearly 95% of its arable land is irrigated. 33 P a g e
34 Table 17: Potential of existing land resources for vegetable production Share of irrigated land in arable, % Area under vegetables (ha) Share of area under selected vegetables of total irrigated, % Marzes Arable land (ha) Irrigated land (ha) Aragatsotn 53,913 15,910 30% 804 5% Armavir 41,696 39,478 95% 8,172 21% Lori 41,988 7,194 17% 1,311 18% Shirak 79,950 15,307 19% 1,283 8% Tavush 25,223 3,802 15% % At the same time only 21% of available land is used for production of selected groups of vegetables in Armavir marz. The rest is occupied by other crops (e.g. cereals, fodder, potato, melons). This picture proves the statement that processing industry is not the best market for farmers to produce selected groups of vegetables. 34 P a g e
35 Table 19: Existing data on the varieties of vegetables 8 Vegetables Varieties Maturation Nver Midseason Lia Midseason Gyumri Early Anahit-351 Early Yeraz Midseason TOMATO Syunik Midseason-early Zurab Late-ripening Echmiadzin Midseason Masis Midseason Gandzak Midseason Ranni-Nush Early Sofi Midseason PEPPER Hayk Early Nush-55 Early 78/1 Midseason Zmrukht Early Nush-78 Midseason Ani Midseason Moldavian Midseason Lastochka Midseason CUCUMBER Gayane Midseason Mane Midseason-early Kotayk Local Midseason-late-ripening Concurent Midseason Delphi Midseason-late-ripening EGGPLANT Yerevani Manushakaguyn (Yerevan Violet) Early Haykakan Vaghahas (Armenian Early) Early Karine Super-early Sev Margarit (Black Pearl) Midseason Armavir Midseason Avand Midseason CARROT Nante Early Chantini Midseason Green beans Local varieties Midseason Garlik Local varieties Midseason 8 IV Fruitful Armenia Conference materials 35 P a g e
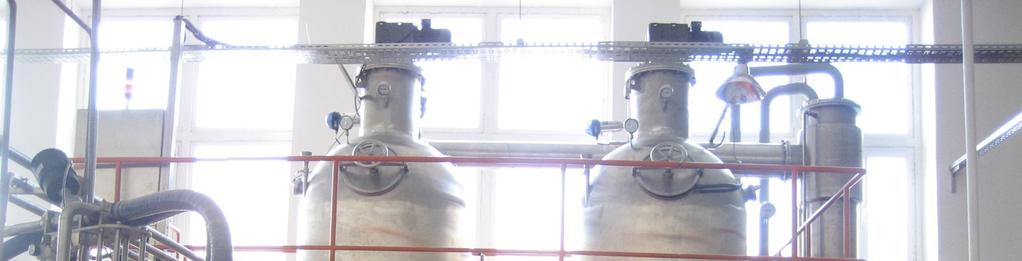
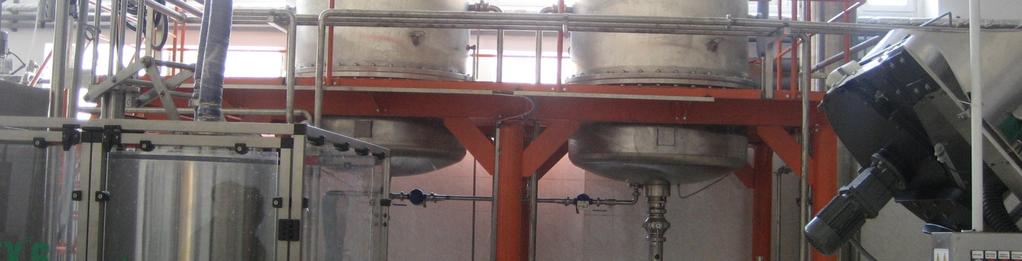
36 2. Domestic processors Their scale, product variety, volumes and capacity, including assessment of production capacity, used equipment and technology Historical Overview: Soviet Times Armenia Processing Industry During the Soviet era, Armenia manufactured a wide range of processed fruits and vegetables, supplying other USSR republics. Tomato paste and sauces were volume leading, followed by a select variety of fruit jams, fruit purees, fruit concentrates, preserves and dried fruits, jarred tomatoes and pickled vegetables. Below graph illustrates the output of Armenia s food processing industry between 1925 and 2001 and the dramatic fall illustrates the effect of collapse of the Former Soviet Union (FSU). Canned products: Local Production trends ( ) 600 Production volumes, mln. conditional cans Years The chart above covers the period up to 2001, since after that NSS started counting canned preserves separately from juices, compotes and other canned varieties. Nevertheless, it is clearly seen from the above graph, that after peak of production in , Armenian processing industry never regained those volumes continuously decreasing production volumes in the period of to the bottom in P a g e
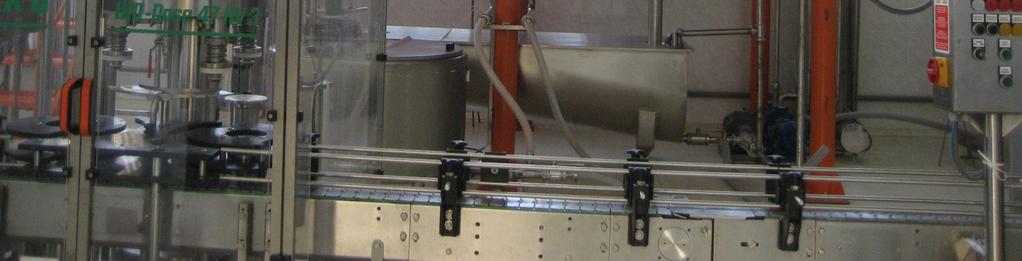
37 Volumes of Canned Products in RA, in tones In 2010 production of canned products constituted 7,8 ths. tones only of which 4,4. ths. tones of canned vegetables and 1.8 ths. tones tomato paste. This figure can be adjusted once annual statistical data is finalized by NSS. After 2001the NSS changed the data parameters; however it is clear that production peaked in Armenian canneries production volumes have fluctuated significantly. Since 2003 Armenian processors, assisted by state and foreign funded projects and organizations, including Ministry of Agriculture, Armenian Development Agency, USDA/CARD, and DAI-ASME/USAID have been actively trying to develop export markets, with some success. The slight positive trend of ends with a significant drop in 2009 and 2010 due to world financial-economic crisis, which also affected the Armenian processing industry, decreasing export sales, and a 40% reduction in locally procured fruit compared to In Soviet times, there were 18 9 operational canneries with using different levels of technology and sophistication. Some continue operating, at much reduced capacity. 9 Excluding wineries, grape purchase outlets etc. 37 P a g e

38 Areas of main concentration of canneries Traditionally, Armenia was a key supplier of agro-processed goods to the Former Soviet Union with 80% of products being exported within the Soviet republics. Export demand and production reduced, by over 70%, after the fall of the Soviet Union. Plants and canneries closed while orchards and vineyards were either cleared or abandoned. Table 20: Processing enterprises during Soviet period & their current status 38 P a g e Enterprise Location Current Status 1 Yerevan Cannery Yerevan Scrapped (Petak wholesale market) 2 Armavir «Sardarapat» Cannery Armavir marz Fragmented. One part now «Levon» LLC Cannery. Second element MAXIDEA Cannery ceased operations in Echmiadsin Cannery Armavir marz CONSER Cannery 4 Echmiadsin «Chobankara» Armavir marz Burakn LLC/Arzni Group Cannery 5 Masis Cannery Ararat marz Alishan Cannery 6 Artashat Cannery Ararat marz ArtFood Cannery 7 Ararat Cannery Ararat marz BORODINO Cannery 8 Ayrum Cannery Tavush marz Ayrum Cannery 9 Akhtala Cannery Lori marz Not operating 10 Tavush Cannery Tavush marz Scrapped 11 Gugark Cannery Lori marz Operating non-regularly (small volumes of fruits and berries processed)