North Dakota Farm Bureau North Dakota Farmers Union Monsanto 1 Star in Star Partner Program
|
|
|
- Cecil Waters
- 5 years ago
- Views:
Transcription
1

2 North Dakota Department of Career and Technical Education Mr. Wayne Kutzer, State Director Board Members Mr. Darrel Remington, Chairperson Mr. Jeffrey Lind, Vice Chairperson Ms. Maren Daley Mr. Brian Duchscherer Mr. Tim Mairs Mr. William Goetz Dr. Wayne Sanstead Ms. Val Moritz Ms. Beth Wilhelmi Belfield Rugby Bismarck Carrington Lisbon Bismarck Bismarck Valley City Stanley The N.D. Farm Management Education Association recognizes the listed organizations for their contribution toward the production and distribution of the N.D. Farm and Ranch Business Management Regional and State Averages for 2010 Basin Electric Power Cooperative CHS Foundation 3 Star in Star Partner Program North Dakota Farm Bureau North Dakota Farmers Union Monsanto 1 Star in Star Partner Program Cover photo courtesy of Langdon Research Extension Center
3 NORTH DAKOTA FARM BUSINESS MANAGEMENT EDUCATION REGION 3 - SOUTH CENTRAL 2010 ANNUAL REPORT The South Central (Region 3) farm business analyses were submitted by the following instructors represented by their cooperating schools. School Instructor Bismarck State College... Mark Holkup Carrington High School... Steve Metzger Jory Hansen Jamestown (JVATC)... Virgil Dagman Central Cass School, Casselton... Ron Smithberg ND State College of Science Wahpeton... Keith Torgerson This report was made possible by the farm families who cooperated with their farm management instructors in getting the records for 2010 closed out on a timely basis. The farm management instructors cited above generated the Finpack year-end farm analyses. Andrew Swenson, NDSU Extension Service, databased the Finpack analyses of farms and generated the comparative tables for this report. Location of all Farm Business Management Education Programs in North Dakota Bottineau Langdon Williston Minot Rugby Devils Lake Carrington Dickinson Glen Ullin Bismarck Jamestown Casselton Wahpeton
4 2010 South Central Report Introduction... 1 Explanatory Notes for the Farm Operators' Reports... 2 Farm Income Statement... 7 Inventory Changes... 9 Depreciation Profitability Measures Liquidity and Repayment Capacity Measures Balance Sheet at Cost Values Statement of Cash Flows Financial Standards Measures Crop Production and Marketing Summary Household and Personal Expenses Operator and Labor Information Nonfarm Summary Financial Summary (sorted by gross farm income) Financial Summary (sorted by age of operator) Financial Summary (sorted by farm type) Explanatory Notes for Crop Tables Barley on Owned Land Barley on Cash Rent Beans, Pinto on Cash Rent Canola on Owned Land Canola on Cash Rent Corn on Owned Land Corn on Cash Rent Corn Silage on Owned Land Corn Silage on Cash Rent CRP on Owned Land Hay, Alfalfa on Owned Land Hay, Alfalfa on Cash Rent Hay, Grass on Owned Land Hay, Grass on Cash Rent Hay, Mixed Alfalfa/Grass on Owned Land Hay, Mixed Alfalfa/Grass on Cash Rent Pasture on Owned Land Pasture on Cash Rent Peas, Field on Cash Rent Prevented Planting on Owned Land Prevented Planting on Cash Rent Soybeans on Owned Land Soybeans on Cash Rent Soybeans on Share Rent Sunflowers on Owned Land Sunflowers on Cash Rent... 49
5 Wheat, Durum on Cash Rent Wheat, Spring on Owned Land Wheat, Spring on Cash Rent Wheat, Spring on Share Rent Wheat, Winter on Owned Land...54 Wheat, Winter on Cash Rent...55 Explanatory Notes for Livestock Tables Beef Cow-Calf Average Per Cwt. Produced Beef Cow-Calf Average Per Cow Beef Replacement Heifers Average Per Head Sold / Trans Beef, Background Beef Average Per Cwt Produced Beef, Background Beef Average Per Head Figure 1. Gross Cash Income per Farm Figure 2. Net Farm Income (Accrual) per Farm Figure 3. Financial Efficiency Measures Figure 4. Profitability Measures per Farm Figure 5. Assets and Liabilities per Farm, Figure 6. Total Farm Assets and Liabilities Figure 7. Household and Personal Expenses Figure 8. Crop Acreage per Farm Figure 9. Spring Wheat Costs per Acre Figure 10. Average Net Return per Beef Cow... 66
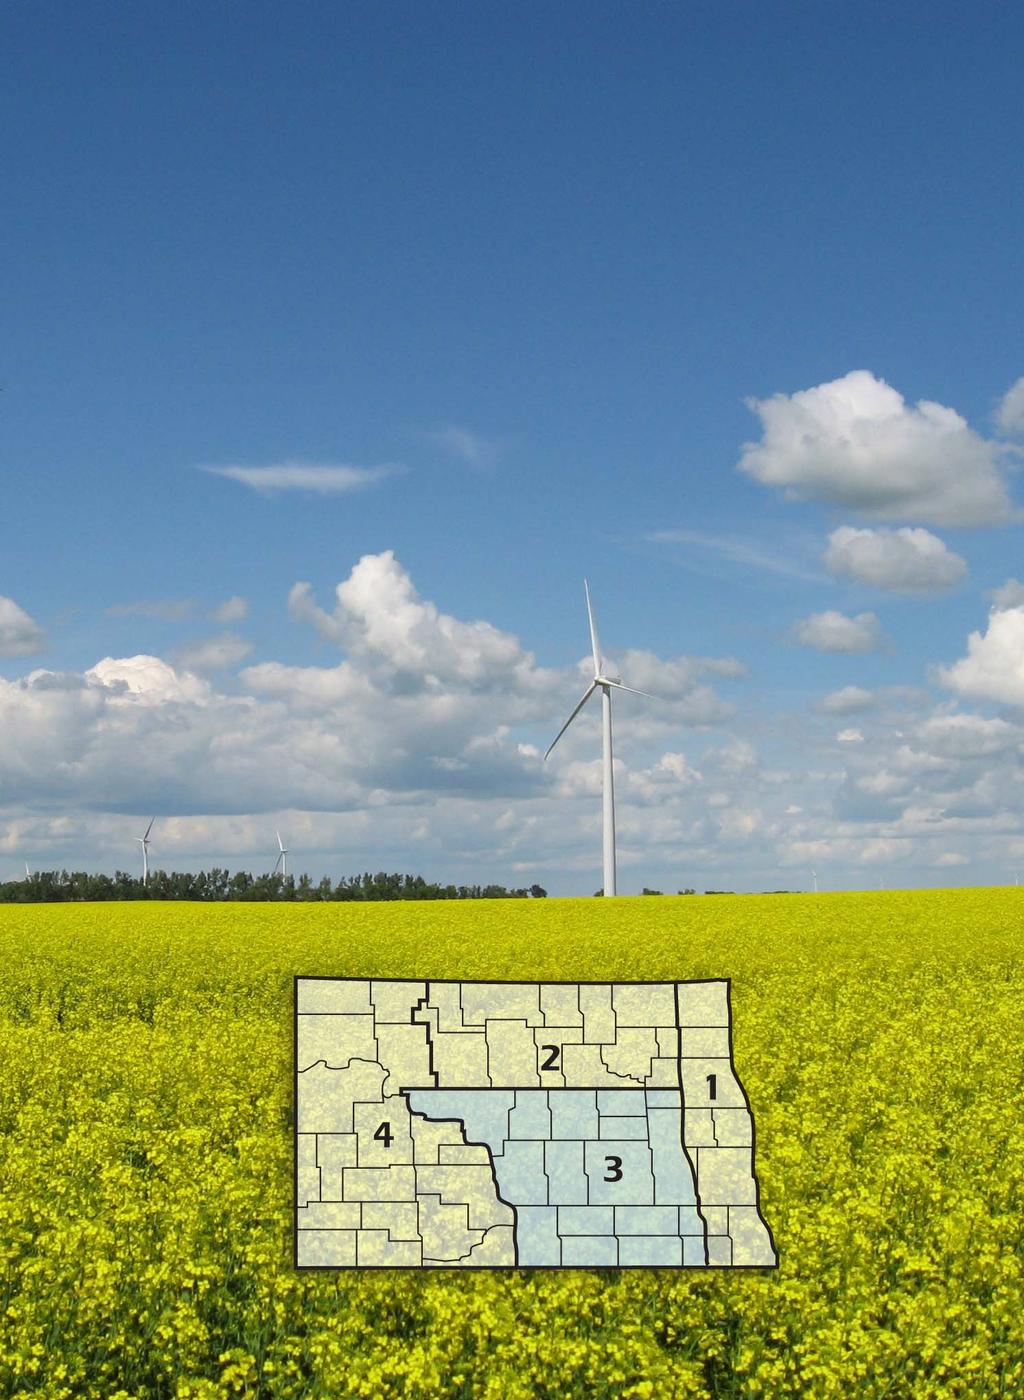
6 INTRODUCTION This report summarizes the individual farm records of the specific region or the whole state as identified on the acknowledgement page. The current financial status of farm operators and net returns from each crop and livestock enterprise is reported. In addition to the average of all farms, the averages for the high, middle, and low-income groups are also presented. All participating farm/ranch families are provided a copy of the regional averages report. They can compare their own Finan business analysis to the regional and/or state averages report and study the areas that may need management improvement. A review of the comparative information may reveal how certain aspects of the business or enterprises excel and help answer why they are profitable. The regional and state averages reports are divided into three major sections; farm operators reports, crop reports and livestock reports. Explanatory notes precede each section. The first section contains 15 tables with whole farm financial and operator information. The last three tables of this section are financial summaries in which farms are categorized by gross revenue, age of operator and farm type, respectively. The second section provides performance information on crop enterprises. The third section provides performance results on livestock enterprises. Lastly, figures 1 through 10 provide trend information for various measures of finance and/or production. The 2010 summary reports are based upon data generated by the Finan individual farm analysis completed by farm/ranch families enrolled in the statewide Adult Farm and Ranch Business Management Education program in North Dakota. Instructors pooled the individual business analysis and submitted the combined school data to the FINPACK Center located at North Dakota State University. The FINPACK Center did provide schools with local averages in order to assist instructors with obtaining relevant local management trends. Farm/ranch families enrolled in the statewide program are encouraged to request assistance from their instructors to determine short-term cash flow and long-term projections. Each instructor has access to FINPACK computer programs, which can be used to generate annual or multi-year (cash flow) farm plans and/or long term alternative projections. This is the 22nd year that the regional averages have been generated in North Dakota based upon the four regions shown in the state map on the cover of this publication. A regional report has been generated and published for Regions 2, 3 and 4 identified on the North Dakota map. Most farms in Region 1 are located within the Red River Valley. Those farms are contained in a combined Minnesota-North Dakota Red River Valley report. The state averages report includes all farms participating in the North Dakota Farm Business Management Education Program that were represented in the regional averages and also those farms which were processed and submitted after the March deadline date. All of these reports may be ordered from Farm Business Management, P.O. Box 6022, Bismarck, ND, for $5 per copy. The reports are available online at 1
7 EXPLANATORY NOTES FOR THE FARM OPERATORS' REPORTS The tables include the same number of farms, which were all of the farms whose records were judged to be of sufficient quality to be included in the overall report. However, the balance sheets include only sole proprietors. Partnerships and corporations are excluded because some debt is held outside of the business causing potential misinterpretations of the financial statement. The number of farms included in each of the crop tables varies because all farms do not have the same enterprises. Also, some farmers' records were complete enough to be included in the whole-farm tables, but at times, these same farmers' crop records were not complete enough to include in the respective crop and livestock tables. Rounding of individual items for the report may have caused minor discrepancies with the printed totals which are calculated before rounding. Farm Income Statement This statement is a summary of income, expenses, or resultant profit or loss from farming operations during the calendar year. The first section of the table lists cash farm income from all sources. There are three possible sources of cash income from crops. The first is income from cash sales. The second is income from crops stored under government loan programs when the loan is treated as income for the year in which the crop was stored. If the crop value has not been entered as income when it was stored, then it would be treated as cash income in the year it was sold. The third is Net Government Sales, which refers to the difference between income credited in the year a crop was stored and the actual cash income received at the time it was sold. There are two categories of cash income from livestock sales. "Raised" steer, hogs, and lambs refer to animals raised from birth to market weight on the farm. "Finished" animals refers to those purchased as feeders and fed to market weight. The Direct & CC govt payments" are decoupled from crop production but the counter-cyclical payment is coupled to national average prices. "LDP payments" are loan deficiency payments that may be received on production when local prices are below the county loan rate for the crop. Other government payments refers to all other government payments such as disaster payments but not including CRP payments. The second section of the income statement lists cash expenses. "Labor" includes only labor hired. "Interest" includes only interest actually paid. No opportunity charges on farm equity capital or unpaid labor are included. The difference between "Gross Cash Farm Income" and "Total Cash Expense" is the "Net Cash Farm Income." This is net farm income on a cash basis. The last two sections of the income statement deal with the non-cash changes in the farm business. The "Inventory Changes" and "Depreciation sections are used to convert the cash income statement (Net Cash Farm Income) derived from the first two sections into an accrual income statement. The final adjustment is for Gain or loss on capital sales. The bottom line, labeled "Net farm Income," represents the return to the operator's and family's unpaid labor, management, and equity capital (net worth). In other words, it represents the return to all of the resources that are owned by the farm family and hence, not purchased or paid a wage. However, it does not include any debt forgiveness or asset repossessions. Inventory Changes This is the detailed statement of inventory changes that is summarized in the income statement. It includes beginning and ending inventories and the calculated changes. 2
8 Depreciation This is the detailed statement of depreciation and other capital adjustments that is summarized in the income statement. It includes beginning and ending inventories, and capital sales and purchases. Profitability Measures This table shows profitability when capital assets are valued at cost. Various measures of performance are calculated. In the previous tables no opportunity costs are used. In this table, opportunity costs for labor, capital, and management are used. The measures and their components are described below. "Rate of return on assets" is the "Return on farm assets" divided by "Average farm assets." "Rate of return on equity "is the "Return of farm equity" divided by "Average farm equity." "Operating profit margin" is the "Return on farm assets" divided by "Value of farm production." "Asset turnover rate" is the "Value of farm production" divided by "Average farm assets." "Farm interest expense" is the accrual interest cost; usually it will be different from the cash interest expense. "Value of operator's labor and management" is an opportunity cost for unpaid operator's labor and management that is used in the calculation of several financial performance measures. A value of $20,000 per full time operator plus 5% of value of farm production is used. "Return of farm assets" is calculated by adding "Farm interest expense" to "Net farm income" and then subtracting the "Value of operator's labor and management." "Average farm assets" is the average of beginning and ending total farm assets. "Return on farm equity" is calculated by subtracting the "Value of operator's labor and management" from "Net farm income." "Average farm equity" is the average of beginning and ending farm net worth. "Value of farm production" is gross cash farm income minus purchased feed and feeder livestock and adjusted for inventory changes in crops, market livestock, accounts receivable and breeding livestock. Liquidity & Repayment Capacity Measures The table shows several measures of liquidity and repayment capacity. Calculation of repayment capacity starts with net farm income from operations and adds back the non-cash expense of depreciation. Personal income is also added. Family living expenses, personal debt payments and income taxes paid are subtracted to determine the capital debt repayment capacity. Balance Sheets The ending balance sheet statements and solvency measures are presented for sole proprietors only. Current assets are valued at market price at the time of the inventory which is December 31. In balance sheet at cost values, intermediate and long-term assets that are depreciable are valued at cost remaining (amount remaining to be depreciated, plus salvage value). Raised breeding livestock is valued at conservative market replacement costs. Land is valued at cost or conservative market value. In balance sheet at market values, the intermediate and long term assets are listed at market value, and deferred income tax liabilities are estimated. Statement of Cash Flows This statement organizes cash inflows and outflows by the following three categories: Operating activities, investing activities, and financing activities. 3
9 Financial Standards Measures The Farm Financial Standards Task Force recommended the use of these financial measures to evaluate a farm s financial position and financial performance. These measures are grouped by: Liquidity, Solvency, Profitability, Repayment Capacity, and Efficiency. Liquidity Liquidity is the ability of the farm business to meet financial obligations in a timely manner, without disrupting normal business operations. Current Ratio: The current ratio shows the value of current assets relative to current liabilities. It measures the extent current farm assets, if liquidated, would cover liabilities that are due during the next 12 months. The higher the ratio, the safer the short term position. Working Capital: Working capital shows the dollar amount that current assets can or cannot cover current liabilities. It approximates the amount of capital available to purchase crop and livestock inputs and equipment necessary to produce farm products. The amount of working capital considered adequate must be related to the size of the farm business. Working Capital to Gross Revenues: Measures operating capital available against the size of the business. Solvency Solvency is important in evaluating the risk position of the farm and family and in considering future borrowing capacity. Solvency measures the ability of the business to pay off all debts if liquidated. Farm Debt To Asset Ratio: The farm debt to asset ratio measures the financial position or solvency of the farm or ranch by comparing the total liabilities to the total assets. It measures the portion of the farm assets that have debt against them. A higher ratio is considered an indicator of greater financial risk. Farm Equity To Asset Ratio: The farm equity to asset ratio measures the farm equity relative to the value of the farm assets. It measures the proportion of the farm assets financed by the owner s equity whereas the debt to asset ratio measured the proportion of farm assets financed by debt. Farm Debt To Equity Ratio: The farm debt to equity ratio measures the amount of farm debt relative to the amount of farm equity. It measures the amount of debt the farm has for every dollar of equity. Profitability Profitability is the measure of the value of goods produced by the business in relation to the cost of resources used in the production. Profitability calculated on a cost basis does not consider changes in market valuation of capital assets such as machinery and breeding livestock. Rate of Return on Assets: Rate of return on assets is, in effect, the interest rate your farm earned in the past year on all money invested in the business. If assets are valued at market value, the rate of return on investment can be looked at as the opportunity cost of investing money in the farm instead of alternative investments. If assets are valued at cost (cost less depreciation), the rate of return represents the actual return on the average dollar invested in the business. Rate of Return on Equity: Rate of return on equity is, in effect, the interest rate your investment in the business earned in the past year. If assets are valued at market value, this return can be compared with returns available if the assets were liquidated and invested in alternative investments. If assets are valued at cost, this represents the actual return to the amount of equity capital you have invested in the farm business. 4
10 If your return on assets is higher than your average interest rate, your return on equity will be still higher, reflecting the fact that there are residual returns to equity capital after paying all interest expense. This is positive use of financial leverage. If your return on assets is lower than your average interest rate, your return on equity will be still lower, reflecting the fact that borrowed capital did not earn enough to pay its interest cost. This is negative financial leverage. Profitability becomes a key concern when substantial debt capital is used in the business. Net Farm Income: Net farm income represents the returns to labor, management, and equity capital invested in the business. Without income from other sources, or appreciation of capital asset values, net farm income must cover family living expenses and taxes, or net worth will decrease. Operating Profit Margin: The operating profit margin is a measure of the profit margin from the employment of assets. It measures how effectively you are employing assets relative to the value of output produced. Low prices, high operating expenses, or production problems are all possible causes of a low operating profit margin. EBITDA: This factor stands for: Earnings Before Interest, Taxes, Depreciation and Amortization. This represents a measure of earnings available for debt repayment. Repayment Capacity Repayment capacity shows the borrower s ability to repay term debts (longer than one year) on time. This includes non-farm income, and is therefore not a measure of business performance alone. Capital Debt Repayment Capacity: Measures the amount generated from farm and non-farm sources, to cover debt repayment and capital replacement. Capital Debt Repayment Margin: The amount of money remaining after all operating expenses, taxes, family living costs, and scheduled debt payments have been made. It is the money left, after paying all expenses, which is available for purchasing/financing new machinery, equipment, land or livestock. Replacement Margin: The replacement margin is the amount of income remaining after paying principal and interest on term loans and unfunded (cash) capital purchases. Term Debt Coverage Ratio: The term debt coverage ratio measures the ability of the business to cover all term debt payments. A number less than 100 percent indicates that the business, plus non-farm income, is not generating sufficient cash to meet all of the debt payments, after family living expenses and taxes have been paid. A number greater than 100 indicates the business is generating sufficient cash to pay all term debt obligations with some surplus margin remaining. Replacement Margin Coverage Ratio: This represents the ability to term debt and unfunded capital purchases. A ratio under 1.0 indicated that you did not generate enough income to cover term debt payments and unfunded capital purchases. Efficiency These measures reflect the relationships between expense and income items to revenue and the efficiency of the farm business with regard to the use of cash and capital assets. Asset Turnover: Asset turnover is a measure of how efficiently assets are used in the business. A farm with good operating profit margin and asset turnover will show a strong rate of return on farm assets. If operating profit margin is low, the asset turnover rate must be strong, or vice versa, to maintain the rate of return on assets. 5
11 Operating Expense Ratio: This ratio indicates the percent of the gross farm income, which is used to pay the operating expenses. Operating expenses do not include interest or depreciation expense. Depreciation Expense Ratio: This ratio indicates the percent of the gross farm income, which is used to cover the depreciation expense. Interest Expense Ratio: This ratio indicates the percent of the gross farm income, which is used to pay farm interest expenses. Net Farm Income Ratio: The ratio indicates the percent of the gross farm income, which remains after all expenses. Crop Production and Marketing Summary This table contains three sections. The first se ction reports averages for total acres owned, crop land by tenure and total pasture acres. The next two sect ions show average p rice received and average yields for major crops. These tables are sorted on the basis of "Net farm income." Household and Personal Expenses For those farms that keep records, the household and personal expenses are summarized. The farms are grouped in the same ranking as in the Income Statement. Since not all farms keep these records, the number of farms in the low profit and high profit groups may be different. Averages are determined by the number of farms keeping these records. The Statement of Cash Flows presents calculated family living and includes all farms. Income tax paid is also shown in the Statement of Cash Flows and includes all farms. Operator and Labor Information This table reports the average for the number of operators per farm, the operator's age, and the number of years farming. Nonfarm Summary This table also reports nonfarm income. The figu re reported is th e average over all fa rms not just tho se reporting nonfarm income. 6
12 Farm Income Statement (Farms Sorted By Net Farm Income) All Farms Low 20% 40-60% High 20% Number of farms Cash Farm Income Barley 24,645 1,845 17,851 64,853 Beans, Black Turtle 4, ,792 Beans, Navy 1, Beans, Pinto 6,805-1,168 26,810 Canola 12, ,002 Corn 65,800 13,059 72, ,278 Flax 4, ,622 Hay, Alfalfa Hay, Grass Hay, Mixed Hay, Mixed Alfalfa/Grass Hay, Small Grain Lentils ,970 Oats Peas, Field 2, ,097 Potatoes 4, Rye Soybeans 154,618 45, , ,335 Sunflowers 20, ,069 67,021 Sunflowers, Confectionary 4, ,408 Wheat, Durum 3, ,629 Wheat, Spring 108,473 3,295 55, ,516 Wheat, Winter 6, ,813 9,988 Rented Out 1,602 1, ,697 Soybeans, Food 5, ,803 Miscellaneous crop income Beef Bulls Beef Cow-Calf, Beef Calves 19,037 21,993 22,952 14,294 Beef Replacement Heifers 1,510 2, ,016 Beef Backgrounding 26,187 29,704 9,658 33,799 Beef Finishing 15, ,463 22,710 Beef Yearlings 8, ,445 Beef Grazing 1,632-1,220 5,231 Dairy, Milk 24, ,306 Dairy, Dairy Calves ,122 Hogs, Farrow To Finish, Raised Ho 2, Hogs, Feeder Pig Prod, Feeder Pig Hogs, Finish Feeder Pigs Sheep, Feeder Lamb Prod, Fdr Lamb 399 2, Sheep, Feeder Lamb Prod, Wool Sheep, Lamb Finishing ,000 - Sheep, Market Lamb Prod, Mkt Lamb Beef Finish Cull Cows 858-2,580 - Dairy Feeder Dairy Backgrounding Cull breeding livestock 9,124 9,419 6,870 12,634 Misc. livestock income 2, ,770 LDP payments 2, ,065 Direct & CC govt payments 17,629 4,691 13,895 41,843 CRP payments 1,976 1,467 1,942 2,225 Other government payments 27,166 12,877 19,393 54,897 Custom work income 13,499 4,346 44,101 9,970 Patronage dividends, cash 3, ,140 12,706 Insurance income 30,033 8,019 22,844 66,117 Sale of resale items 724-3,550 - Other farm income 5,832 3,709 2,310 9,996 Gross Cash Farm Income 650, , ,565 1,610,065 7
13 Farm Income Statement (Continued) (Farms Sorted By Net Farm Income) All Farms Low 20% 40-60% High 20% Number of farms Cash Farm Expense Seed 60,458 14,448 46, ,344 Fertilizer 68,370 9,372 45, ,185 Crop chemicals 37,597 4,498 23,135 99,283 Crop insurance 22,038 4,528 16,258 55,355 Drying expense 1, ,161 2,369 Storage ,493 Irrigation energy Crop marketing Crop miscellaneous 1, ,037 3,951 Feeder livestock purchase 24,847 3,785 8,357 63,100 Purchased feed 21,413 8,110 18,531 50,904 Breeding fees ,458 Veterinary 3,491 1,779 2,734 7,204 Supplies 3, ,915 7,665 Livestock custom hire Livestock machinery leases Livestock leases Livestock marketing 1, ,649 Interest 25,022 12,152 20,777 47,775 CCC buyback 1, ,469 Fuel & oil 31,263 9,788 28,321 66,394 Repairs 39,709 12,746 33,633 82,333 Custom hire 14,002 6,961 11,956 24,500 Hired labor 18,070 3,166 11,476 57,082 Land rent 60,854 19,912 45, ,462 Machinery leases 5,789 1,848 5,249 12,695 Building leases Real estate taxes 3,533 1,775 2,669 6,418 Farm insurance 7,374 3,771 5,491 16,829 Utilities 6,444 2,809 5,827 13,372 Dues & professional fees 1, ,730 4,363 Miscellaneous 11,315 5,761 8,254 23,936 Total cash expense 475, , ,830 1,138,448 Net cash farm income 175,362 41, , ,617 Inventory Changes Prepaids and supplies 17,654-2,510 14,120 40,593 Accounts receivable 6,601-4,649 13,341 14,040 Hedging accounts -7,444-6, ,025 Other current assets ,469 Crops and feed 92,168 12,523 17, ,547 Market livestock 12,939 1,191 10,862 22,570 Breeding livestock -3,445-11, ,241 Other assets ,634-2,079 Accounts payable 6,099 2,225 4,560 11,179 Accrued interest , ,638 Total inventory change 125,819-13,049 61, ,691 Net operating profit 301,181 28, , ,308 Depreciation Machinery and equipment -33,287-8,468-16,526-94,953 Titled vehicles -2,170-1,726-1,986-4,172 Buildings and improvements -3, ,464-11,376 Total depreciation -38,844-10,942-19, ,500 Net farm income from operations 262,337 17, , ,809 Gain or loss on capital sales 10,674 1,348 8,222 42,246 Net farm income 273,012 18, , ,055 8
14 Inventory Changes (Farms Sorted By Net Farm Income) All Farms Low 20% 40-60% High 20% Number of farms Net cash farm income 175,362 41, , ,617 Crops and Feed Ending inventory 413,291 51, ,479 1,376,011 Beginning inventory 321,123 38, ,342 1,031,464 Inventory change 92,168 12,523 17, ,547 Market Livestock Ending inventory 54,494 36,647 45,573 67,654 Beginning inventory 41,554 35,457 34,711 45,084 Inventory change 12,939 1,191 10,862 22,570 Accts Receivable Ending inventory 18,652 6,777 30,744 32,192 Beginning inventory 12,050 11,426 17,403 18,151 Inventory change 6,601-4,649 13,341 14,040 Prepaid Expenses and Supplies Ending inventory 67,900 4,738 39, ,788 Beginning inventory 50,246 7,247 25, ,195 Inventory change 17,654-2,510 14,120 40,593 Hedging Activities Ending inventory 5, ,832 Withdrawals 1, ,826 Beginning inventory 2, ,467 Deposits 10,975 7,017 1,583 32,215 Gain or loss -7,444-6, ,025 Other Current Assets Ending inventory 2, ,774 4,189 Beginning inventory 1, ,720 Inventory change ,469 Breeding Livestock Ending inventory 92,972 91,234 78, ,234 Capital sales 2,713 4, ,703 Beginning inventory 82,898 76,587 71, ,336 Capital purchases 16,233 30,351 7,897 14,841 Depreciation, capital adjust -3,445-11, ,241 Other Capital Assets Ending inventory 27,580 2,473 22,009 81,769 Capital sales 4, ,962 Beginning inventory 21,537 2,586 7,525 69,331 Capital purchases 9,912-11,875 34,479 Depreciation, capital adjust ,634-2,079 Accounts Payable Beginning inventory 22,631 21,038 16,123 44,108 Ending inventory 16,532 18,814 11,563 32,929 Inventory change 6,099 2,225 4,560 11,179 Accrued Interest Beginning inventory 11,131 6,431 7,285 23,528 Ending inventory 11,525 9,973 8,004 20,878 Inventory change , ,638 Total inventory change 125,819-13,049 61, ,691 Net operating profit 301,181 28, , ,308 9
15 Depreciation (Farms Sorted By Net Farm Income) All Farms Low 20% 40-60% High 20% Number of farms Net operating profit 301,181 28, , ,308 Machinery and Equipment Ending inventory 374, , , ,714 Capital sales 6,312 8, ,481 Beginning inventory 323, , , ,499 Capital purchases 90,243 28,323 38, ,648 Depreciation, capital adjust. -33,287-8,468-16,526-94,953 Titled Vehicles Ending inventory 22,226 10,211 23,686 37,103 Capital sales Beginning inventory 19,371 10,249 18,833 33,754 Capital purchases 5,156 1,716 7,210 7,625 Depreciation, capital adjust. -2,170-1,726-1,986-4,172 Buildings and Improvements Ending inventory 100,141 31,443 43, ,774 Capital sales Beginning inventory 85,285 31,346 36, ,294 Capital purchases 18, ,014 59,965 Depreciation, capital adjust. -3, ,464-11,376 Total depreciation, capital adj. -38,844-10,942-19, ,500 Net farm income from operations 262,337 17, , ,809 Gain or loss on capital sales 10,674 1,348 8,222 42,246 Net farm income 273,012 18, , ,055 10
16 Profitability Measures (Farms Sorted By Net Farm Income) All Farms Low 20% 40-60% High 20% Number of farms Profitability (assets valued at cost) Net farm income from operations 262,337 17, , ,809 Rate of return on assets 16.5 % 3.0 % 14.8 % 20.0 % Rate of return on equity 24.2 % 0.4 % 23.2 % 26.8 % Operating profit margin 34.0 % 11.1 % 27.4 % 38.4 % Asset turnover rate 48.7 % 26.9 % 54.2 % 52.0 % Farm interest expense 25,418 15,695 21,497 45,137 Value of operator lbr and mgmt. 47,955 16,683 36, ,092 Return on farm assets 239,800 16, , ,853 Average farm assets 1,451, , ,629 3,556,637 Return on farm equity 214, , ,716 Average farm equity 885, , ,334 2,484,495 Value of farm production 706, , ,933 1,848,674 11
17 Liquidity & Repayment Capacity Measures (Farms Sorted By Net Farm Income) All Farms Low 20% 40-60% High 20% Number of farms Liquidity Current ratio Working capital 234,284-7, , ,361 Working capital to gross inc 37.0 % -4.7 % 26.5 % 50.3 % Current assets 456, , ,374 1,265,726 Current liabilities 222, , , ,364 Gross revenues (accrual) 633, , ,572 1,566,265 Repayment capacity Net farm income from operations 262,337 17, , ,809 Depreciation 38,844 10,942 19, ,500 Personal income 39,525 43,166 28,767 70,442 Family living/owner withdrawals -56,499-33,419-44, ,272 Payments on personal debt -3,823-3,950-3,746-2,257 Income taxes paid -10,375-5,922-7,742-24,601 Interest on term debt 16,927 11,188 13,671 28,956 Capital debt repayment capacity 286,936 39, , ,576 Scheduled term debt payments -61,313-31,319-45, ,526 Capital debt repayment margin 225,623 8, , ,049 Cash replacement allowance -19,655-5,744-12,793-56,069 Replacement margin 205,968 2,562 92, ,980 Term debt coverage ratio Replacement coverage ratio
18 Balance Sheet at Cost Values (Farms Sorted By Net Farm Income) All Farms Low 20% 40-60% High 20% Number of farms Assets Current Farm Assets Cash and checking balance 21,967 15,749 9,158 50,955 Prepaid expenses & supplies 54,333 4,738 41, ,593 Growing crops 1, ,390 Accounts receivable 16,531 6,777 30,779 23,402 Hedging accounts 1, ,128 Crops held for sale or feed 293,066 51, , ,718 Crops under government loan 16, ,946 Market livestock held for sale 50,584 36,647 38,692 53,973 Other current assets , Total current farm assets 456, , ,374 1,265,726 Intermediate Farm Assets Breeding livestock 75,440 91,234 61,547 48,602 Machinery and equipment 321, , , ,825 Titled vehicles 19,838 10,211 24,619 24,193 Other intermediate assets 4, , Total intermediate farm assets 421, , , ,472 Long Term Farm Assets Farm land 382, , , ,173 Buildings and improvements 83,059 31,443 45, ,824 Other long-term assets 11,532 1,894 15,145 22,467 Total long-term farm assets 476, , , ,464 Total Farm Assets 1,355, , ,381 3,096,662 Total Nonfarm Assets 171,451 83, , ,098 Total Assets 1,526, ,512 1,106,114 3,350,760 Liabilities Current Farm Liabilities Accrued interest 11,647 9,973 8,181 22,569 Accounts payable 14,610 18,814 11,431 25,094 Current notes 138,496 69, , ,753 Government crop loans 8, ,690 Principal due on term debt 49,204 25,531 42,666 98,258 Total current farm liabilities 222, , , ,364 Total intermediate farm liabs 136, ,504 99, ,065 Total long term farm liabilities 213, , , ,385 Total farm liabilities 573, , ,901 1,065,814 Total nonfarm liabilities 38,129 25,011 43,196 46,671 Total liabilities 611, , ,096 1,112,484 Net worth (farm and nonfarm) 915, , ,017 2,238,275 Net worth change 199,176 24, , ,374 Percent net worth change 28 % 9 % 25 % 34 % Ratio Analysis Current farm liabilities / assets 49 % 107 % 57 % 38 % Intermediate farm liab. / assets 32 % 55 % 34 % 24 % Long term farm liab. / assets 45 % 47 % 45 % 40 % Total debt to asset ratio 40 % 58 % 41 % 33 % 13
19 Statement Of Cash Flows (Farms Sorted By Net Farm Income) All Farms Low 20% 40-60% High 20% Number of farms Beginning cash (farm & nonfarm) 26,748 7,798 18,339 32,658 Cash Provided By Operating Activities Gross cash farm income 650, , ,565 1,610,065 Total cash farm expense -475, , ,830-1,138,448 Net cash from hedging transactions -9,736-7,017-1,238-29,389 Cash provided by operating 165,627 34, , ,228 Cash Provided By Investing Activities Sale of breeding livestock 2,818 5, ,694 Sale of machinery & equipment 6,681 8, ,200 Sale of titled vehicles Sale of farm land 6,655 2,069 10,556 20,053 Sale of farm buildings Sale of other farm assets 10, ,382 Sale of nonfarm assets 5,168 9, ,646 Purchase of breeding livestock -16,233-30,351-7,897-14,841 Purchase of machinery & equip. -90,243-28,323-38, ,648 Purchase of titled vehicles -5,156-1,716-7,210-7,625 Purchase of farm land -53,486-34,833-15,769-84,990 Purchase of farm buildings -18, ,014-59,965 Purchase of other farm assets -9, ,875-34,479 Purchase of nonfarm assets -18,499-13,377-6,205-36,688 Cash provided by investing -179,517-83,716-84, ,983 Cash Provided By Financing Activities Money borrowed 500, , ,408 1,123,750 Principal payments -454, , ,245-1,076,320 Personal income 39,525 43,166 28,767 70,442 Family living/owner withdrawals -56,499-33,419-44, ,272 Income and social security tax -10,375-5,922-7,742-24,601 Capital contributions Capital distributions ,589 - Dividends paid Cash gifts and inheritances 4, ,341 5,567 Gifts given ,468 Other cash flows Cash provided by financing 21,966 58,042-22,158-12,747 Net change in cash balance 8,075 8,919-5,047 29,498 Ending cash (farm & nonfarm) 34,823 16,717 13,292 62,157 14
20 Financial Standards Measures (Farms Sorted By Net Farm Income) All Farms Low 20% 40-60% High 20% Number of farms Liquidity Current ratio Working capital 234,284-7, , ,361 Working capital to gross inc 37.0 % -4.7 % 26.5 % 50.3 % Solvency (cost) Farm debt to asset ratio 42 % 62 % 45 % 34 % Farm equity to asset ratio 58 % 38 % 55 % 66 % Farm debt to equity ratio Profitability (cost) Rate of return on farm assets 16.5 % 3.0 % 14.8 % 20.0 % Rate of return on farm equity 24.2 % 0.4 % 23.2 % 26.8 % Operating profit margin 34.0 % 11.1 % 27.4 % 38.4 % Net farm income 273,012 18, , ,055 EBIDTA 326,599 44, , ,446 Repayment Capacity Capital debt repayment capacity 286,936 39, , ,576 Capital debt repayment margin 225,623 8, , ,049 Replacement margin 205,968 2,562 92, ,980 Term debt coverage ratio Replacement coverage ratio Efficiency Asset turnover rate (cost) 48.7 % 26.9 % 54.2 % 52.0 % Operating expense ratio 56.6 % 72.7 % 62.8 % 52.8 % Depreciation expense ratio 5.2 % 6.7 % 4.0 % 5.6 % Interest expense ratio 3.3 % 7.5 % 4.2 % 2.4 % Net farm income ratio 36.3 % 11.7 % 30.5 % 41.4 % 15
21 Crop Production and Marketing Summary (Farms Sorted By Net Farm Income) All Farms Low 20% 40-60% High 20% Number of farms Acreage Summary Total acres owned ,468 Total crop acres 1, ,328 4,261 Crop acres owned ,038 Crop acres cash rented 1, ,015 Crop acres share rented Total pasture acres Percent crop acres owned 28 % 35 % 27 % 24 % Average Price Received (Cash Sales Only) Soybeans per bushel Wheat, Spring per bushel Corn per bushel Barley per bushel Sunflowers per cwt Canola per cwt Wheat, Winter per bushel Beans, Pinto per cwt Wheat, Durum per bushel Average Yield Per Acre Soybeans (bushel) Wheat, Spring (bushel) Pasture (aum) Corn (bushel) Hay, Mixed Alfalfa/Grass (ton) Sunflowers (cwt) Canola (cwt) Hay, Grass (ton) Barley (bushel) Hay, Alfalfa (ton) Beans, Pinto (cwt) Corn Silage (ton) Wheat, Winter (bushel) Peas, Field (bushel) Wheat, Durum (bushel)
22 Household and Personal Expenses (Farms Sorted By Net Farm Income) All Farms Low 20% 40-60% High 20% Number of farms Average family size Family Living Expenses Food and meals expense 7,222 5,922 6,294 7,603 Medical care 3,647 1,407 3,166 7,052 Health insurance 4,297 2,049 3,899 5,856 Cash donations 1,506 1, ,346 Household supplies 5,021 4,095 3,819 6,732 Clothing 1, ,523 2,453 Personal care 6,063 2,260 3,048 10,510 Child / Dependent care Alimony and child support Gifts 1, ,273 1,932 Education 1, ,199 Recreation 2,723 1,153 2,329 4,569 Utilities (household share) 2,332 1,698 1,643 3,379 Personal vehicle operating exp 3,034 2,240 2,649 3,176 Household real estate taxes Dwelling rent Household repairs 1,779 2,784 1,384 1,879 Personal interest Disability / Long term care ins Life insurance payments 1, ,949 Personal property insurance Miscellaneous 1,656 1,043 1,647 2,412 Total cash family living expense 47,070 28,951 36,353 66,667 Family living from the farm Total family living 47,146 29,017 36,353 66,667 Other Nonfarm Expenditures Income taxes 11,418 6,737 6,038 32,116 Furnishing & appliance purchases Nonfarm vehicle purchases 2, ,503 8,934 Nonfarm real estate purchases 7,101-4, ,726 Other nonfarm capital purchases 3,497 13,494-2,126 Nonfarm savings & investments 5,106 2, ,312 Total other nonfarm expenditures 30,317 19,925 8,694 84,841 Total cash family living investment & nonfarm capital purch 77,387 48,876 45, ,508 17
23 Operator and Labor Information (Farms Sorted By Net Farm Income) All Farms Low 20% 40-60% High 20% Number of farms Operator Information Average number of operators Average age of operators Average number of years farming Results Per Operator Working capital 349,874-7, ,476 1,182,869 Total assets (cost) 1,692, ,512 1,049,218 3,815,665 Total liabilities 605, , ,509 1,055,006 Net worth (cost) 1,086, , ,709 2,760,659 Gross farm income 722, , ,707 1,784,252 Total farm expense 470, , ,897 1,084,426 Net farm income from operations 252,050 17, , ,826 Net nonfarm income 37,975 43,166 26,969 64,038 Family living & tax withdrawals 64,251 39,340 48, ,885 Total acres owned ,334.7 Total crop acres 1, , ,873.7 Crop acres owned Crop acres cash rented 1, ,741.1 Crop acres share rented Total pasture acres Labor Analysis Number of farms Total unpaid labor hours 2,021 1,091 1,993 2,877 Total hired labor hours 1, ,795 Total labor hours per farm 3,151 1,322 2,694 6,672 Unpaid hours per operator 1,942 1,091 1,869 2,615 18
24 Nonfarm Summary (Farms Sorted By Net Farm Income) All Farms Low 20% 40-60% High 20% Number of farms Nonfarm Income Personal wages & salary 17,935 27,299 15,304 10,191 Net nonfarm business income 2, ,583 1,798 Personal rental income 3,029 10, Personal interest income Personal cash dividends Tax refunds 741 1, Nontaxable personal inc Other nonfarm income 14,561 3,133 2,480 57,588 Total nonfarm income 39,745 43,166 28,767 70,597 Gifts and inheritances 4, ,341 5,567 19
25 Financial Summary (Farms Sorted By Gross Farm Income) Less than 50, , , ,001 - Over All Farms 50, , , ,000 1,000,000 1,000,000 Number of farms Income Statement Gross cash farm income 650,382 32,952 64, , , ,468 1,900,123 Total cash farm expense 475,020 40,438 51, , , ,945 1,396,180 Net cash farm income 175,362-7,485 13,708 45, , , ,943 Inventory change 125,819 19,337 18,153 20,877 56, , ,953 Depreciation -38,844-3,674-4,057-8,053-20,894-36, ,145 Net farm income from operations 262,337 8,178 27,803 57, , , ,751 Gain or loss on capital sales 10,674-22, ,841 6,150 28,095 Average net farm income 273,012 8,178 50,174 58, , , ,846 Median net farm income 151,501 6,051 28,220 60, , , ,160 Profitability (cost) Rate of return on assets 16.5 % 0.5 % 6.7 % 11.0 % 12.3 % 17.2 % 19.2 % Rate of return on equity 24.2 % -1.0 % 11.4 % 19.6 % 18.6 % 26.6 % 26.0 % Operating profit margin 34.0 % 2.1 % 29.2 % 28.4 % 29.9 % 34.7 % 35.7 % Asset turnover rate 48.7 % 21.9 % 22.8 % 38.9 % 41.1 % 49.7 % 53.9 % Liquidity & Repayment (end of year) Current assets 456,880 68,615 62, , , ,567 1,452,499 Current liabilities 222,596 34,871 32,532 82, , , ,894 Current ratio Working capital 234,284 33,744 29,750 53, , , ,605 Working capital to gross inc 37.0 % 59.8 % 38.6 % 28.4 % 32.2 % 31.5 % 45.0 % Term debt coverage ratio Replacement coverage ratio Solvency (end of year at cost) Number of sole proprietors Total farm assets 1,355, , , ,132 1,095,858 1,730,639 3,350,782 Total farm liabilities 573, , , , , ,344 1,323,735 Total assets 1,526, , , ,944 1,305,429 1,925,356 3,615,683 Total liabilities 611, , , , , ,748 1,386,888 Net worth 915, , , , ,621 1,173,609 2,228,795 Net worth change 199,176 26,650 45,611 54, , , ,587 Farm debt to asset ratio 42 % 47 % 49 % 58 % 43 % 41 % 40 % Total debt to asset ratio 40 % 49 % 50 % 53 % 39 % 39 % 38 % Nonfarm Information Net nonfarm income 39,525 42,690 28,414 30,903 37,635 32,984 64,448 Farms reporting living expenses Total family living expense 47,146-26,807 24,332 44,657 63,140 72,264 Crop Acres Total acres owned , ,186 Total crop acres 1, ,181 2,039 4,760 Total crop acres owned Total crop acres cash rented 1, ,251 3,725 Total crop acres share rented
26 Financial Summary (Farms Sorted By Age Of Operator) Less All Farms Than Over 60 Number of farms Income Statement Gross cash farm income 650, , , , , ,399 Total cash farm expense 475, , , , , ,362 Net cash farm income 175,362 86, , , , ,037 Inventory change 125,819 48, , , , ,420 Depreciation -38,844-14,905-42,621-53,496-48,391-32,331 Net farm income from operations 262, , , , , ,126 Gain or loss on capital sales 10, ,845 17,253 44,116 Average net farm income 273, , , , , ,241 Median net farm income 151,501 66, , , , ,595 Profitability (cost) Rate of return on assets 16.5 % 20.7 % 15.0 % 18.8 % 15.5 % 15.0 % Rate of return on equity 24.2 % 47.5 % 26.0 % 30.7 % 20.6 % 17.5 % Operating profit margin 34.0 % 28.4 % 28.7 % 34.5 % 36.0 % 42.0 % Asset turnover rate 48.7 % 72.9 % 52.3 % 54.4 % 43.0 % 35.7 % Liquidity & Repayment (end of year) Current assets 456, , , , , ,885 Current liabilities 222,596 96, , , , ,413 Current ratio Working capital 234,284 90, , , , ,472 Working capital to gross inc 37.0 % 23.4 % 16.9 % 36.7 % 45.4 % 67.5 % Term debt coverage ratio Replacement coverage ratio Solvency (end of year at cost) Number of sole proprietors Total farm assets 1,355, ,270 1,322,035 1,888,538 1,717,242 1,149,479 Total farm liabilities 573, , , , , ,903 Total assets 1,526, ,637 1,429,197 2,103,860 1,922,571 1,528,397 Total liabilities 611, , , , , ,446 Net worth 915, , ,937 1,222,066 1,268,126 1,154,951 Net worth change 199, , , , , ,192 Farm debt to asset ratio 42 % 60 % 51 % 45 % 36 % 25 % Total debt to asset ratio 40 % 60 % 49 % 42 % 34 % 24 % Nonfarm Information Net nonfarm income 39,525 19,356 21,839 23,654 61,671 76,444 Farms reporting living expenses Total family living expense 47,146 25,083 41,710 66,778 55,483 49,773 Crop Acres Total acres owned ,328 1,448 Total crop acres 1, ,620 2,417 2,208 1,449 Total crop acres owned Total crop acres cash rented 1, ,340 1,522 1, Total crop acres share rented
27 Financial Summary (Farms Sorted By Farm Type) Crop and All Farms Crop Beef Beef Other Number of farms Income Statement Gross cash farm income 650, , , , ,452 Total cash farm expense 475, , , , ,532 Net cash farm income 175, ,405 27, , ,921 Inventory change 125, ,009 71,328 71,701 18,320 Depreciation -38,844-46,956-14,039-25,298-23,524 Net farm income from operations 262, ,458 84, , ,717 Gain or loss on capital sales 10,674 16,088 1,043 5, Average net farm income 273, ,545 85, , ,080 Median net farm income 151, ,960 27, ,265 61,395 Profitability (cost) Rate of return on assets 16.5 % 18.4 % 12.5 % 13.1 % 10.4 % Rate of return on equity 24.2 % 25.2 % 24.1 % 22.7 % 16.3 % Operating profit margin 34.0 % 36.0 % 32.9 % 31.5 % 25.8 % Asset turnover rate 48.7 % 51.0 % 38.0 % 41.6 % 40.2 % Liquidity & Repayment (end of year) Current assets 456, , , , ,543 Current liabilities 222, , , , ,457 Current ratio Working capital 234, ,973 67, ,520 37,085 Working capital to gross inc 37.0 % 42.5 % 17.8 % 31.7 % 10.5 % Term debt coverage ratio Replacement coverage ratio Solvency (end of year at cost) Number of sole proprietors Total farm assets 1,355,383 1,599, ,084 1,278, ,237 Total farm liabilities 573, , , , ,215 Total assets 1,526,833 1,807, ,697 1,435, ,098 Total liabilities 611, , , , ,716 Net worth 915,624 1,165, , , ,381 Net worth change 199, ,118 72, ,715 55,827 Farm debt to asset ratio 42 % 37 % 62 % 51 % 57 % Total debt to asset ratio 40 % 35 % 60 % 46 % 54 % Nonfarm Information Net nonfarm income 39,525 49,967 30,076 22,818 24,148 Farms reporting living expenses Total family living expense 47,146 52,472 26,982 45,561 23,982 Crop Acres Total acres owned ,058 Total crop acres 1,797 2, ,517 1,052 Total crop acres owned Total crop acres cash rented 1,201 1, Total crop acres share rented