TECHNOLOGY AND INNOVATION MEETING
|
|
|
- Andrea McDowell
- 5 years ago
- Views:
Transcription


1 International Irrigation General and Territory Sales Managers TECHNOLOGY AND INNOVATION MEETING May 8 12, 2017 Valley, NE CIRCLES Rich Berkland


2 Top Fifteen: World Irrigation 325 Million Hectares India 62.0 China 60.0 USA 24.7 Pakistan 19.1 Iran 8.6 Indonesia 6.7 Mexico 6.5 Turkey 5.7 Bangladesh 5.2 Thailand 4.7 Vietnam 4.6 Russia 4.5 Brazil 4.4 Uzbekistan 4.3 Egypt 3.7 Others 45% Pakistan 7% USA 8% India 21% China 19% Source: ICID Annual Report
3 DEMOGRAPHICS 570,000,000 FARMS IN THE WORLD 84% ARE LESS THAN 2 HECTARES 1% ARE MORE THAN 50 HECTARES 61% OF THE POPULATION IN SUB-SAHARA AFRICA ARE FARMERS 25% OF THE POPULATION OF INDIA ARE FARMERS 21% OF THE POPULATION OF CHINA ARE FARMERS <2% THE POPULATION OF THE USA ARE FARMERS 76% OF THOSE LIVING IN EXTREME POVERTY IN THE DEVELOPING WORLD LIVE IN RURAL AREAS Source: FAO Data 3

4 Percentage of Income Spent on Food 4

5 World Population Projections 5

6 Undernourished Worldwide Source: FAO Statistics Division (ESS) 6

7 Production Irrigated Land vs. Dry Land 100% 80% 60% 50% 75% 50% 25% Dry Land Irrigated Land 0% 20% 40% 50% Harvested Land/Area Production Value of Production Source: Christofidis, Demetrios (2005). Ministerio da Agricultura, Brasil, and FAO 7


8 πr 2 = Area of a Circle 100 Meter Radius = 3 hectares 200 Meter Radius = 12 hectares 300 Meter Radius = 28 hectares 400 Meter Radius = 50 hectares 500 Meter Radius = 78 hectares Source: Valmont Irrigation 8
9 Cost Per Hectare (installed with water supply) Source: Kansas State University, (2012) 9
10 Hectares Irrigated by Method - USA Hand Move 3% Traveler 1% Permanent 3% Side Roll 3% Hand Move 3% Traveler 1% Permanent 3% Side Roll 3% Hand Move 2% Traveler 1% Permanent 2% Side Roll 3% Hand Move 2% Traveler 1% Permanent 2% Side Roll 3% Drip 4% Drip 6% Drip 7% Drip 9% Flood 50% Pivot/Linear 35% Flood 43% Pivot/Linear 41% Flood 39% Pivot/Linear 46% Flood 31% Pivot/Linear 52% 1997 (20M Ha.) 12% of Cropland 2002 (21 M Ha.) 12% of Cropland 2007 (22M Ha.) 14% of Cropland 2012 (22M Ha.) 14% of Cropland Source: 1998, 2003, 2008, 2012 Farm and Ranch Irrigation Surveys USDA, National Agricultural Statistics Service 10

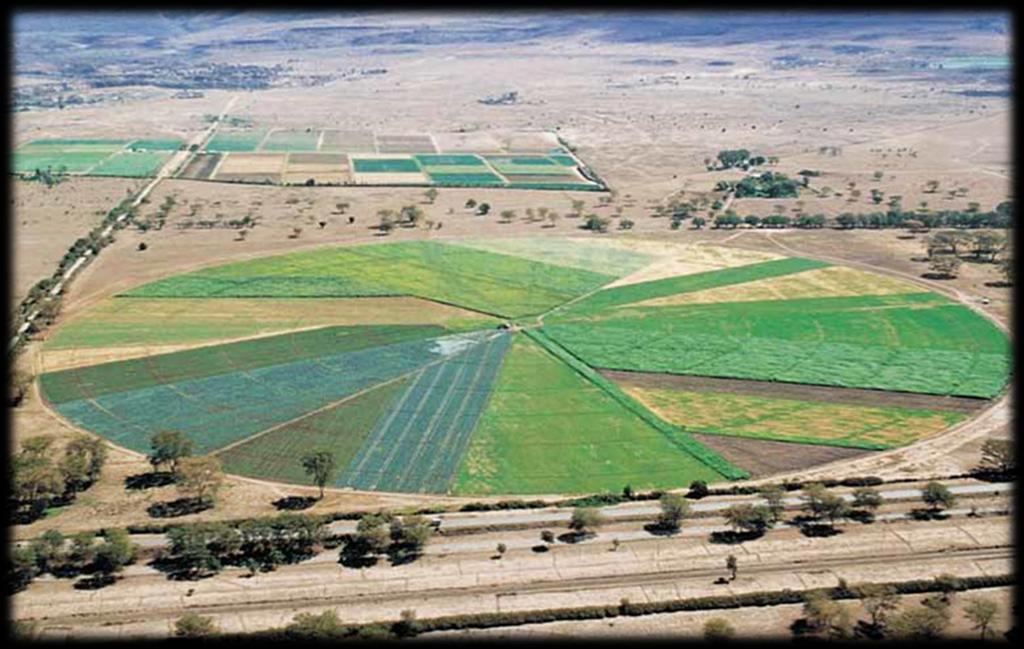
11 Multi-User Pivot Kenya 11
12 Introducing the Shared-Pivot Concept The goal is to demonstrate how smallholder farmers can dramatically increase net household income by farming under Center Pivot irrigation, with: Technology: Use of modern methods in irrigation, seeds, tillage, fertilizer, and pest control. Finance: Flexible, affordable credit and opportunity to build equity. Market Linkage: Access to local, regional, and export markets. Institutional Support: Empowering farmers and their communities. 12


13 Pivot Map 56 Total Hectares/8 Sectors 7 Hectares Per Sector 13

14 CRITICAL ELEMENTS UNFUNDED INSTITUTIONAL SUPPORT Commercial Production Teams Community engagement and empowerment Savings groups WASH programming Partnership facilitation Site water and soil analysis Water extraction impact Monitoring and reporting Technical support Local academic collaboration Best Practices Modern Technology Institutional Support Value Chain Provider Financing MARKET FUNDED VALUE CHAIN PROVIDER Crop plan Market assessments Farm management Transport Crop storage / Cold chain Market engagement Mechanization Irrigation scheduling Irrigation management FINANCING ENTITY Medium-term loan (5 years) for irrigation equipment Seasonal credit for crop inputs Payments to be made in kind from production delivered VALMONT Site selection Irrigation and pump equipment Training, service and support of equipment once installed Site water & soil analysis Spare parts Technical consultation 14


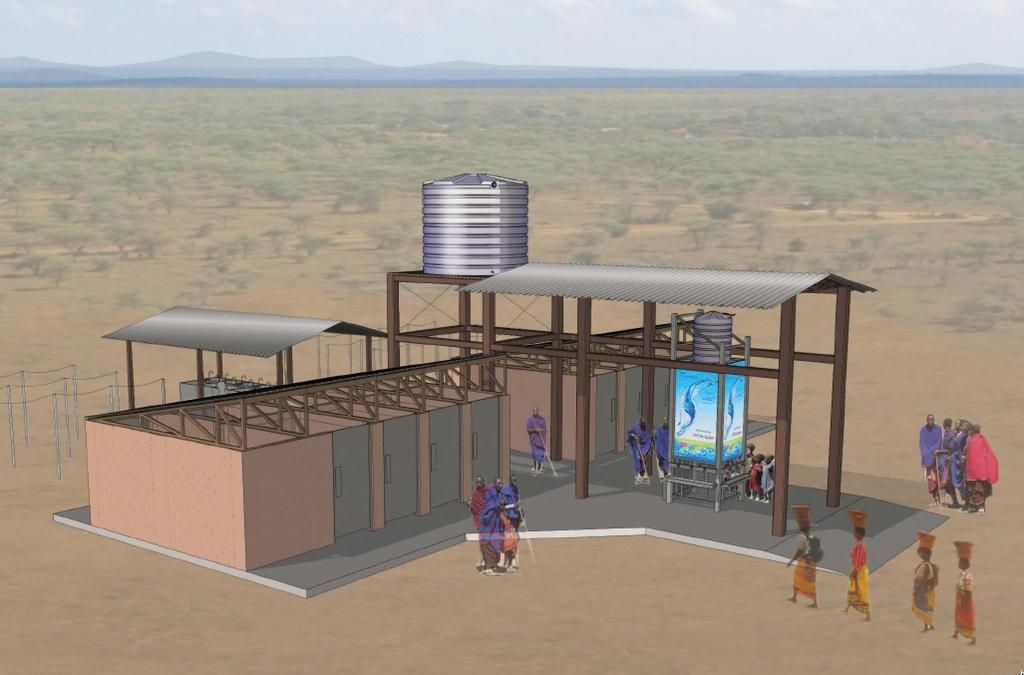
15 Community Water System 15

16 16
17 Projects with Smallholder Production Groups Sharing Pivots COUNTRY PROJECT NAME NUMBER OF PIVOTS GHANA Holstein 2 GHANA VegPro 1 GHANA Babator 4 GHANA IWAD 4 NIGERIA Alliance Agriculture 100 TANZANIA Dodoma 1 RWANDA Matiba 4 RWANDA Lake Nasho 62 RWANDA Kagitumba 37 17