Update 1: Planter vs Drill Trial Mitchell ON
|
|
|
- Edward Melton
- 5 years ago
- Views:
Transcription


1 June 13, 2018 Update 1: Planter vs Drill Trial Mitchell ON A soybean trial has been established near Mitchell ON, on Heavy Textured Soil. The farm is mostly well drained Huron Silt Loam, with pockets of Perth Silt Loam, and Brookston Silt Loam. The Syngenta S07- M8 Soybeans were planted on May 17 & 18, The plot was planted using both a John Deere 750 Seed Drill, and a John Deere Row split 24 planter. We planted the field in 120ft wide treatments, giving us 5 treatments with the drill, and 5 treatments with the planter. One of the treatments was planted on the 17 th, and the other 4 were planted on the 18 th. The drill remained constant with a target of 170,000 sds/ac, and maximum applied downforce. With the planter treatments, we replicated 150,000 and 170,000 sds/ac treatments. Two downforce treatments were applied on the soybean plot, 450lb Static Applied Downforce, and 300lb Margin Active downforce. Figure 1: Implements Used for Planting the Trial. A Row Split 24 Planter, and a John Deere 750 Drill The field would be considered no-till, with corn stalks being chopped the previous harvest. Consequently, with the residue scenario and heavy soil type, conditions would be considered tough. There was a very significant amount of residue hair pinning caused by the implements as they were pulled through. Even though our planter had unit mounted wavy coulters, in these conditions there would have been an advantage to having row cleaners on our planter or drill. Further, the corn stalks were chopped the previous season. If the stalk wasn t chopped there may have been more standing residue, leaving the inter-row space cleaner for our soybean planting. Initially we started our planter with Active downforce and 150 lb of margin. We quickly realized that the applied downforce was not enough to maintain acceptable ground contact. 1


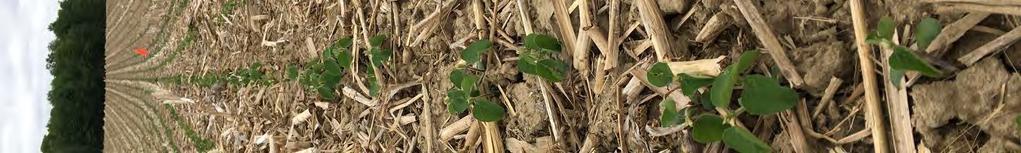
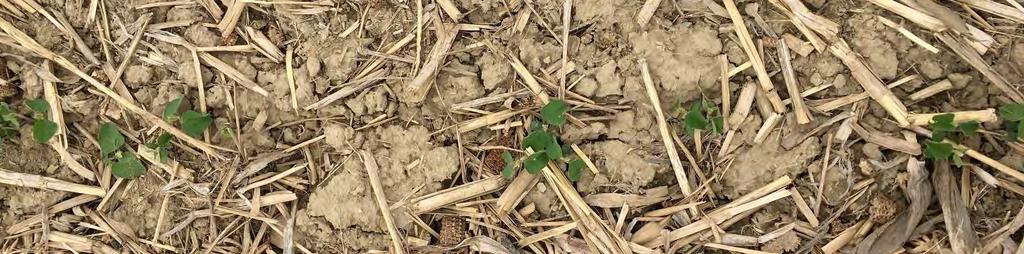
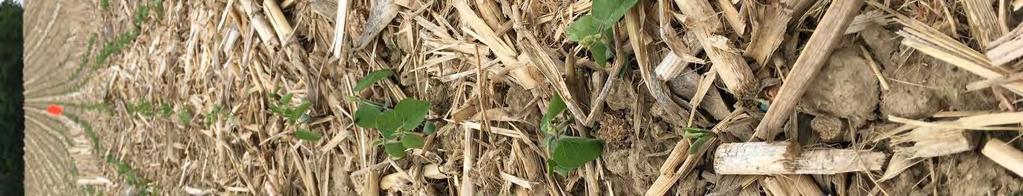
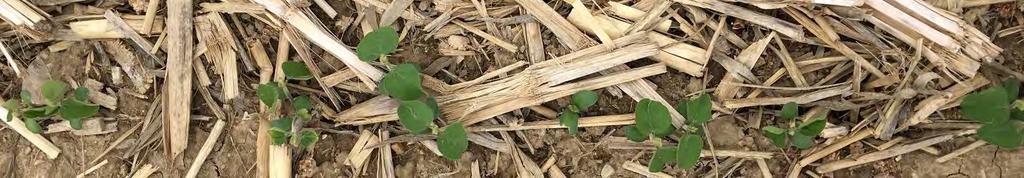
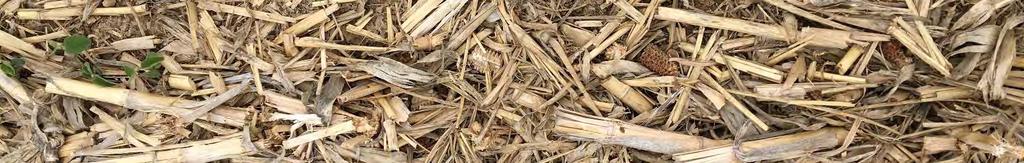
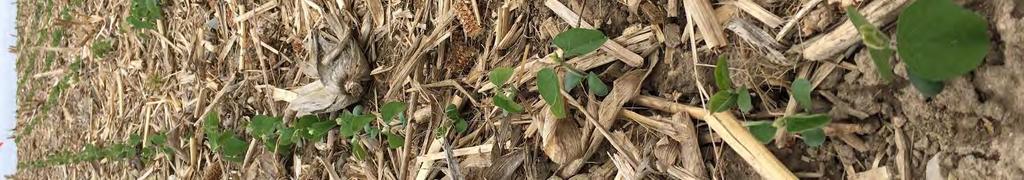
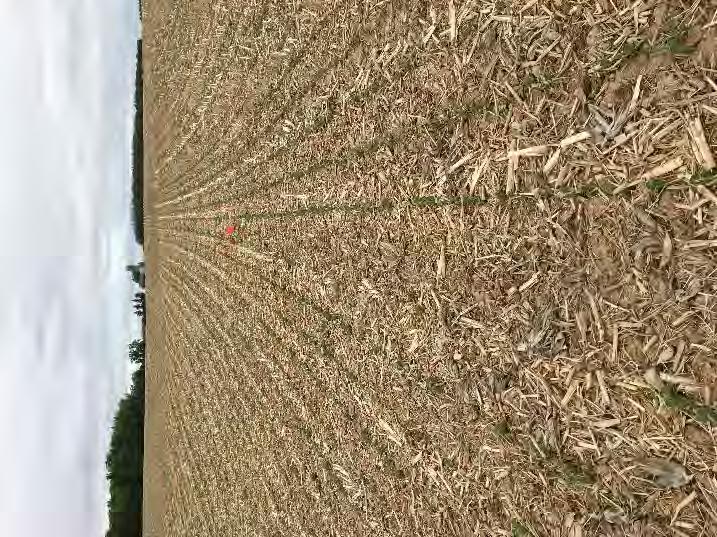
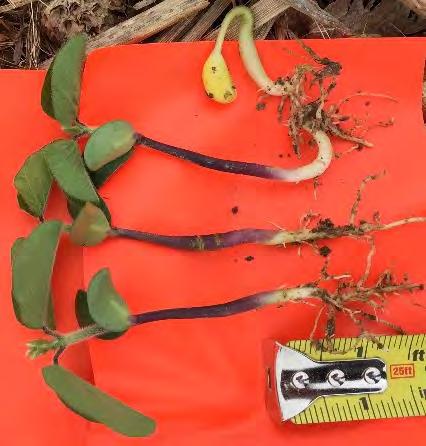
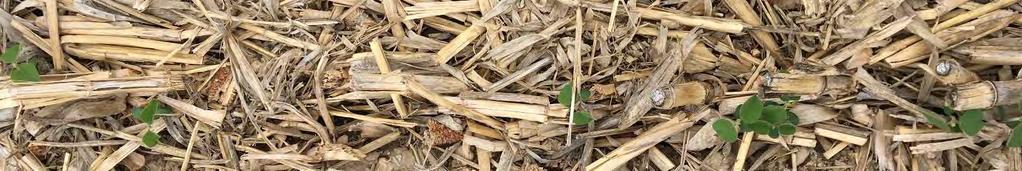
2 June 13, 2018 Figure 2: Crop Residue Conditions on Planting Date, and visible beans on surface where thick residue accumulation existed preventing proper seed placement After planting we returned to the Field on May 30 th to evaluate the plant stand. At this point the field was still in preliminary stages of emerging. Many beans still fighting to work their way out of the ground. Figure 3: May 30, Beans fighting to emerge through crusted soils and heavy residue. We again returned to the Field on June 6 th to conduct a more thorough evaluation of population stands over the various treatments. At this time we counted side by side comparisons of the drilled treatments to the planting treatments at the guess rows between the two passes. This allowed for a fair comparison side by side ensuring the most similar topographical and soil conditions possible. Photos of the side by side comparisons are attached in Appendix 1. 2

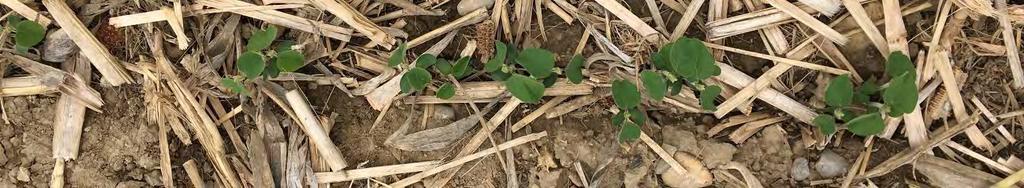
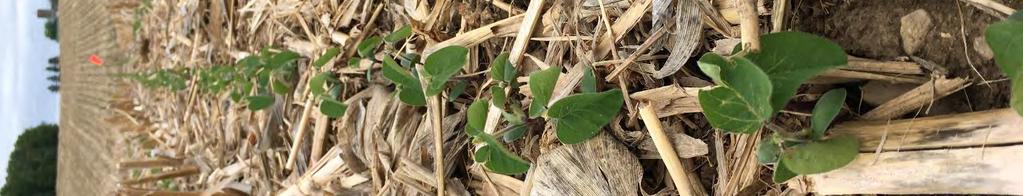
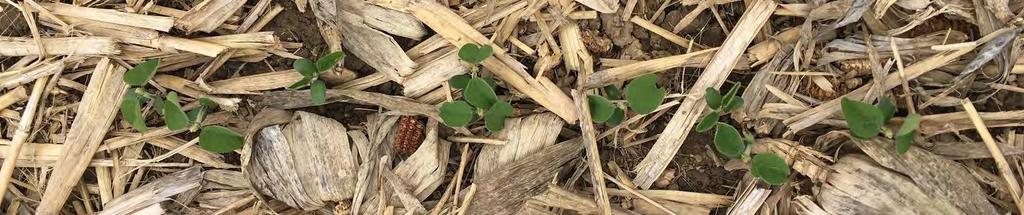
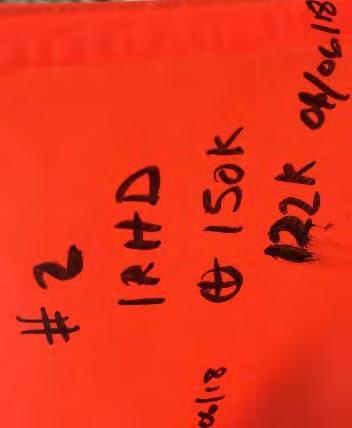
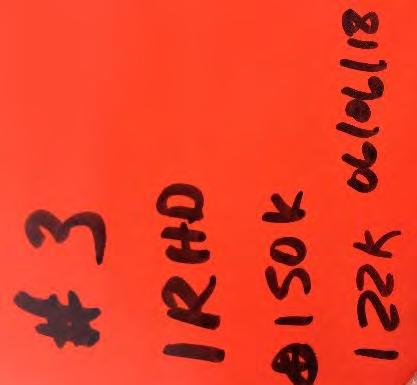
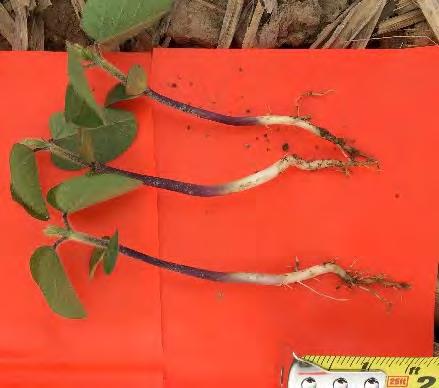
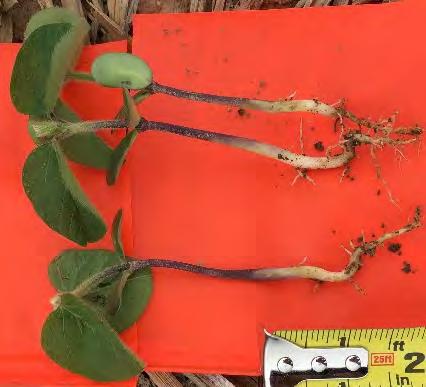
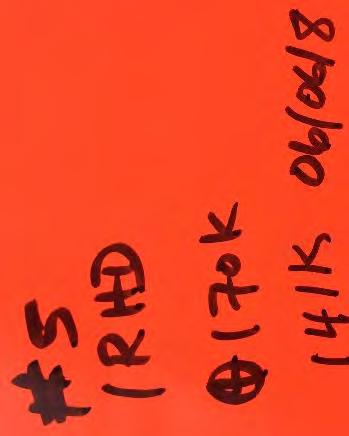
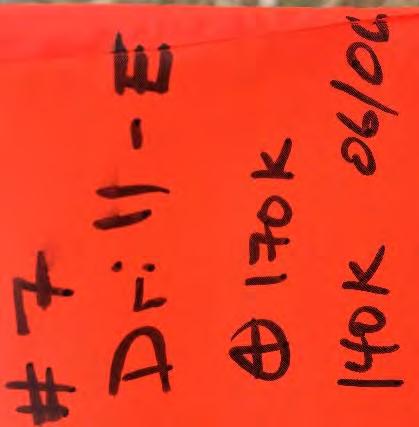
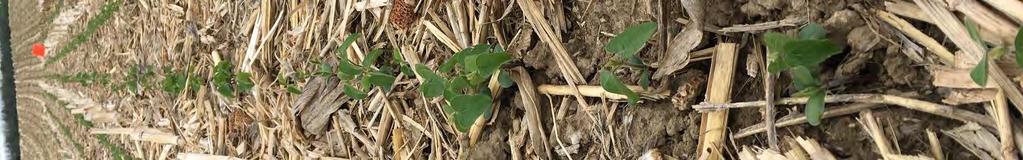
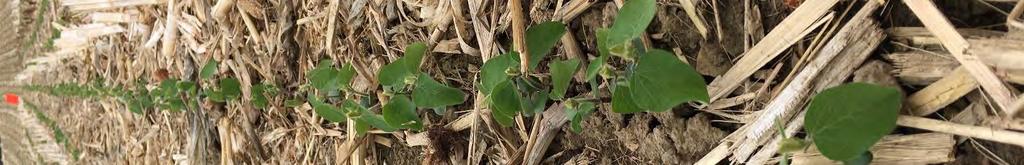
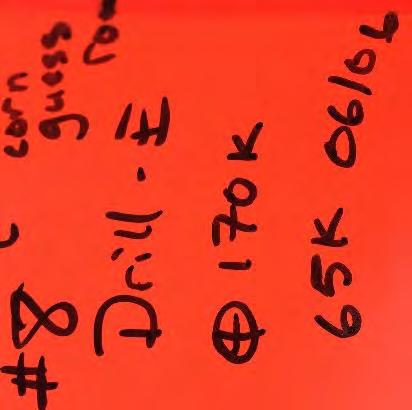
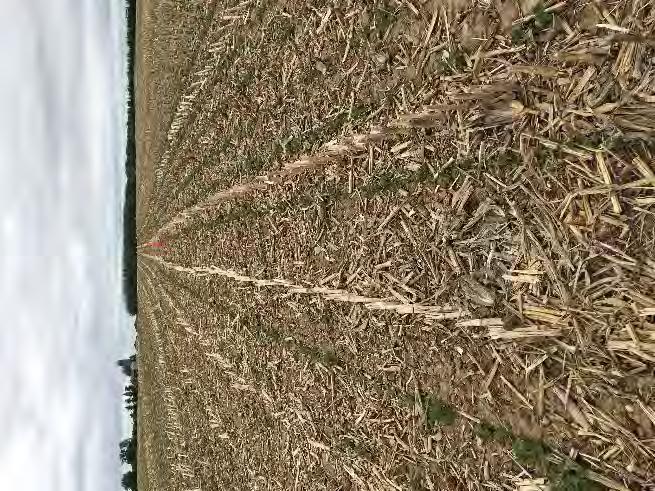
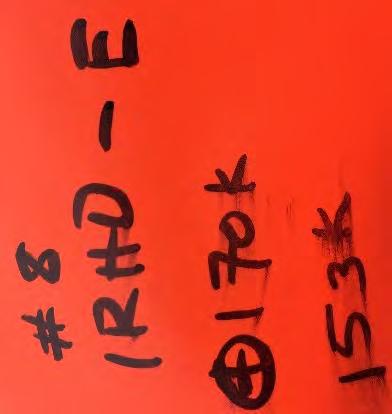
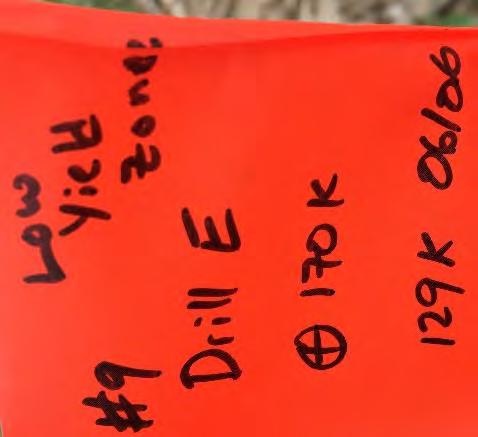
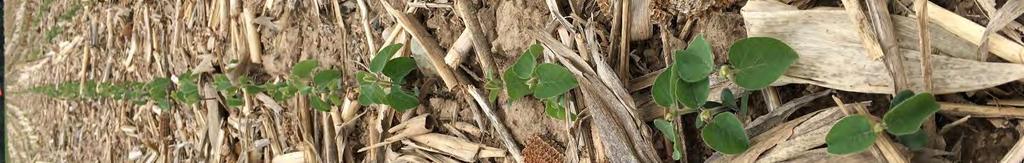
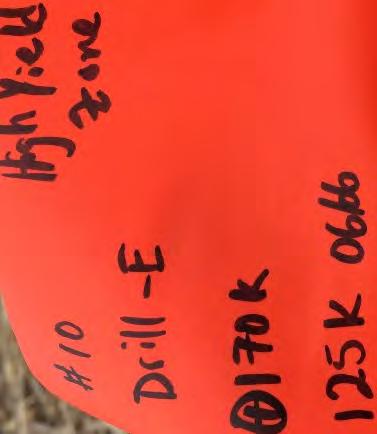
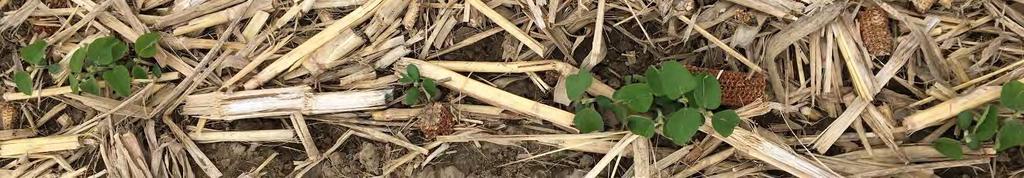
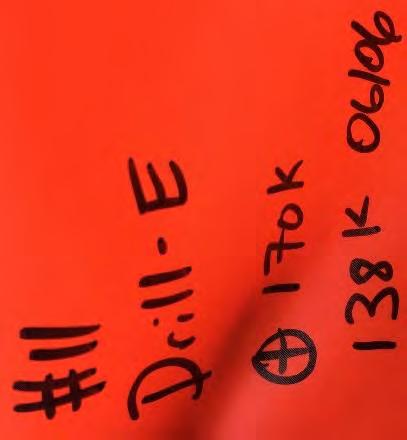
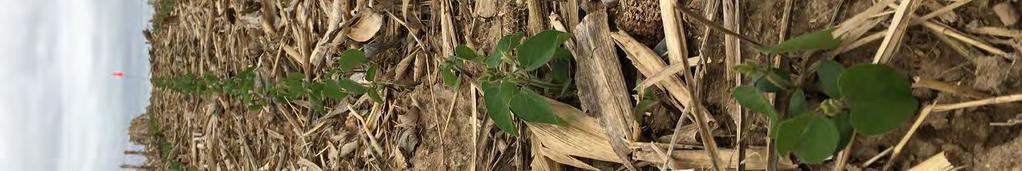
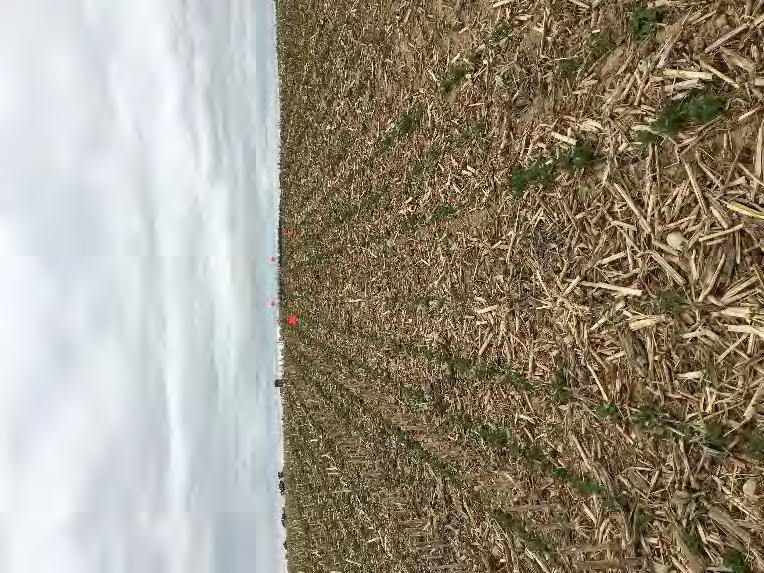
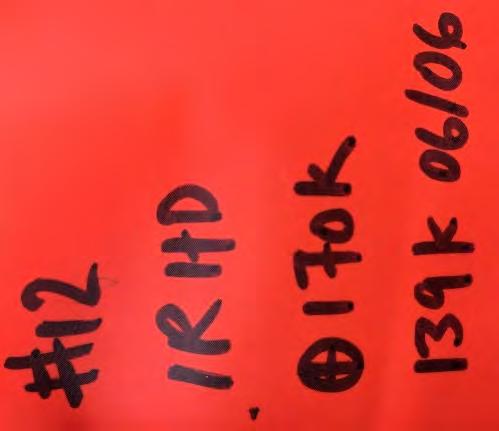
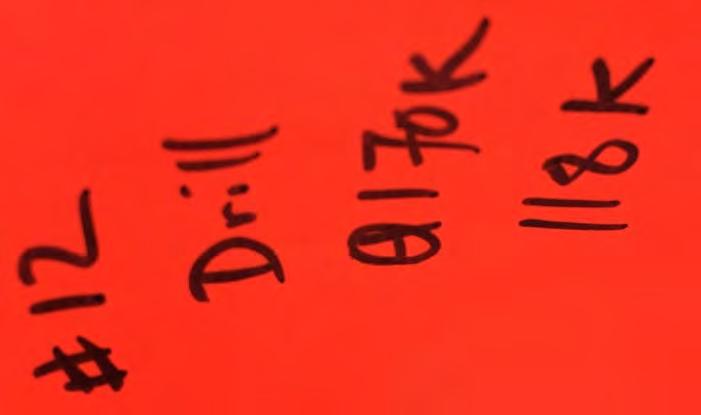
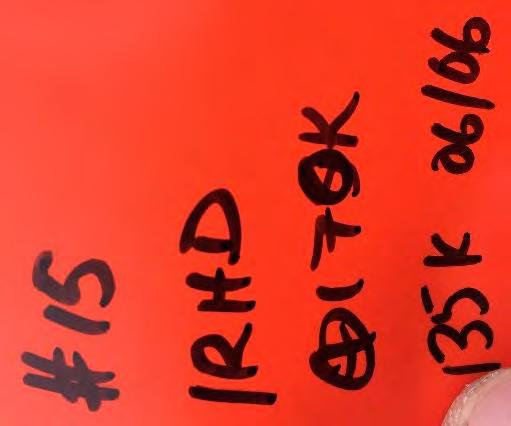
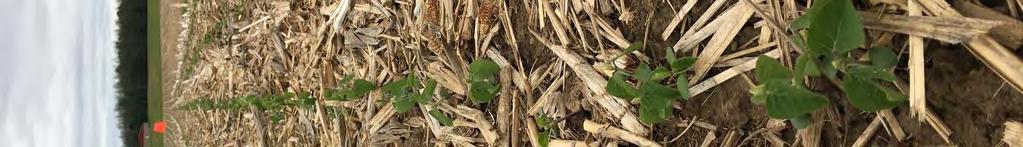
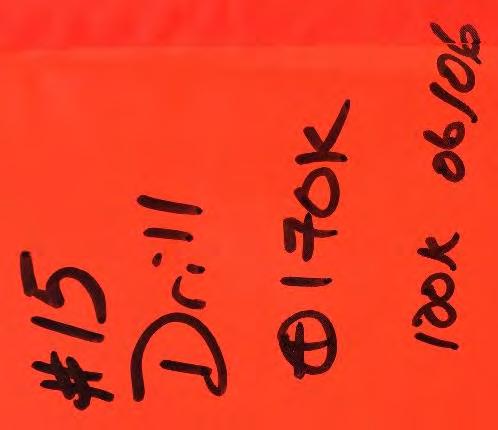
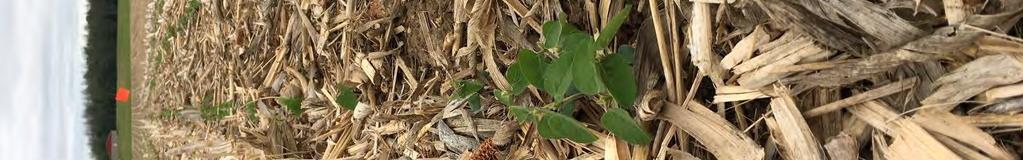
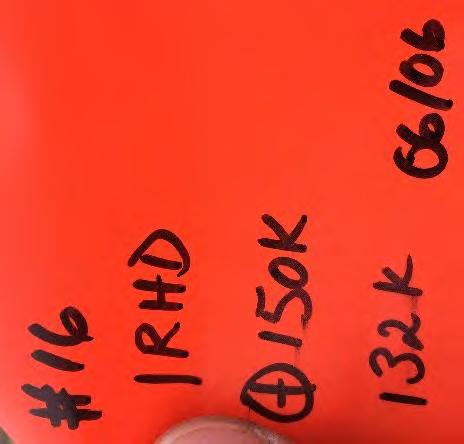
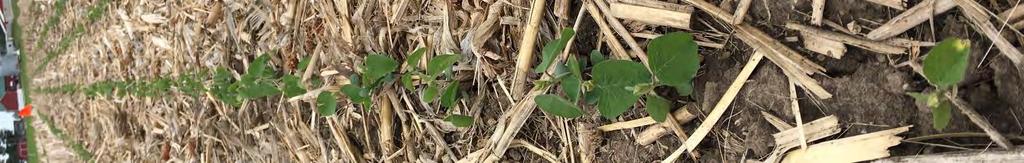
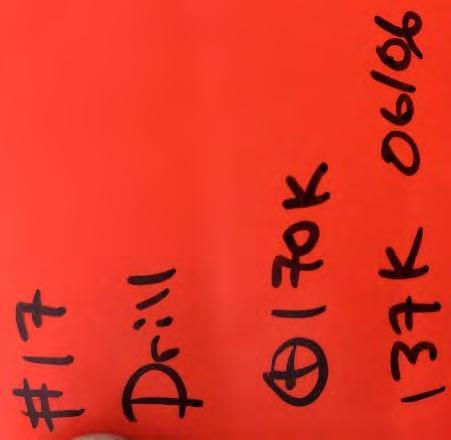
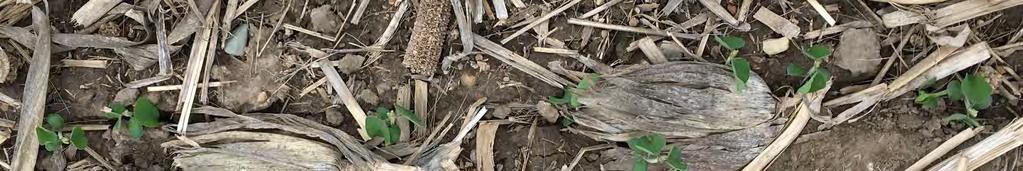
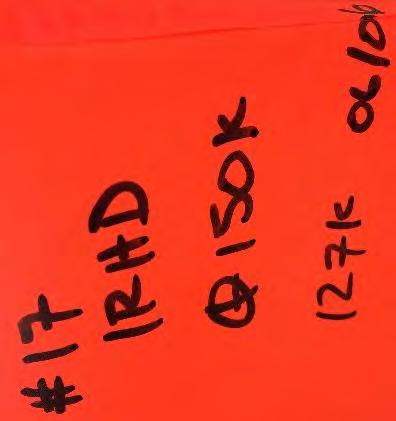
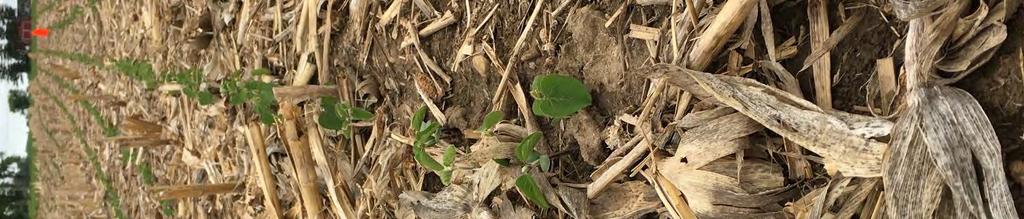
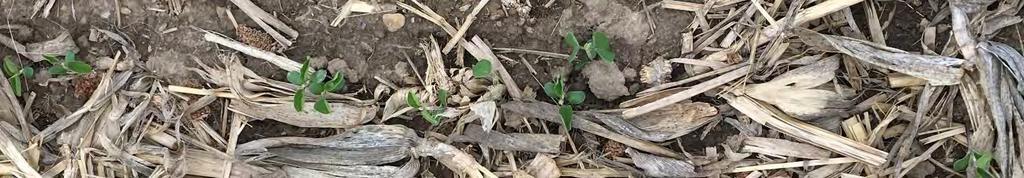
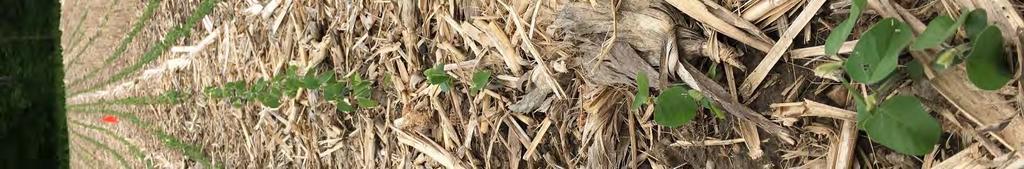
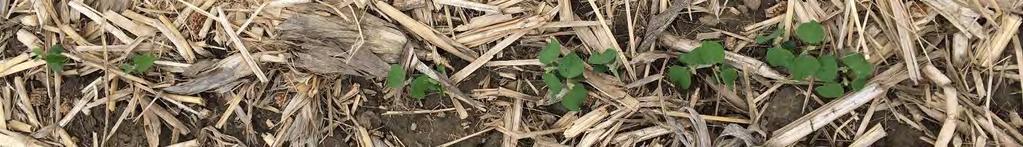
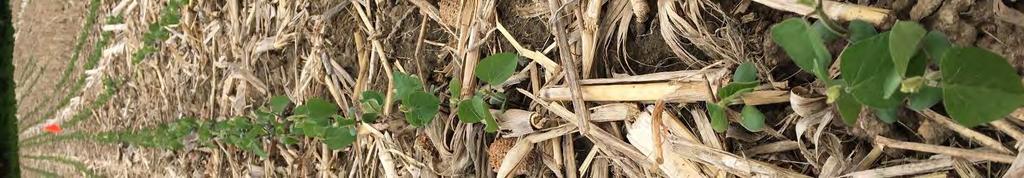
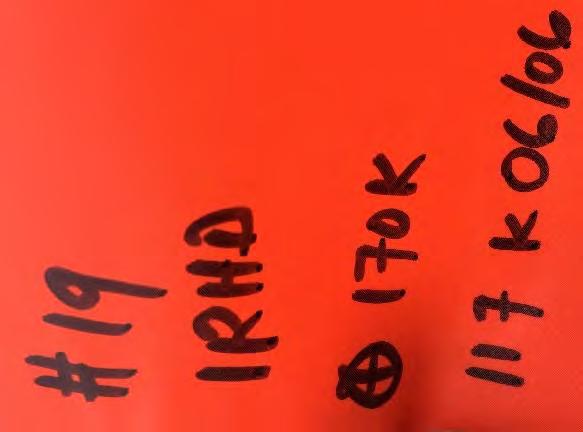
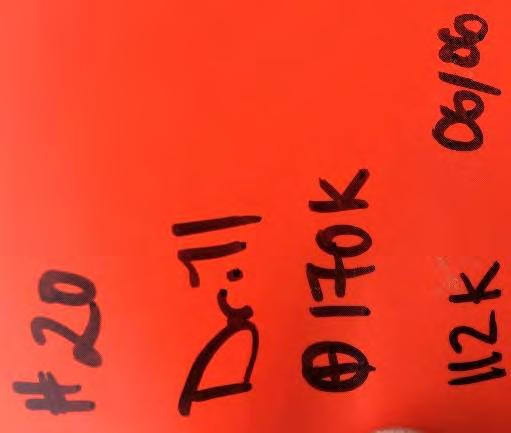
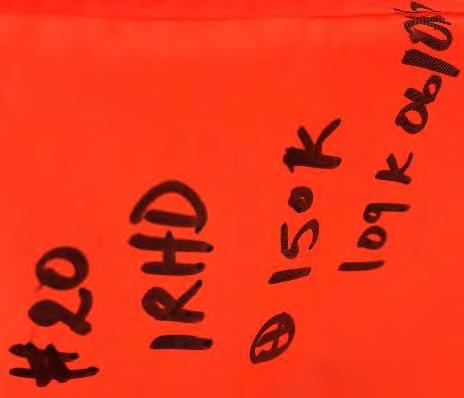
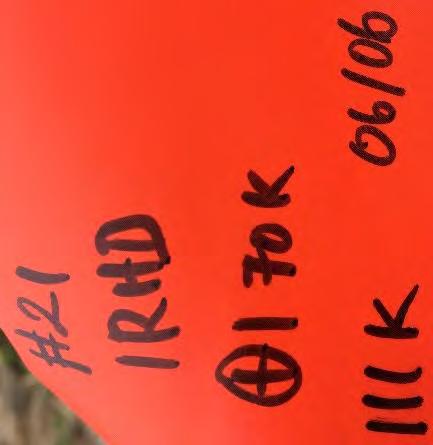
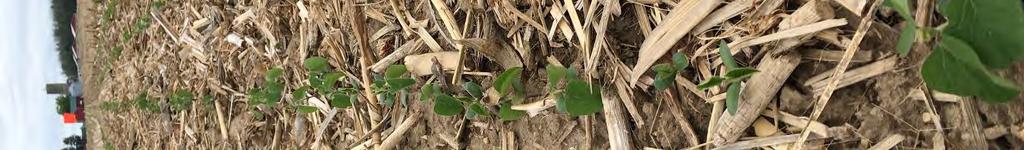
3 June 13, 2018 Figure 4: Example of Side by Side Comparison of two treatments. The Orange photo shows the Treatment Type, the target rate applied, and the actual plants emerged on June 6. The first vertical photo is along the row, and the second photo is a bird s eye view showing spacing between plants. The drill treatments are shown on the left, and the individual row hydraulic downforce (IRHD) are shown on the right. Population measurements were acquired at various locations across the field to account for different slope positions, and yield potential zones to give a representative sample. Slope position can be visualized in Figure 5, using the topographical map, overlaid by sample position. Further, Figure 6, provides a visual of the sample locations in relation to yield potential zones. These yield potential zones were derived by conducting a multi-year average of 3 yield maps from The yield potential is normalized to represent a value from 0-100%, with 100% being the highest possible yield in that field based on historic data. 3
4 June 13, 2018 Figure 5: Topographical Map of Field. Dark Blue Lines are Primary Contours in 5ft Intervals, and Light Blue Secondary Contours in 2.5ft Intervals. The Red dots represent sample locations of Stand Counts. 4

5 June 13, 2018 Figure 6: Normalized Yield Zones in Field. High Yield in Green, Medium in Yellow and Low Yield in Red. Sample points for stand counts are black dots overlaid on Map. Overall, 21 observation points were observed. At 13 of the observation points the 1795 planter outperformed the drill, and on 7 observation points the drill outperformed the planter. Across all measurements taken, we observed 71.2% seeds emerged by the drill, and 76.5% emerged using the planter. The S07-M8 soybeans planted were certified seed with warm germination rates equal to 85%. Consequently, ~14% of the seeds in drilled treatments, and ~8.5% in the planted treatments did not emerge based on poor seed placement due to residue, or soil crusting. We do not have specific evidence to suggest, but anecdotally based on our observations the 750 seed drill was loaded with a fill auger and caused soybean seed to split to some extent. Whereas, the 1795 planter was loaded with a belt conveyor, causing no seed damage. The split beans could account for some of the seed emergence difference as well. Some site-specific observations were made to provide context to the stand counts: #1 High Residue for IRHD caused lower emergence #3 Low Yield Zone Good Emergence 5
6 June 13, 2018 #5 High Residue/Proximity to Corn Row caused lower emerge on Drill #8 Drill was planting on corn row very low emergence #9 Low Yield Zone Gravelly/Heavy Good Emergence #10 High Yield Zone Loamier Good Emergence #11 Shoulder of Slope Good Emergence #15 High Yield Zone Gaps in Drilled Soybean Treatment % Seed Emerged Active Static Active Active Static Static Active Active Active Static Static Static Active Active Static Active Static Active Active Static Active Sample Location ID Normalized Yield Potential (%) Yield Potential 750 Drill 1795 Planter Figure 7: % Seed Emerged for both 750 Drill, and 1795 Planter (Primary Axis). Yield Potential Zone based on historic yield data indicated (Secondary Axis), 100% yield potential is the highest yield possible in the farm. Active or Static Downforce Treatment is also indicated, this is specific to the 1795 planter, the drill had a constant downforce throughout. There are a few conclusions which can be drawn out of this information. One of the most straightforward conclusions is that planting on corn rows results in poor emergence. This highlights the advantages of guidance, and using AutoTrac Guidance effectively. Not only in your soybean planting, but also in your corn planting as well to eliminate guess rows. Additionally, we can concluded that the planter performed slightly better, providing more consistent emergence. This was verified by stand counts as well as observations made within row visually. It can be concluded, as expected, that the planter results in more even crop stand with less gaps. It will be interesting to evaluate as the year goes along how these gaps fill in, especially since the S07-M8 are a very tall bean, with very little bushing. It will also be interesting to follow the crop to yield to evaluate the effect of emerged population. 6
7 June 13, 2018 Figure 8: Spatial Representation of Plant Stand Counts. Map on the Left is 1795 Planter, and Map on the Right is the 750 Drill Danny Jefferies, CCA Integrated Solutions Data & Agronomy Support Consultant
8 June 13, 2018 APPENDIX 1: Plant Stand Evaluation 8


9

10


11


12


13


14


15


16


17


18

19


20


21


22
23


24

25


26


27


28


29