2019 Corn & Soybean Market Outlook
|
|
|
- Beverly Foster
- 5 years ago
- Views:
Transcription
 U.S. Economy Strong U.S. GDP, but fears of inflation")
1 2019 Corn & Soybean Market Outlook Lunch & Learn Meeting, Tonganoxie, Kansas February 20, 2019 DANIEL O BRIEN EXTENSION AGRICULTURAL ECONOMIST 2019 Corn & Soybean Market Drivers 1) U.S. Economy Strong U.S. GDP, but fears of inflation
2 2 nd Qtr rd Qtr 2018
 U.S. Economy Strong U.S. GDP, but fears of inflation 2) 2019 South America Crop Production Prospects Dry in Brazil - Soybeans,?")
3 U.S. Fed: Bank Prime Loan Rate Changes 1950 through November 1, 2018 August % Rate July % Rate Dec % Rate Oct % Rate Jan % Rate 2019 Corn & Soybean Market Drivers 1) U.S. Economy Strong U.S. GDP, but fears of inflation 2) 2019 South America Crop Production Prospects Dry in Brazil - Soybeans,??? Corn (1 st vs 2 nd Crop) Preliminary #s Brazil 2019 down from 120 to mmt?


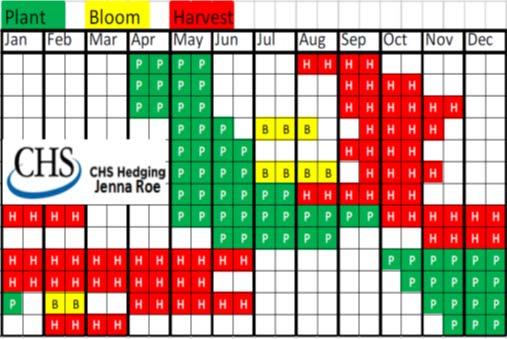
4 Monthly Crop Calendar for Corn Monthly Crop Calendar for Soybeans Sources: USDA, AMIS, & CHS, Inc.
 Preliminary #s Brazil 2019 down from 120 to 110-115 mmt? 3) 2019 U.S. Corn & Soybean Acres Narrative Soyb U.S. Soybean Acres Down 6.5+ mln acres USDA Narrative Corn U.S. Corn Acres UP 3 to 4 mln acres+ BUT now So.")
5 2019 Corn & Soybean Market Drivers 1) U.S. Economy Strong U.S. GDP, but fears of inflation 2) 2019 South America Crop Production Prospects Dry in Brazil - Soybeans,??? Corn (1 st vs 2 nd Crop) Preliminary #s Brazil 2019 down from 120 to mmt? 3) 2019 U.S. Corn & Soybean Acres Narrative Soyb U.S. Soybean Acres Down 6.5+ mln acres USDA Narrative Corn U.S. Corn Acres UP 3 to 4 mln acres+ BUT now So. America, U.S.-China, Plantings U.S. may change that U.S. Soybean Acreage


6 U.S. Corn Acreage Corn Markets
7 U.S. Corn Supply-Use 2018 U.S. Corn & Sorghum Production 2017 Crops Large Corn Stocks are limiting Feedgrain Price$ s Low Price$ s supporting New Crop MY 2018/19 Corn Use o Ethanol 2018/19 = bln bu (Near record vs bb last year) o Livestock Feed 2018/19 = bln bu (< bb in MY 2016/17 11 yr high) o Exports 2018/19 = bln bu (vs bb in 17/18 & in 15/16) o Other FSI 2018/19 = bln bu (Record high vs bb last 2 years) Corn Production Cost & Profits Non-Irrigated Corn Enterprise Records Northeast KS Kansas Farm Management Association


8 Non-Irrigated Corn in Northeast Kansas KFMA Enterprise Records: Years Years Year 2017 Number of Farms 29 farms 28 farms Yield /acre bu/ac bu/ac Gross Income /acre $510 /ac $402 /ac Variable Cost /acre $401 /ac $376 /ac Total Expense /acre $562 /ac $527 /ac Gross Income /bushel $4.58 /bu $4.00 /bu Total Expense /bushel $5.05 /bu $5.24 /bu
9 Non-Irrigated Corn in NE Kansas Corn Sales & Other Revenues $/Bu $/Acre 2017 $/Bu 2017 $/Acre Corn Sales $3.97 /bu $442 /ac $3.20 /bu $322 /ac Other Income $0.61 /bu $68 /ac $0.79 /bu $80 /ac Total Income $4.58 /bu $510 /ac $4.00 /bu $402 /ac Non-Irrigated Corn in NE Kansas Variable, Fixed, & Total Costs $/Bu $/Acre 2017 $/Bu 2017 $/Acre Variable Costs $3.60 /bu $401 /ac $3.74 /bu $376 /ac Fixed Costs $1.45 /bu $161 /ac $1.50 /bu $151 /ac Total Costs $5.05 /bu $562 /ac $5.24 /bu $527 /ac
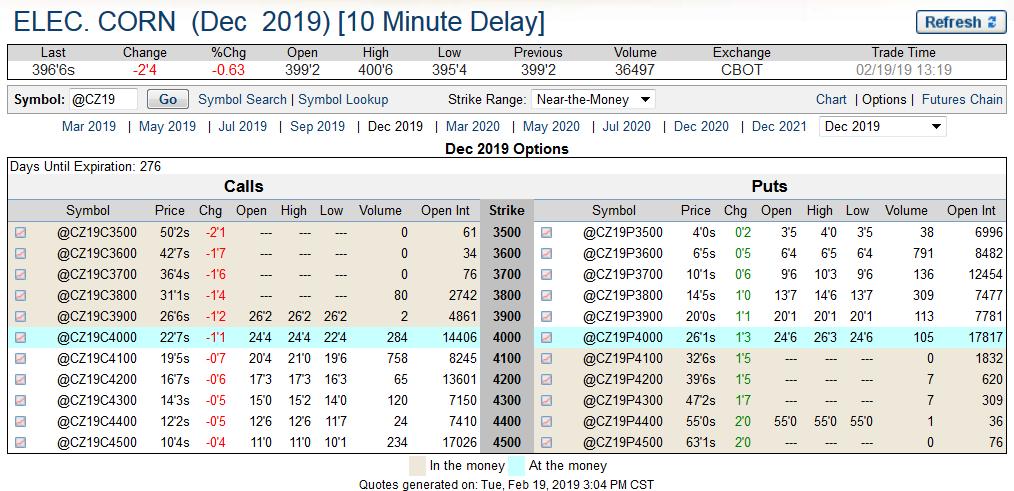
10 Non-Irrigated Corn in NE Kansas Total Costs & Net Returns $/Bu $/Acre 2017 $/Bu 2017 $/Acre Total Costs $5.05 /bu $562 /ac $5.24 /bu $527 /ac Net Returns to Management Net Returns to Labor + Mgmt ($0.47) /bu ($52) /ac ($1.25) /bu ($125) /ac +$0.18 /bu +$20 /ac ($0.53) /bu ($53) /ac Corn Futures Monthly Chart: August 2005 to Feb. 19, 2019 $8.43 ¾ MARCH 2019 $3.69 ¾ 2/19/2019 $4.12 ¼ $3.70 $3.00 $3.18 ¼ $3.01 $3.28 ½
11 Corn Futures Weekly Chart: Winter 2017 to Feb. 19, 2019 $4.37 MARCH 2019 $3.69 ¾ 2/19/2019 $3.91 $3.70 $3.72 $3.52 $3.45 ½ Corn Futures Price & Volatility History for Revenue Insurance DEC Corn Futures Prices $7.00 $5.00 $3.00 $1.00 ($1.00) ($3.00) $1.27 $1.26 $1.13 $0.78 $0.39 $0.47 $0.40 $0.16 $0.30 $0.48 $0.32 $0.32 $0.37 $0.47 $0.28 ($0.20) ($0.44) ($0.31) ($1.47) ($1.82) Planting$ Harvest$ Planting$ Less Harvest$
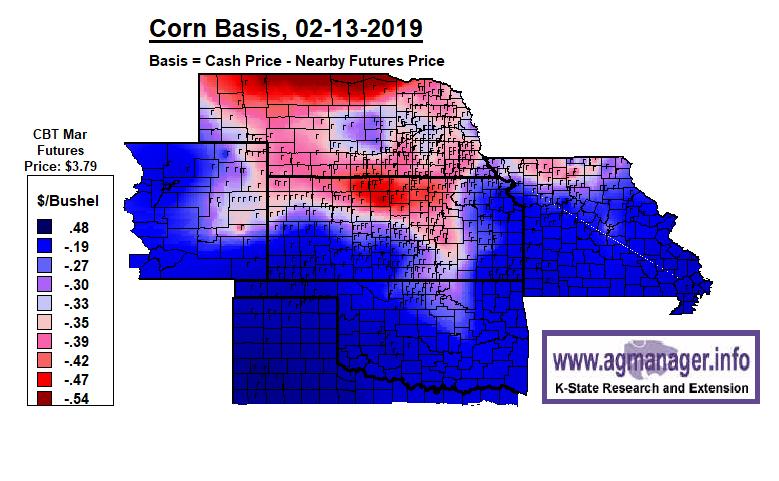
12 Corn Price & Volatility History for Revenue Insurance DEC Corn Futures Prices $8.00 $7.00 $6.00 $5.00 $4.00 $3.00 $2.00 $1.00 $0.00 $3.03 $2.83 $2.40 $2.51 $2.46 $2.52 $2.42 $2.32 $2.59 $2.32 $4.06 $6.32 $7.50 $5.40 $5.46 $6.01 $5.65 $5.68 $4.62 $4.04 $4.15 $3.86 $3.96 $3.96 $ % 30% 37% 28% 29% 20% 14% 21% 20% 18% 20% 21% 21% 23% 22% 20% 19% 21% 17% 19% 15% 10% 0% 150% 140% 130% 120% 110% 100% 90% 80% 70% 60% 50% 40% 30% Price Volatility (%) Planting $ Harvest $ Volatility Corn Cash & Futures $ s Tonganoxie, KS Local Elevators February 19, 2019 Price $/bu $6 $5 $4 $3 $2 $1 $0 $ /mo $0.04 /mo $ /mo $0.02 /mo $3.70 $3.78 $3.86 $3.91 $3.97 $3.75 $3.86 $3.71 $3.47 $3.54 $2.06 $2.31 Futures Low $ High $ Mktg Loan-Finney Co.
13
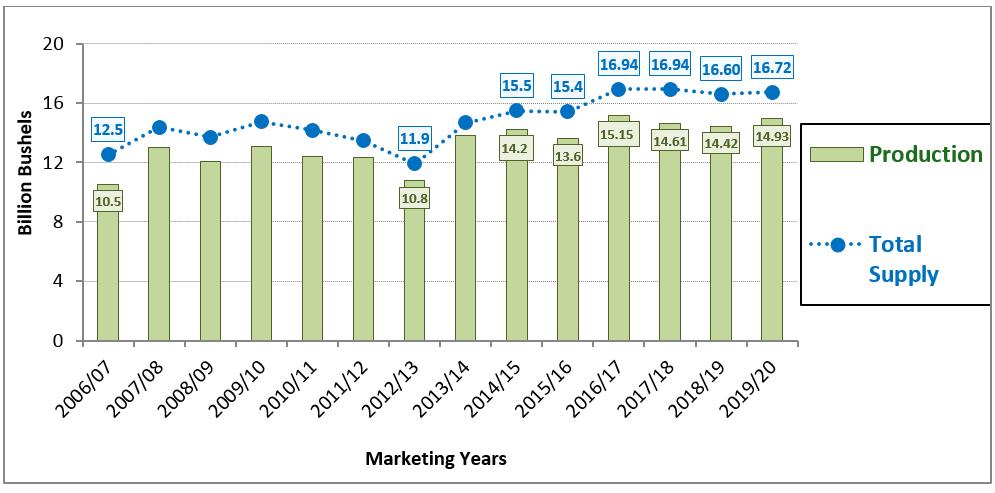
14 U.S. Corn Production & Supplies


15 4) U.S. Corn Usage in Current MY 2018/19 (thru 8/31/2019) Low Ethanol Plant Profitability slower corn bb (2 nd highest on record vs bb in MY 2017/18) U.S bb USDA Feed bb (2 nd highest since 2008/09, bb in 2016/17)


16 U.S. Corn Exports Weekly thru February 14, 2019 U.S. Corn Use Together by Category End Stocks Exports Ethanol Livestock Feed
17 4) U.S. Corn Usage in Current MY 2018/19 (thru 8/31/2019) Low Ethanol Plant Profitability corn bb U.S bb USDA Feed bb 5) Tighter U.S. Corn Stocks & % Ending Stocks-to-Use % Stocks/Use in Current MY 2018/19 Impact of +/ 150 mb in Corn Use? o o bb vs bb U.S. corn ending stocks 10.6% S/U vs 12.8% S/U Swing of +/ $0.25 /bu U.S. Corn Ending Stocks & % Stx/Use % End Stocks-to-Use , , ,731 1, ,293 2,140 1,735 1,529 8,000 7,000 6,000 5,000 4,000 3,000 2,000 1,000 0 Million Bushels Marketing Year
18 6) U.S. Corn Price Outlook USDA $3.60 /bu in Current MY 2018/19 $3.90 /bu in Next Crop MY 2019/20 (+$0.30 /bu vs current) o USDA Forecast for Next Crop MY 2019/20 : million acres planted (vs ma current) bu/ac, (vs bu/ac current) bb Production (vs bb current) bb Ethanol Use (vs bb current) bb Exports (vs bb current) bb Ending Stocks (vs bb current) 10.07% Ending Stocks / Use (vs 11.67% current) U.S. Corn Stocks & % Stocks/Use Corn: Moderate Stocks & % S/U o End Stocks 2018/ bln bu (vs bb last year) o % Stocks/Use 2018/ % S/U (vs 14.5% Stx/Use last year)


19 U.S. Corn % Stocks/Use vs Price$ MY 2006/07 Thru Next Crop MY 2019/20 Including preliminary U.S. Corn Supply- Demand & Prices For Next Crop MY 2019/20 6) U.S. Corn Price Outlook USDA $3.60 /bu in Current Crop MY 2018/19 $3.90 /bu in Next Crop MY 2019/20 (+$0.30 /bu vs current) o USDA 2019/20 : bu/ac, bb, strong Use, bb Stocks 7) Other Market Factors Slow U.S. Grain Sorghum Exports Focus on Domestic Use USDA Market Facilitation Payments (MFP) o o Low for Corn, high for Soybeans - Sorghum (Acres 2019 impact?) New Farm Bill ARC vs PLC Choices..
 Production")
20 U.S. Corn Price$ vs U.S. % Stocks-to-Use MY 1973/74 through Next Crop MY 2019/20 World Corn (Maize) Production Regions


21 World Corn Supply, Use & Stocks Soybean Markets
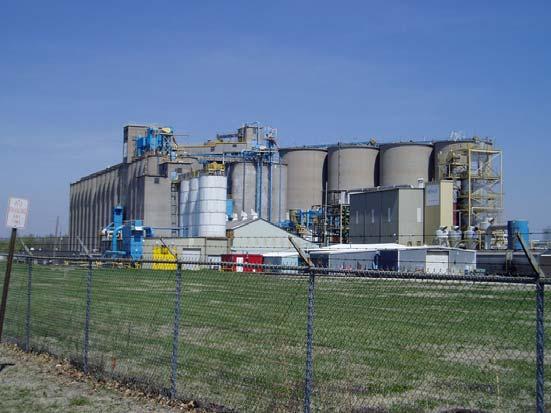
22 U.S. Soybean Market Prospects in 2019 A. U.S.-China Trade Dispute HAS has LIMITED U.S. export shipments & forward purchases & HAS affected U.S. Soybean prices B. USDA forecasts U.S. Exports to be just OK despite Tariffs Foreign buyer switching between U.S. & South America, & some trans-shipments have occurred among countries C. Market Focus in Late Winter-Spring 2019 So. America 2019 crop prospects their response to high 2018 $ s Soybean Production Cost & Profits Non-Irrigated Corn Enterprise Records Northeast KS Kansas Farm Management Association


23 Non-Irrigated Soybeans in NE Kansas KFMA Enterprise Records: Years Years Year 2017 Number of Farms 29 farms 30 farms Yield /acre 47.5 bu/ac 46.6 bu/ac Gross Income /acre $456 /ac $391 /ac Variable Cost /acre $297 /ac $304 /ac Total Expense /acre $428 /ac $426 /ac Gross Income /bushel $11.47 /bu $10.35 /bu Total Expense /bushel $10.77 /bu $11.28 /bu
24 Non-Irrigated Soybeans in NE Kansas Soybean Sales & Other Revenues $/Bu $/Acre 2017 $/Bu 2017 $/Acre Soybean Sales $10.82 /bu $4.30 /ac $9.14 /bu $345 /ac Other Income $0.65 /bu $26 /ac $1.21 /bu $46 /ac Total Income $11.47 /bu $4.56 /ac $10.35 /bu $391 /ac Non-Irrigated Soybeans in NE Kansas Variable, Fixed, & Total Costs $/Bu $/Acre 2017 $/Bu 2017 $/Acre Variable Costs $7.47 /bu $297 /ac $8.04 /bu $304 /ac Fixed Costs $3.30 /bu $131 /ac $3.25 /bu $123 /ac Total Costs $10.77 /bu $428 /ac $11.28 /bu $426 /ac
 /bu ($35) /ac +$1.91 /bu +$76 /ac +$0.31 /bu +$12 /ac Soybean Futures Monthly Chart: $17.")
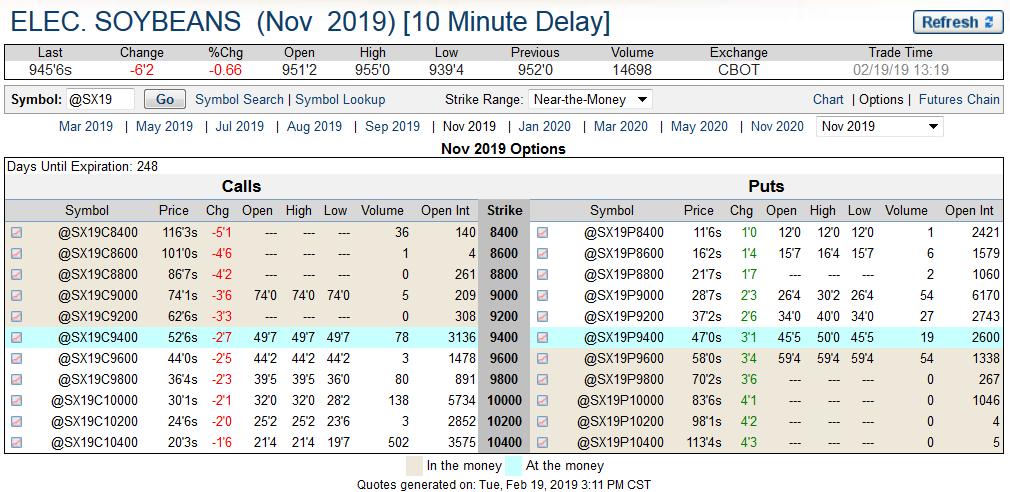
25 Non-Irrigated Soybeans in NE Kansas Total Costs & Net Returns $/Bu $/Acre 2017 $/Bu 2017 $/Acre Total Costs $10.77 /bu $428 /ac $11.28 /bu $426 /ac Net Returns to Management Net Returns to Labor + Mgmt +$0.69 /bu +$27 /ac ($0.93) /bu ($35) /ac +$1.91 /bu +$76 /ac +$0.31 /bu +$12 /ac Soybean Futures Monthly Chart: $17.00 MARCH 2019 $9.00 ¾ 2/19/2019 August 2005 to Feb. 19, 2019 $11.30 $10.65 $9.01 $8.47 $8.10 $5.50

26 Soybean Futures Weekly Chart: Early 2017 to Feb. 19, 2019 $10.60 MARCH 2019 $9.00 ¾ 2/19/2019 $9.40 $9.75 $9.01 $8.40

27 Soybean Cash & Futures $ s Tonganoxie, KS Local Elevators February 19, 2019 $16 Price $/bu $14 $12 $10 $8 $6 $4 $2 $0 $ /mo $ /mo $ /mo $ /mo $9.01 $9.15 $9.28 $9.34 $9.37 $9.46 $8.66 $9.28 $9.06 $8.20 $8.28 $5.13 $5.43 Futures Low $ High $ Mktg Loan-Finney Co.
28


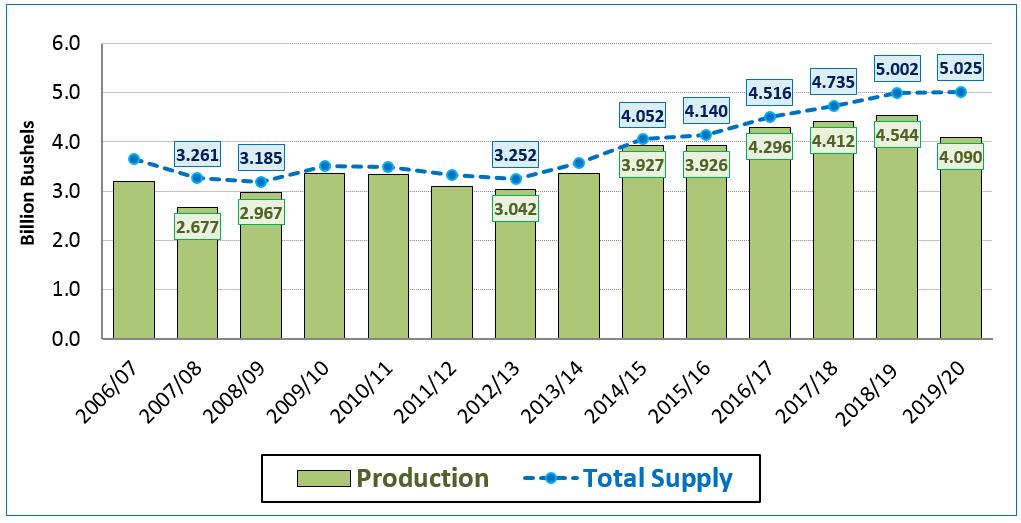
29 U.S. Soybean Production & Supplies
30 U.S. Soybean Supply-Use 2019 U.S. Soybean Production Record** billion bu. Large U.S. & Global Soybean Stocks limit U.S. Price$ s Low Price$ s DO support Current MY 2018/19 Use *** o Soy Crush 2018/19 = bln bu (New Record vs bb last year) o Exports 2018/19 = bln bu (Down vs & bb last 2 years) o Total Use 2018/19 = bln bu (Down vs & 4214 bb last 2 years) o SBM Exports 2018/19 = mln tons (vs & mln tons last 2 years) 4) U.S. Soybean Usage in Current MY 2018/19 (thru 8/31/2019) o Soy Crush 2018/19 = bln bu (Record vs bb last year) o Exports 2018/19 = bln bu (Down vs bb last 2 yrs) o Total Use 2018/19 = bln bu (Down vs bb last 2 yrs) o SBM Exports 2018/19 = mln tons (vs mln tons last 2 years)
31


32 U.S. Soybean Exports Cumulative Weekly (2/7/2019) U.S. Soybean Use & End Stocks End Stocks Exports Domestic Crush
33 5) Large U.S. Soybean Stocks & % Stocks-to-Use % Stocks/Use in Current MY 2018/19 Impact of +/ 150 mb on U.S. soybean S/D Balances? o o 760 mb vs bb U.S. soybean ending stocks 19% vs 26% Stocks/Use Significant +/ $ effects 19% Stks/Use Scenario Moderate Price Support 26% Stks/Use Scenario Overwhelming Supplies U.S. Soybean Stocks.. Soybean: Large Stocks & % S/U o End Stocks 2018/ mln bu (High vs 438 mb last year) o % Stocks/Use 2018/ % S/U (High vs 10.20% last year)
34 U.S. Soybean Ending Stocks & % Stx/Use % End Stocks-to-Use 25% 20% 15% 10% 5% 0% -5% -10% % 4.5% 4.5% % % % % % % 748 2,250 2,000 1,750 1,500 1,250 1, Million Bu. Marketing Year 6) U.S. Soybean Price Outlook USDA $8.60 /bu in Current MY 2018/19 $8.75 /bu in Next Crop MY 2019/20 (+$0.15 /bu vs current) o USDA Forecast for Next Crop MY 2019/20 : million acres planted (vs ma current) 50.0 bu/ac, (vs 51.6 bu/ac current) bb Production (vs bb current) bb Domestic Crush (vs bb current) bb Exports (vs bb current) 748 mb Ending Stocks (vs 910 mb current) 17.5% Ending Stocks / Use (vs 22.24% current)
 o")

35 U.S. Soybean % Stocks/Use vs Price$ MY 2006/07 Thru Next Crop MY 2019/20 Including preliminary U.S. Soybean S-D & Prices For Next Crop MY 2019/20 7) Other Market Factors Ongoing Negotiations between U.S. & China wrt trade issues More positive prospects for resolution in recent days USDA Market Facilitation Payments (MFP) o $1.65 /bu for 2018 Soybean Production Q? What impact could these 2018 Soybean MFP payments have on U.S. farmer s acreage choices in 2019? o New Farm Bill ARC vs PLC Choices..


36 Questions? Daniel O Brien Extension Ag Economist Blog: KSUGrains on Twitter & Facebook