CROP AFTER STRESS? Joe Lauer. University of Wisconsin Agronomy. Wisconsin Fertilizer, Ag Lime and Pesticide Management Conference January 18, 2007
|
|
|
- Philippa Collins
- 5 years ago
- Views:
Transcription
1 HOW DO YOU MANAGE A CORN CROP AFTER STRESS? Joe Lauer University i of Wisconsin i Wisconsin Fertilizer, Ag Lime and Pesticide Management Conference January 18, 2007
2 Overview Objective: Usually making the best of a bad situation Agronomic: In-season management options Re-planting Irrigation Preventative / Prophylactic Farmer: Is it peace of mind or stress or revenge? When is yield determined? Yield implications Management decisions following crop stress
3 Plants are usually subjected to a combination of stresses. Stresses are researched intensely individually; combinations are less so Abiotic Cool, wet soils Chilling and Freezing Heat Water (Flood and Drought) Wind Hail Nutrients Ozone UV Salinity Biotic Neighbors (competition) Inter- and Intra-plant Diseases Insects Weeds In a field, even more combinations of stresses can be occurring due to patchiness of abiotic and biotioc stresses interacting with soil and micro-climate.
4 Total of all US agriculture weather disasters costing $1 billion or more between 1980 and 2004 Source: Mittler, 2006 and NOAA (
5 What is Yield? Yield Components of Corn Number of rows Kernels per row Grain Yield Ears per area
6 Critical times in the life of a corn plant Yield Components Stage GDUs Potential Actual VE (Emergence) 125 Ears/area --- V6 (Six leaf collars) 470 Kernel rows/ear Factory V Kernel rows/ear V Kernels/row --- R1 (Silking) 1250 Kernel weight Kernel number Ears/area R6 (Black layer) Kernel weight
7 Corn Silage Yield and Quality Changes During Development Milk per Ton (lb/t) 2000 Pioneer 3578 Arlington, WI Milk per Acre (lb/a) Jul 11 V11 Source: Lauer, 1994 Jul 21 V14 Jul 31 R1 Aug 10 R2 Aug 20 R3 Harvest date Aug 30 R4 Milk per Ton Milk per Acre Sep 10 R5 Sep 21 R5.5 0 Oct 5 R
8 Expected corn grain yield (percent) for planting dates and harvest populations in Relative Maturity zones of d. Planting date Harvest population April 20 May 1 May 10 May 20 June 1 June 10 June Figures for shorter-season hybrids are in italics. Source: Lauer, 1997
9 Physiological Characteristics Of Drought And Heat Stress Combination Source: Mittler, 2006
10 Agriculturally Important Stress Combinations Source: Mittler, 2006


11 Management after Abiotic Stress


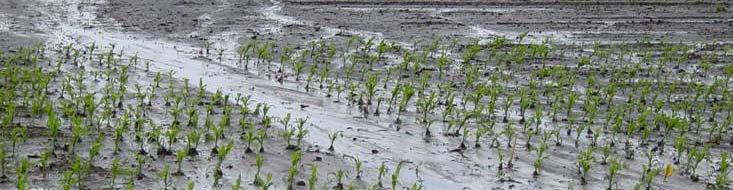
12 Know the health and position of the growing point Frost Flooding Re-planting


13 Determining Success of Pollination Shake test Carefully unwrap ear and shake Silks on fertilized ovules fall off or Wait 10 d and developing ovules will appear as watery blisters.
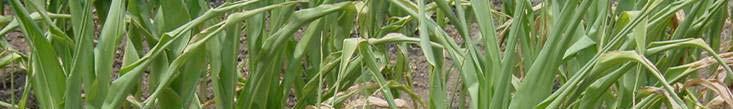
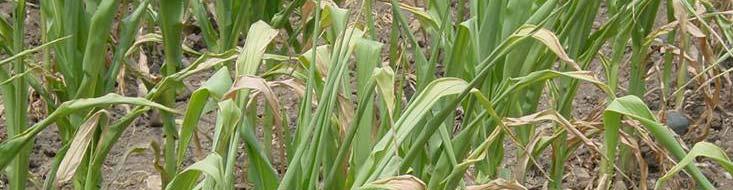
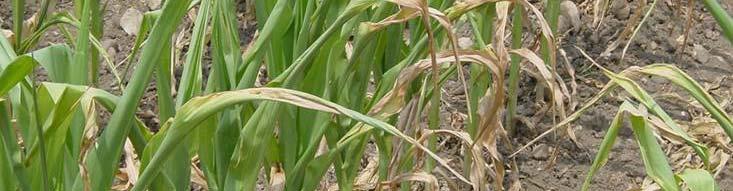
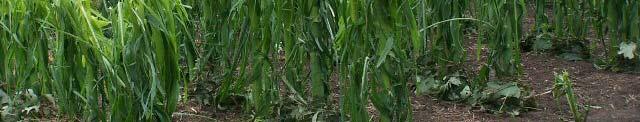
14 Corn Grain Yield Loss Due to Defoliation Percent leaf area destroyed Leaf Stage Leaf Stage Leaf Stage Tassel Silked Blister Milk Dough Dent Black layer Source: derived from National Crop Insurance Service Bulletin
15 Corn Grain and Silage Yield Loss Due to Defoliation 100 Rela ative forag ge yield (% %) V7 Y = X R 2 = 0.69 V10 Y = X 2 R 2 = 0.75 R1 Y = X 2 R 2 = 0.96 R4 Y = X 2 R 2 = 0.89 Silage Grain Source: Lauer et al., 2004 Defoliation (%)
16 Grain yield loss after plants killed or defoliated Corn Development Stage Plants Plants Killed Defoliated percent yield loss R4 (Soft dough) R5 (Dent) R5.5 (50% kernel milk) 12 5 R6 (Black layer) 0 0 Source: derived from Afuakwa and Crookston, 1984
17 Estimated corn evapotranspiration and yield loss per stress day during various stages of growth Growth stage Evapotranspiration Percent yield loss per day of stress (min-ave-max) inches per day % Seedling to 4 leaf leaf to 8 leaf leaf to 12 leaf leaf to 16 leaf leaf to tasseling Pollination (R1) Blister (R2) Milk (R3) Dough (R4) Dent (R5) Maturity y( (R6) Source: derived from Rhoads and Bennett (1990) and Shaw (1988)
18 Ear fill Corn forage yield and quality with differing amounts of pollination Forage Crude yield protein NDF ADF IVTD NDFD % % of control % % % % % (control) LSD (0.05) 05) Source: derived from Coors et al., 1997
19 Summary Abiotic Corn Growth Stage Stress VE V6 V12 V18 R1 R6 Grain Yield Loss (%) Frost <28F Hail (max) Drought/Heat (%/day) Flooding<48h Severe What about interactions with fertility, disease, insects, weeds and pesticides? id
20 Summary continued Crops rarely have one stress; usually a combination of stresses occur All bets are off as to what will happen Modern hybrids seem to be able to withstand more stress Early stress Determine whether to Re-plant: Late stress Determine plant population Evaluate plant health Assess the unevenness of stand Calculate replanting costs Determine success of pollination Compare yield of reduced to re-planted stand Factor risks of re-planting Good: harvest in normal fashion for either grain or silage Bad: some kernels developing, leave for corn silage harvest Ugly: harvest as close to flowering as possible, but must be concerned about moisture it of fforage
21 Summary continued Problems to be aware of: Harvest timing and influence of moisture on storage as silage, HMC, or dry grain Raising the cutter bar Nitrate poisoning Estimating yield impact of stress Grain yield method Plant height ht method Accurately calculate the economics and value of grain v. silage Difficult under best of circumstances
22 Thanks for your attention! Questions? 2007 Corn Conferences Baldwin January 24 Belmont January 23 Kimberly January 25 February 1-2, 2007 Kalahari Resort Wisconsin Dells, WI