Wawrzyniec Czubak
|
|
|
- Garey Mitchell
- 5 years ago
- Views:
Transcription
1 Faculty of Economic and Social Sciences Department of Economy and Economic Policy in Agribusiness Evolution of the performance framework in the Common Agriculture Policy Wawrzyniec Czubak
2 . Defining the types of farms in the EU. Investment outlays in agriculture in Poland. Allocation of EU funds 4. Distribution of direct payments in Poland
3 The future CAP ensure only genuine farmers receive income support Defining the types of farms in the EU Attempt to estimate the role and importance of different types of farms in EU agriculture


4 The European model of agriculture Sustainable agriculture: economically, socially and environmentally Family farm
5 Farm models Family farms - individual farms, - more than 5% of labor is own workforce - income per person (workforce) is higher than the minimum wage in the country, Corporate (also individual large-scale commercial farm) - characterized by a predominance of external workforce Small (economically marginal importance) - obtained income per person own work is lower than the net minimum wage in the country.
6 Estimation of the number of family farms The criterion of delimitation: net minimum wage Total agriculture holdings (farms) 4 76 Farms producing less than % of the SO FADN agriculture holdings (farms) Farms with income over the net minimum Farms with income below the net minimum 88 9 large-scale commercial farm Family farms 64 5 % 6 86 (%)
7 Estimation of the number of family farms The criterion of delimitation: net average wage Total agriculture holdings (farms) 4 76 Farms producing less than % of the SO FADN agriculture holdings (farms) Farms with income over the net AVERAGE 97 4 Farms with income below the net AVERAGE 98 5 large-scale commercial farm Family farms % 6 86 (%)


8 The criterion of delimitation: net average wage Poland vs EU PL EU Number of farms 9,6% 4,6 % UAA 7,% 4,6 % FWU 5,% 7, % The value of production 56,5%,7 % Direct payments 4,9% 4,5 %
 6% Źródło: Eurostat ; FADN %")
9 Share of family farms in total agriculture holdings (farms) 6% Źródło: Eurostat ; FADN % 4%
10 Family 7 Small Corporate The share of different types of farms in: Number of farms 6 Area of agricultural land Labour input 5 4 Value of agricultural output
11 Productivity (euro) Agricultural land Labour (Standard Output/AWU) (Standard Output/ha) Family Small Corporate
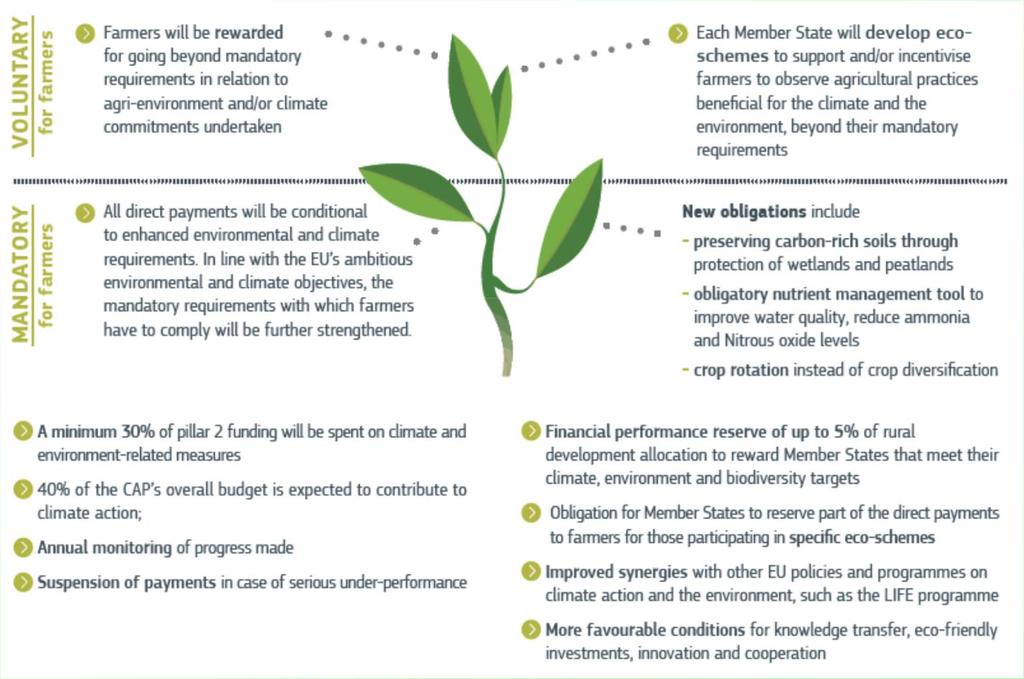
12 Investment outlays in agriculturepolish example of UE accession The future CAP More favourable conditions for knowledge transfer, eco-friendly investments, innovation
 Holt exponencial model 5 bln PLN 5,8 bln euro 4.")
13 Investment outlays in agriculture in 99- and the results of exponential model for 4-7 Investment outlays in agriculture in 99-5 and the results of exponential model for mln PLN 5. Investment outlays in agriculture (CSO) Holt exponencial model 5 bln PLN 5,8 bln euro

14 Investment outlays in food industry. mln PLN. Manufacture of food products and beverages 6 billion PLN,7 bln euro Holt exponential model the estimated net increase from 4 to 7 is 6 bilion PLN, which with a total capital expenditure of 6 billion PLN means an increase of 5%
15 CAP flexible system - specific needs of their farmers and rural communities The future CAP An extensive toolbox of measures will be agreed at the EU level, establishing what Member States can do with the money allocated to them; each country is then free to select and further design the specific measures


16 direction of financial mechanisms - what we support? model of industrial agriculture strongly emphasizing the increasing labor productivity and the intensity of resource management in agriculture production High economic efficiency with respect for the basic requirements of environmental protection model of socially sustainable agriculture provide a satisfactory conditions for the agricultural population and rural areas model of environmentally sustainable agricultural ability to self-renewal of natural resources economicaly
17 Total public expenditure + co-financing without direct subsidies in millions of euro allocation -4 SAPARD 4-6 SPO i RDP 7- RDP TOTAL mln euro Industrial Social Environmental Total % Industrial Social Environmental


18 Polish RDP 4- % % 5%

 an agri-food industry,.")
19 Research methods - The criteria for allocation Moving away from the classification/division in the axes of the RDP to own category on the basis of:. THE TARGET GROUP OF BENEFICIARIES: a) residents of rural areas, b) farms and forest owners. c) an agri-food industry,. THE TARGET OF THE SUPPORT: a) improving the fixed assets (capital), b) to improve human and social capital. c) improving the environment.
20 Allocation of EU funds for rural development programs Improvement of assets Improving the human and social capital in rural areas in rural areas Improving assets only or mainly 4 Improving the human and social capital on farms on farms 5 Improvement of assets of food processing industry 6 The afforestation and improving of the environment
21 Bułgaria axis axis 4 4 Vocational training and information actions Setting up of young farmers Early retirement Use of advisory services Modernisation of agricultural holdings Improvement of the economic value of forests Adding value to agricultural and forestry products Cooperation for development of new products Infrastructure related to the development and adaptation... Restoring agricultural production potential Diversification into non-agricultural activities Meeting standards based on Community legislation Support for business creation and development Participation of for farmers in food quality schemes Basic services the economy and rural population Information and promotion activities Semi-subsistence farming Village renewal and development + Encouragement of tourism Producer activitiesgroups + Conservation and upgrading of the rural heritage Provision of farm advisory and extension services Training and information 4 axis axis Skills acquisition, animation and implementation of... Natural handicap payments to farmers in mountain areas + Payments to farmers in areas with h., other than mountain (HNV) Natura payments and payments linked to Directive /6/EC Agri-environment payments Animal welfare payments Non-productive investments First afforestation of agricultural land + First afforestation of non-agricultural land First establishment of agroforestry systems on... Implementing local development Forest-environment payments strategies. Competitiveness + Environment/land + Qualityand of life Restoring forestry potential introducing prevention... Implementing cooperation projects Non-productive investments Running the local action group, acquiring skills and , Czechy
22 Belgia Francja Luksemburg RepublikaCzeska Węgry Finlandia Estonia Austria Grecja Włochy Hiszpania Cypr Słowenia Portugalia Słowacja 6 Wiązania Odległ. Łotwa Krok Bułgaria - Litwa 7 Polska 4 Niemcy Malta 8 Niderlandy 5 Dania Rumunia 9 Irlandia 6 Szwecja WielkaBrytania Odległość wiąz. Odległość wiąz. k clusters - agglomeration method of grouping Wykres odległości wiązania względem etapów wiązania Odległ. euklidesowa Diagram drzewa Metoda Warda Odległ. euklidesowa
23 cluster analysis Greece Denmark Cyprus Ireland Latvia Lithuania Sweden United Kingdom Portugal Slovenia Slovakia Bulgaria Poland Romania Spain Belgium France Luxembourg Finland Czech Republic Germany Estonia Italy Hungary Netherlands Austria

24 Allocation of EU funds Country UE 7 Denmark Ireland Sweden United Kingdom Greece Cyprus Latvia Lithuania Portugal Slovenia Slovakia Bulgaria Poland Romania Spain Belgium France Luxembourg Finland Czech Republic Germany Estonia Italy Hungary Netherlands Austria Malta human and afforestation assets of human and assets only social capital and assets in food social capital or mainly on only or improving of processing rural areas mainly on the in rural areas farms industry farms environment 7,8 9, 7,6 4,4 5,, 5, 9,7 8,8 6,,5 6,8, 8,7 9, 5, 7,8 6,6 7,8 9, 6,,,5,5,8 6, 7, 6,6 7,,4


25 Indicators of production and economic situation of agriculture ha UAA Average farm size (ha) , 4, 6,5 Cluster ,,9, GVA / gospodarstwo farm AWU/ ha UAA GVA / AWU,7 4,,8 9,6 5,7 5,
26 share of cereals in arable land permanent grassland in UAA,9 56,9 6 8,5 7,4 4 Cluster Cluster share of organic farming in UAA 4,,6,4 DJP/ ha AUAA % 4,5 4,5,5,5,5 5, 5 9,5 % % Agri-environmental indicators 4, Stocking density 77, 8 57, 6 4 Cluster Cluster
27 development indicators share of rural areas in total % 8, % 5 55,6,9 GDP on rural areas 9,5 PKB/capita in UE = 85, , 4 thous. euro %,,6 4 46, share of the population from rural areas GDP / capita,5 9,6,6
28 Conclusions The specificity of the national allocation of funds under the rural development programs corresponds to the level of development of individual Member States and the resulting needs of the different dimensions of sustainability in agribusiness and rural areas. An important role in determining the allocation of funds played a time of the accessions to the European Union. The most important criterion influencing the allocation of II pillar of the CAP was the wealth of rural societies and the competitiveness of agri-food sector
29 cluster analysis Latvia Czech Republic Lithuania Estonia Poland Hungary Bulgaria Romania Slovenia Slovakia
30 Allocation of EU funds cluster analysis Direction. Improvement of real capital in rural areas. Improvement of human and social capital in rural areas. Improvement of real capital only or mostly in farms 4. Improvement of human and social capital only or mostly in farms 5. Improvement of the environment and afforestation 6. Improvement of real capital in agri-food processing Total Cluster Cluster Cluster Lithuania, Latvia, Czech Republic, Bulgaria, Romania Poland, Slovakia, Estonia, Hungary Slovenia EUR % EUR % EUR % , , 9 696, , , , , , , , , 8 67, , , 46 4, 7 876, , , 49 9, , ,
31 Allocation of EU funds cluster analysis Direction. Improvement of real capital in rural areas. Improvement of human and social capital in rural areas. Improvement of real capital only or mostly in farms 4. Improvement of human and social capital only or mostly in farms 5. Improvement of the environment and afforestation 6. Improvement of real capital in agri-food processing Total Cluster Cluster Cluster Lithuania, Latvia, Czech Republic, Bulgaria, Romania Poland, Slovakia, Estonia, Hungary Slovenia EUR % EUR % EUR % , , 9 696, , , , , , , , , / 55% , , ,9 / 9, 46 5, , 5, 49 9, , ,
32 RD development indicators share of rural areas in total 68, 66, 64, 6, 6, 58, 56, 54, 5, 5, Cluster GDP on rural areas GDP/capita in UE =,,5,,5,,5, 9,5 9, 8,5 share of the population from rural areas 48, 47, 46, 45, 44, 4, 4, 4, 4, 9, Cluster Cluster Population density on rural areas (inhab/km) 9, 8, 7, 6, 5, 4,,,,, Cluster
33 Indicators of production and economic situation of agriculture Average farm size (ha) 45, 4, 5,, 5,, 5,, 5,, Cluster 8, 6, 4,,, 8, 6, 4,,, 4,,, 8, 6, 4,, Cluster Cluster GVA / ha UAA [ ] GVA / farm [ ], AWU/ ha UAA 5, 45, 4, 5,, 5,, 5,, 5,, Cluster
34 Indicators of production and economic situation of agriculture GVA per AWU [ ], 9, 8, 7, 6, 5, 4,,,,, Cluster
35 Direct payments (in the financial framework 7-) 5. Direct payments per farm [ ] Direct payments per ha UAA [ ] Cluster Direct payments / AWU [ ] Cluster Cluster
36 Direct support for farmers to ensure stability and predictability to farmers The future CAP There will be EU involvement at each stage to set rules, assess plans, monitor progress and ensure delivery Obligation for Member States to reserve part of the direct payments to farmers for those participating in specific eco-schemes


37 The distribution of direct payments to the various directions of their use non-productive expenditure investment expenditure Current production expenditure Source: Own elaboration, 6-
38 Demand factors - domestic demand Growth in individual consumption of food and non-alcoholic beverages in the household sector (previous year =, constant prices) ,7,7,8,,4,, ,4,7,6,4,, 99, Źródło: Statistical Yearbook of the Republic of Poland, GUS, Warszawa,, 4 98, 5 6 7,,8,8 7 5 = = 8,,
39 CAP + the future CAP retains both pillars more flexibility and simplification more oriented to results more balanced distribution of payments: - compulsory capping at farm level - degressive payments decreasing with farm size reinforced link with environmental objectives: voluntary eco-schemes introduced in the budget for direct payments; greater flexibility for Member States new crisis reserve MFF /7 includes 65 billion EUR for the CAP in current prices -5% (8.5% MFF); 4, billion EUR in 8 constant prices -%
 The transformation from current in constant prices has been undertaken using the fixed % annual")
40 CAP sub ceilings in the MFF (commitments in millions current prices) CAP sub ceilings in the MFF (commitments in millions constant 8 prices ) The transformation from current in constant prices has been undertaken using the fixed % annual deflator 4
41