AGROECOSYSTEM GREENHOUSE GAS BALANCE INDICATOR: NITROUS OXIDE COMPONENT
|
|
|
- Cecil Todd
- 5 years ago
- Views:
Transcription

1 AGRI-ENVIRNMENTAL INDICATR PRJECT Agriculture and Agri-Food Canada REPRT N. 20 AGRECSYSTEM GREENHUSE GAS BALANCE INDICATR: NITRUS XIDE CMPNENT Technical Report: Estimates of Nitrous xide Emissions from Agroecosystems in Canada for 1986 and 1991 Using the Revised 1996 IPCC/ECD Methodology C.A. Monteverde, R.L. Desjardins and E. Pattey Agriculture & Agri-Food Canada, Research Branch JUNE 1997
2
3 PREFACE The Agri-Environmental Indicator (AEI) Project of Agriculture and Agri-Food Canada (AAFC) was initiated in 1993 in response to recommendations made by several agencies, organizations and special studies. The overall objective of the project is to develop and provide information to help integrate environmental considerations into decision-making processes of the agri-food sector. The project aims to develop a core set of regionally-sensitive national indicators that build on and enhance the information base currently available on environmental conditions and trends related to primary agriculture in Canada. The nitrous oxide component of the Agroecosystem Greenhouse Gas Balance indicator is an important part of the agri-environmental indicator set. Indicators are also being developed for other aspects of agricultural greenhouse gases and in relation to issues of water quality, agroecosystem biodiversity, farm resource management, soil quality and agricultural production efficiency. Research results in the form of discussion papers, scientific articles and progress reports are released as they become available. A comprehensive report is planned for fiscal year which will include data from the 1996 Statistics Canada Census of Agriculture. Comments and questions on this paper should be addressed to: Dr. Raymond Desjardins Eastern Cereal and ilseed Research Centre Research Branch, Agriculture and Agri-Food Canada Central Experimental Farm, Building No. 74 ttawa, ntario K1A 0C6 Telephone: (613) Facsimile: (613)
4
5 Table of Contents Page Abstract Introduction Methodology Direct N 2 Emissions from Agricultural Soils N 2 Emissions from N Fertilizers (F SN ) N 2 Emissions from Animal Wastes (F AW ) N 2 Emissions from N-fixing Crops (F BN ) N 2 Emissions from Crop Residues (F CR ) N 2 Emissions from Histosols (F histosols) Total Direct N 2 Emissions from Agricultural Soils Direct Soil Emissions of N 2 from Animals N 2 Emissions from Grazing Animals Indirect N 2 from Nitrogen Sources in Agriculture Indirect Emissions from Atmospheric Deposition of NH 3 10 and N x Indirect Emissions from N Leaching Total Nitrous xide emissions from Agricultural soils ther Sources of N 2 Emissions N 2 Emissions during Manure Storage N 2 Emissions from Municipal Sewage Treatment Results and Discussion Estimates of Direct N 2 Emissions from Agricultural Soils Estimates of Direct N 2 Emissions from Grazing Animals Estimates of Indirect N 2 Emissions Estimates of Total N 2 Emissions from Agricultural Soils Estimates of N 2 Emissions from other Sources Estimates of Total N 2 Emissions from Agriculture Summary and Conclusion Future Undertakings 24 Acknowledgments 25 List of Figures 26 List of Tables 26
6 Abstract Nitrous oxide (N 2 ) emissions from agroecosystems in Canada were estimated on a provincial and national basis using the 1996 IPCC/ECD methodology and the Census of Agriculture data for 1986 and Total N 2 emissions were 93.4 Gg N 2 in 1986 and 92.7 Gg N 2 in Using a 100 year time horizon, this is equivalent to and Gg of C 2. Agricultural components of total emissions are direct and indirect emissions from soils, animals and emissions from other agricultural sources. Direct N 2 emissions from agricultural soils contributed Gg N 2 in 1986 and Gg N 2 in Crop residues and nitrogen fertilizers were the principle sources of these emissions, contributing approximately 37% and 31% in 1986 and 1991, respectively. The principle sources of indirect N 2 emissions were from atmospheric deposition of NH 3 and N x leaching and runoff which contributed Gg N 2 and Gg N 2 in 1986 and 1991, respectively. Grazing animals contributed about Gg N 2 in 1986 and Gg N 2 in ther N 2 emissions considered in the IPCC/ECD methodology were from animal waste during storage and from human sewage. Together, these contributed about 7 Gg N 2. Although there are still considerable uncertainties in the emission factors used in these calculations, these results demonstrate that agricultural practices are an important source of N 2 emissions. 1
7 1.0 Introduction Presently, the atmospheric concentration of N 2 is about 312 ppbv and its rate of increase is approximately 0.5% (IPCC, 1996). Its long atmospheric lifetime and unique absorption bands give N 2 a large global warming potential (GWP). According to the IPCC (1996), a molecule of N 2 is about 310 times more effective in its GWP, on a 100 year basis, than a molecule of C 2. The increase of atmospheric N 2 is particularly important as it also contributes to the destruction of stratospheric ozone. There are many small sources of N 2, both natural and anthropogenic, which are difficult to quantify. Therefore, the current N 2 budget is very poorly understood. The sources (14 Tg-N/yr) exceed the sinks (10 Tg-N/yr) by 40% (Keller and Reiners, 1994). The main anthropogenic sources are from agriculture and various industrial processes such as the production of adipic acid and nitric acid (IPCC 1996). Globally, agriculture contributes about 70% of anthropogenic N 2 emissions (Mosier, 1993). Nitrogen fertilizers with mineral nitrogen sources, animal manure and nitrogen derived from N-fixation (leguminous crops) all contribute to N 2 emissions produced from the soil (Duxbury et al., 1993). Processes such as manure applications and the incorporation of crops or crop residues into the soil may significantly affect the production of N 2. ther N 2 sources come from biomass burning, fossil fuel combustion, nitrification and denitrification, most of which are difficult to quantify (Batjes and Bridges, 1992). This report estimates N 2 emissions from Canada's agricultural industry based on the 1996 Revised IPCC/ECD Guidelines for Nitrous xide inventory methodology and the 1986/1991 Census of Agriculture data. 2
8 2.0 Methodology The IPCC methodology for estimating the N 2 emissions from agriculture is broken down into three main areas: (a) direct emissions from agricultural soils; (b) direct emissions from animal production systems, and; (c) indirect emissions from agricultural systems. These groups may be subdivided into their main N 2 contributors (Figure 1): Figure 1. Schematic of the main sources considered for calculation of N 2 emissions Direct N 2 Emissions from Agricultural Soils N 2 Emissions from Synthetic N Fertilizers (F SN ) The use of commercial nitrogen fertilizers has increased significantly in the past decade. This increase in nitrogen in the soil is producing significant N 2 emissions (Bouwman, 1990; Eichner 1990). Several types of nitrogen fertilization are commercially available which include anhydrous ammonia, urea, ammonium nitrate, ammonium sulfate, and nitrogen solutions. The total nitrogen content from these fertilizers ranges from approximately 20 to 82%. In addition to nitrogen fertilizers, several types of ammoniated phosphates are also 3
9 available which contain 10 to 18% total N (Walsh, 1973) Data Sources The estimates of synthetic fertilizer N inputs to agricultural soils were obtained from the Canadian Fertilizer Consumption, Shipment and Trade publications (Asselstine and Girard, 1992; Spearin and 'Connor, 1991). The fertilizer consumption figures are subject to uncertainty because they may not correspond exactly to on-farm consumption in a specific province. There is also some inter-provincial and possibly international movement of fertilizer between retailers and farms. Between 1970 and 1985, in some agricultural areas in Canada, the amount of fertilizer applied has increased thirty-fold (Statistics Canada, 1991). The largest percentages of fertilizer applications are found in Alberta, Saskatchewan, Manitoba and ntario. The default factors used to calculate emissions due to nitrogen fertilizer were obtained from Bouwman (1996). These factors are based on published measurements of N 2 emissions from fertilized and unfertilized soils, and from the IPCC/ECD emission factors (1996b) (Table 1). An emission factor of 0.1 NH 3 -N + N x -N/kg of synthetic fertilizer is used to account for the loss from ammonia volatilization and emission of nitric oxide through nitrification after fertilization. Table 1. Percentage of N fertilizer evolved as N 2 for various fertilizer types. 1 2 Fertilizer Type % 1. Anhydrous Ammonia Ammonium Nitrate Ammonium Sulfate (salts of Ammonium) Urea Calcium Nitrate Phosphate Bouwman, IPCC/ECD, 1996b Calculations Nitrous oxide emissions from nitrogen fertilizers are estimated using the total nitrogen fertilizer consumption. It is calculated excluding the 10% NH 3 and N x emissions estimated to be lost to the atmosphere during the application. 4
10 Equation 1: N 2 (fertilizers) = ' N Fertilizer Consumption (kg N/yr) 0.9 EF (fert. type) 10-6 where: EF (fert. type) = Emission factor by fertilizer type; 10-6 = conversion from kg to Gg; N 2 (fertilizers) = Gg N 2 -N/yr N 2 Emissions from Animal Wastes (F AW ) Manure contains significant amounts of C and N, and when applied to soils, contributes to the release of N 2 (Angers and N'Dayegamiye, 1991; Collins et al. 1992; Lessard et al. 1993). Its nutrient content can vary greatly, depending on the type and size of animal, the amount and type of feed, the collection system and the management between the production and application (Eck and Stewart, 1996). It is therefore difficult to accurately estimate the magnitude of this source of N Data Sources ntario, Quebec, Manitoba and Alberta have the largest livestock populations in the country. These populations are usually categorized into the following groups: dairy cattle, non-dairy cattle, swine, sheep, and poultry. It is difficult to estimate N in animal feed and excreta, the NH 3 losses, and the annual amounts of excreta per animal type and size. Therefore, only a rough estimate can be determined based on animal population and agricultural practices. The manure used as a fertilizer is corrected for NH 3 volatilization and N x emissions. This is assumed to be approximately 20% of nitrogen applied (IPCC/ECD,1996b). The default factor used for nitrogen excretion is based on a study conducted by Culley and Barnett (1984) and the emission factors are based on the IPCC/ECD (1996b) data as shown in Table 2. Table 2. N content in manure from various animal types and manure N produced in pasture and paddock as well as respective emission factors. Animal % Manure N produced in N content Emission Factor Pasture and Paddock 3 Emission Factor (kg N/animal/yr) 1 EF 2 EF Dairy cow Non-Dairy cow Swine Poultry Sheep Culley and Barnett, IPCC/ECD, 1996b; Table IPCC/ECD, 1996b; Table 4-7; Safley et. al, IPCC/ECD, 1996b; Table 4-8; Safley et. al,
11 Calculations Based on the livestock population and the nitrogen excretion factors from the IPCC/ECD (1996b), N 2 emissions can then be calculated: Equation 2: N Excretion (animal type) = N (NEX) = ' Manure Production (animal type) N content (animal type) Equation 3: Total N (NEX) = ' N Excretion (animal type) Equation 4: N 2 (animal wastes) = (Total N Excretion - Manure N (during grazing) ) (1- Frac (GASM) ) Where: Frac (GASM) = fraction of livestock N excretion volatilized as NH 3 and N x (kg NH 3 and N x -N/kg N excreted); 0.2 (IPCC/ECD, 1996b, Table 4-17); N 2 (animal wastes) = Gg N 2 -N/yr. The above data must also be evaluated for each province so that the animal wastes used to fertilize crops and those deposited on the pasture while the animals are grazing are not counted twice. This is done by subtracting the amount of nitrogen excreted by grazing animals from the total nitrogen excreted by animals N 2 Emissions from N fixing Crops (F BN ) Legumes, such as alfalfa, clover and soybeans are capable of converting atmospheric nitrogen into a usable form for the plant. This is achieved through a symbiotic relationship with the N-fixing Rhizobia bacteria located in their roots. N 2 emissions can therefore be produced even when the crops receive little or no additional nitrogen fertilization (Bouwman, 1996) Data Sources Canada produced a total of about 17.5 million metric tonnes of leguminous crops in 1986, while in 1991 the production was approximately 18.5 million metric tonnes. These values are probably underestimated because they only include the production of peas, soybeans, beans, lentils and alfalfa. The N 2 emissions from these N-fixing crops is calculated by multiplying the area of land used, by the mean crop yield. This value, multiplied by the %N in the specific crop, gives the amount of nitrogen available. The amount of nitrogen available is then multiplied by an emission factor to give the amount of N 2 emitted. 6
12 The production data of N-fixing crops by province were obtained from Statistics Canada (1992). The emission factor of 1.25% kg N 2 -N/kg N was used to calculate N 2 emissions (IPCC/ECD, 1996b) Calculations N 2 emissions from N-fixing crops are calculated by assuming that the dry biomass production of pulses and soybeans is about twice the mass of edible crop (FA, 1990b). A default factor of 0.03 kg N/kg of dry biomass is used to convert from units of kg dry biomass/yr to kg N/yr in crops. The moisture content of the crops is assumed to be 15%. Equation 5: N 2 (N-fixing crops) = 2 [Total Seed Yield (kg dry biomass) (N-content/kg of dry biomass)] Where: N-content/kg of dry biomass = 0.03 kg N/kg dry biomass; N 2 (N-fixing crops) = Gg N 2 -N/yr N 2 Emissions from Crop Residues (F CR ) Nitrous oxide is also emitted as a result of crop residue decomposition in the field. There is only a limited amount of information regarding re-utilization of nitrogen from crop residues to agricultural fields and the amount of nitrogen converted to N Data Sources Almost 85% of Canada's cropland can be found in Manitoba, Saskatchewan and Alberta (Statistics Canada, 1992), with the overall area of farmland in Canada remaining fairly constant. Alberta, which had 20.8 million ha of cropland in 1991, reported the largest increase in farm land in 1986 of 156,000 ha (Statistics Canada, 1992). The principal agricultural crops cultivated in Canada include wheat, canola, oats, barley, rye, mixed grains, flaxseed, corn, buckwheat, tame hay, sugar beets and leguminous crops. The distribution of agricultural crops were obtained from Statistics Canada, by province, using the 1986/1991 crop production data. An emission factor of 1.25% (IPCC/ECD, 1996b) is used to calculate the N 2 emissions (kg N 2 -N/kg N). 7
13 Calculations Nitrous oxide emissions from crop residues are estimated by assuming that crop production is about twice the mass of the edible crop (FA, 1990b). A default factor of kg N/kg of dry biomass is used to convert units of kg dry biomass/yr to kg N/yr. In Canada, it is assumed that 30% of the crop residues remains on the field (Blevins and Frye, 1993). Equation 6: N 2 (crop residues) = 2 [Total Crop Production Frac (NCR) + Total Seed Yield (pulses & soybeans) Frac (NCRBF)] (1- Frac (R) ) (1- Frac (BURN) ) Where: Frac (NCR) = fraction of N in non-n-fixing Crops (kg N/kg of dry biomass); Table 3; Frac (NCRBF) = fraction of nitrogen in N-fixing Crops (kg N/kg of dry biomass); Table 3; Frac (R) = fraction of Crop residue that is removed from the field as crop(kg N/kg of dry biomass); Table 3; Frac (BURN) = fraction of crop residue that is burned rather than left on field; Table 3; N 2 (crop residues) = Gg N 2 -N/yr. Table 3. Default values for N-fixing Crops and Crop residues. Frac NCR Frac NCRBF Frac R Frac BURN kg N/kg of dry biomass 0.03 kg N/kg of dry biomass 0.70 kg N/kg crop-n 0.25 in developing countries & 0 in developed countries Source: IPCC/ECD, 1996b; Table N 2 Emissions from Histosols Nitrous oxide is also emitted as a result of the cultivation of organic soils (histosols), which have an abundant nitrogen-rich organic matter throughout their soil profile. They are often wet, with a high water table, and provide a good environment for denitrification Data Sources Estimates of the quantity and distribution of organic soils are uncertain. Levesque (1982) estimated that the total area of cultivated soils is about 15,400 ha, approximately 0.02% of the total agricultural land found in Canada. 8
14 Calculations Nitrous oxide emissions from histosols are calculated as the product of the total area of cultivated organic soils and the emission factor for direct soil emissions. Equation 7: N 2 (histosols) = Area of Cultivated organic soils IPCC Def. Factor (temperate regions) 10-6 Where: IPCC Def. Factor (temperate regions) = 5.0 kg N 2 -N /ha/yr ; N 2 (histosols) = Gg N 2 -N/yr Total Direct N 2 Emissions from Agricultural Soils The total direct N 2 emissions from agricultural soils is the sum of the following agricultural sources: Equation 8: Direct N 2 (Gg N 2 /yr) = {N 2 (fertilizers) + N 2 (crop residues) + N 2 (N-fixing crops) + N 2 (animal wastes) + N 2 (histosols)} 44/ Direct Soil Emissions of N 2 from Animals There are two possible sources of N 2 emissions from animals: a) dung and urine deposited from grazing animals and; b) animal wastes during storage and treatment. The only sources considered in this section are the emissions from pastures and paddocks N 2 Emissions from Grazing Animals Nitrogen in the dung and urine of grazing animals results in N 2 emissions. According to Flessa et al. (1995), nutrient cycling in pasture is highly influenced by grazing animals such as non-dairy cattle. It is estimated that 84% of the consumed nitrogen is returned in animal excreta Data Sources Estimates of the total nitrogen content in manure from various types of livestock are based on a study conducted by Culley and Barnett (1984). Their values are considerably lower than those given by the IPCC. Table 2 presents the default factors used in this study. 9
15 Calculations Estimates of N 2 emissions from grazing animals are calculated using the following equations: Equation 9: N 2 (animals) = N 2 (AWMS) = ' (T) [N (T) N (NEX) AWMS (T) EF 3 (AWMS) ] Equation 10: N 2 (AWMS) = [N (T=1) N (NEX =1) AWMS (T=1) EF 3(AWMS) (N (T=Max) N (NEX=Max) AWMS (T=Max) EF 3 (AWMS) )] /28 Where: T = type of animal category; N (T) = no. of animals of type T; N (NEX) = N excretion of animals of type T (kg N/animal/yr); (IPCC/ECD,1996b; Table 4-6); AWMS( T )= fraction of N (NEx) from pastures and paddocks for animals of type T; EF 3 (AWMS) = 0.02; Table 2; N 2 (AWMS) = Gg N Indirect N 2 Emissions from Nitrogen Sources in Agriculture The application of nitrogen fertilizers and animal manures can result in the indirect release of N 2 by: (a) volatilization and atmospheric deposition of NH 3 and N x (mainly from N fertilizer); (b) nitrogen leaching and runoff; and (c) municipal sewage which will be included in section Indirect Emissions from Atmospheric Deposition of NH 3 and N x. Atmospheric deposition of NH 3 and N x originating from fertilizer applications and from animal manure applications are the only sources taken into consideration in the calculations of the indirect emissions Data Sources The data used to estimate the N losses in the form of NH 3 and N x are based upon the estimated nitrogen fertilizer use N (FERT) and nitrogen from animal manure (N (NEx) ). Default values of 0.1 kg N/yr for fertilizer and 0.2 kg N/yr for animal manure account for NH 3 and N x volatilization. An emission factor of 0.01 kg of N 2 -N per kg NH 3 -N and N x -N emitted is used to calculate the N 2 emissions (IPCC/ECD, 1996b). 10
16 Indirect N 2 Emissions from N Leaching Leaching and runoff are significant mechanisms by which N 2 is lost from the soil. Nitrogen from fertilizers and animal manures can enter the groundwater through this process, be denitrified, and become a source of N 2 downstream Data Sources The following inventory includes data that were used for the estimation of N 2 emissions from atmospheric deposition. The total nitrogen excretion from animal manures (N (NEx) ) includes the manure produced during grazing. The IPCC/ECD default factor of 0.3 kg N/kg N fertilizer or manure N, is used as the fraction of the fertilizer or manure lost to leaching and surface runoff. This value is also used to calculate N 2 -N emissions. An emission factor of kg N 2 -N/kg of nitrogen leaching/runoff is used Calculations Equation 11: N 2 (indirect) = (N 2 (G) + N 2 (G) ) 44/28 N 2 (G) = N (FERT) Frac (GASF) + N (NEX) Frac (GASM) EF N 2 (G) = (N (FERT) + N (NEX)) Frac (LEACH) EF Where: Frac (LEACH) = Fraction of nitrogen input to soils that is lost through leaching and runoff (kg N of N applied) (IPCC/ECD, 1996b; Table 4-17); N 2 (G) = N 2 emissions due to atmospheric deposition of NH 3 and N x (kg N/yr.); N 2 (G) = N 2 emissions due to nitrogen leaching and runoff (kg N/yr); EF 4 = 0.01 kg N 2 -N/kg NH 3 -N & N x -N deposited (IPCC/ECD, 1996b; Table 4-18); EF 5 = kg N 2 -N/kg N from leaching and runoff (IPCC/ECD, 1996b; Table 4-18); N 2 (indirect) = Gg N Total N 2 Emissions from Agricultural Soils The total N 2 emissions from agricultural soils are the sum of the direct emissions from agricultural soils, the emissions from grazing animals, and the indirect emissions associated with atmospheric N deposition and N leaching. 11
17 2.5 ther Sources of N 2 Emissions N 2 Emissions during Manure Storage Nitrous oxide is often emitted during the storage of animal manure when the nitrogen is either nitrified or denitrified. The amount of N 2 emitted is dependent on the type of system and the duration of storage. The emissions include those from anaerobic lagoons (AL), liquid systems (LS), solid storage and drylot (SSD) and other systems (S) Data Sources The data used to estimate emissions from animal manure was used in the calculation of N 2 emissions from AWMS. The IPCC/ECD (1996b) and Gulley and Barnett (1984) emission factors (Table 4) are based on estimates of animal distribution and management systems for each animal type. The majority of the emission factors are based on a very limited amount of information (IPCC/ECD, 1996a) Calculations Nitrous oxide emissions from other animal management systems can be estimated using the following equations: Equation 12: N 2 (AWMS) = ' (T) [N (T) N (NEX) AWMS (T)] EF 3 (AWMS) /28 Table 4. where: N (T) = no. of animals of type T; N (NEX) = N excretion of animals of type T (kg N/animal/yr); (IPCC/ECD, 1996b; Table 46); AWMS (T) = Fraction of N (NEX) that is managed in different for animals of type T (IPCC/ECD, 1996b; Table 4-7); EF 3 = Emission factor (IPCC/ECD,1996b; Table 4-8); N (NEX)(AWMS) = Nitrogen excretion per Animal Waste Mgt. System (kg/yr). Default values for N excretion per head per animal type. % Manure N produced in N content AWMS 2 (kg/animal/yr) 1 Emission Factor EF3 3 Animal AL LS SSD S AL LS SSD S 1. Dairy cow Non-Dairy cow Swine Poultry Sheep Culley and Barnett, IPCC/ECD, 1996b; Table 4-7. IPCC/ECD, 1996b; Table 4-8; Safley et. al,
18 2.5.2 Nitrous xide Emissions from Municipal Sewage Treatment Human sewage can either be treated or processed before it is discharged into rivers or estuaries. The sludge can also be directly applied to the soil without any prior treatment Data Source It is assumed that nitrogen constitutes approximately 16% by weight of human protein intake. The emission rates for sewage treatment and land disposal of human sewage are assumed to be small. This is based on the low emission rates of N 2 reported for operating wastewater facilities (Hemond and Duran, 1989; Czepiel et al., 1995), and the lack of information of N 2 production from land disposal of human sewage. It is also assumed that minimal removal of sewage nitrogen occurs during land disposal and sewage treatment, and that all sewage nitrogen enters rivers and/or estuaries (IPCC/ECD, 1996b). Nitrous oxide emissions in rivers and estuaries due to nitrification and denitrification are estimated to be 0.01 kg N 2 -N/kg N sewage Calculations Nitrous oxide emissions from sewage are calculated by using the following equation: Equation 13: Gg N 2 (S) = NR (people) Protein Frac (NPR) EF 6 x /28 where: N 2 (S) = N 2 emissions from human sewage (kg N 2 -N/yr); Protein = Annual per capita protein intake (kg/person/yr); NR (people) = Number of people; EF 6 = Emission factor (default 0.01 ( ) kg N 2 -N/kg sewage-n produced; (IPCC/ECD, 1996b; Table 4-18); Frac (NPR) = Fraction of nitrogen in protein (default= 0.16 kg N/kg protein) (IPCC/ECD, 1996b; Table 4-19). 3.0 Results and Discussion This section presents estimates of N 2 emissions from agroecosystems in Canada for the years 1986 and The following sources considered were: (a) the direct emissions from agricultural soils; (b) the direct emissions from grazing animals; (c) the indirect emissions induced by agricultural practices (i.e. mineral nitrogen application and livestock production) and; (d) other sources, such as the direct emissions from AWMS and the indirect emissions from municipal sewage treatment. 3.1 Estimates of Direct N 2 Emissions from Agricultural Soils The direct N 2 emissions from the different agricultural sources for 1986 and 1991 are summarized in Tables 5 and 6. 13
19 Table 5. Magnitude of the sources of the direct N 2 emissions from agricultural soils in Province A B C D E F G F SN F AW F CR F BN F histosols Total Emissions Total Direct Emissions (Gg) G= F [44/28] (Gg N/yr) (Gg N/yr) (Gg N/yr) (Gg N/yr) (Gg N/ha/yr) (Ga N/yr) Atlantic Provinces Quebec ntario Manitoba Saskatchewan Alberta B. Columbia CANADA % Contribution 31% 13% 37% 19.0% 0.2% Table 6. Magnitude of the sources of the direct N 2 emissions from agricultural soils in Province A B C D E F G F SN F AW F CR F BN F histosols Total Emissions Total Direct Emissions (Gg) G= F [44/28] (Gg N/yr) (Gg N/yr) (Gg N/yr) (Gg N/yr) (Gg N/ha/yr) (Gg N/yr) Atlantic Provinces Quebec ntario Manitoba Saskatchewan Alberta B. Columbia CANADA % Contribution 29% 13% 36% 22% 0.2% Estimated emissions from fertilizer application (F SN,) were generally higher in 1986 compared to This corresponds to a slight decrease in fertilizer use in nly Manitoba and Alberta were the exceptions to this trend, showing an increase in emissions from 1986 to Alberta contributed the highest N 2 omissions from fertilizer applications (2.75 and 2.80 Gg N 2 -N/yr), followed by Saskatchewan (2.57 and 1.70 Gg N 2 -N/yr). The Atlantic Provinces showed the lowest total emissions in 1991 with 0.33 Gg N 2 -N/yr. Several studies have shown that N 2 is emitted with the addition of N fertilizer and that the emissions can vary with each type (Bremmer and Blackmer, 1978; Bouwman, 1996). However, Byrnes et. al. (1990) suggest that soil properties are more important than the amount of fertilizer applied. The total N 2 emissions from fertilizer applications are estimated at 9.75 Gg N 2 -N (15.32 kt N 2 ) in 1986 and 8.95 Gg N 2 -N (14.06 kt N 2 ) in
20 ntario had the highest N 2 emissions (1.29 and 1.22 Gg N 2 -N/yr) from animal manure (F AW ), followed by Quebec (1.17 and 1.05 Gg N 2 -N/yr). The smallest contribution was from the Atlantic provinces (0.20 and 0.18 Gg N 2 -N/yr). These values correspond to the various agricultural activities found throughout Canada. For example, ntario and Quebec in 1991 accounted for more than 70% of the dairy industry (Statistics Canada, 1991). Alberta had lower N 2 emissions from animal manure because most of the N 2 emitted from manure is accounted for in the direct N 2 emission by grazing animals. Nitrous oxide emissions from nitrogen fixing crops (F BN ) ranged from 0.03 to 2.07 Gg N 2 -N/yr in 1986 and from 0.04 to 2.35 Gg N 2 -N/yr in The N 2 emissions for this type of crops were estimated to be 6.02 Gg N 2 -N/yr and 6.66 Gg N 2 -N/yr for 1986 and 1991, respectively, with the highest emissions from ntario, Saskatchewan and Alberta. A difference in crop production between 1986 and 1991 resulted in the decrease in emissions from crop residues (F CR ). Provinces that were exceptions to this trend are Alberta and Manitoba, who showed a significantly higher crop production in The difference in N 2 emissions from 1986 and 1991 is most likely related to interannual variations in the climate. Histosols (F histosols) contributed minimally to N 2 emissions with a total of only approximately 0.08 Gg N 2 -N/yr in both 1986 and This represents only 0.2% of the total direct emissions produced from agricultural soils. Among the five direct emission sources from agricultural soils, crop residues were the most important source of the direct N 2 emissions (about 36% and 37% of total N 2 emissions were released from crop residues in 1986 and 1991, respectively). Synthetic fertilizers accounted for approximately 31% and 29% of total emissions produced from agricultural soils in respective years. The total direct N 2 emissions released in Canada were ~ Gg N 2 -N/yr or ~ Gg in 1986 and ~ Gg N 2 -N/yr or ~ Gg in verall, ntario had the highest emissions (11.90 Gg N 2 ) in 1986 and Alberta had slightly higher emissions (12.65 Gg N 2 ) in 1991 (Tables 7 and 8). 3.2 Estimates of the Direct N 2 Emissions from Grazing Animals The summary of the results for direct N 2 emissions from grazing animals is presented in Table 7. Grazing animals in Canada emitted Gg N 2 and Gg N 2 for the years 1986 and 1991, respectively. Alberta emitted the most of any province, contributing 3.76 Gg N 2 (1986) and 4.69 Gg N 2 (1991). 15
21 Table 7. Total N 2 emissions from grazing animals by province in 1986 and Province A B C Emission Factor for AWMS (EF3) 2 (kg N 2 -N/kg N) Nitrogen Excretion (N (NEX) ) (kg N/yr) 1 N 2 Emissions from Grazing Animals (Gg) Default values 2 C = (A B) [44/28] Atlantic Provinces 7,645, ,572, Quebec 23, , ntario 56,682, ,333, Manitoba 33,344, ,095, Saskatchewan 64,888, , Alberta 119,560, ,142, B. C. 19,207, , CANADA 324,855, ,976, Based from Statistics Canada, IPCC/ECD, 1996b; Table Estimates of the Indirect N 2 Emissions Tables 8 and 9 indicate the total indirect N 2 emissions from atmospheric deposition of NH 3 and N x for 1986 and Alberta produced the highest emissions, mainly due to the higher manure and N fertilization use in this area. ntario and Saskatchewan also had high emissions in 1986 and A total estimated amount of 2.68 Gg N 2 -N/yr and 2.65 Gg N 2 -N/yr were emitted in Canada for 1986 and respectively. Table 8. Indirect N 2 emissions from atmospheric deposition of NH 3 and N x in Province A B C D E F G H Synthetic fertilizer 1 N (fert) (kg N/yr) Frac. of Amt. of Syn. Syn. Fert. N N Applied to Applied that Soil that Volatilizes 2 Volatilizes Frac (GASFS) (kg N/kg N) (kg N/kg N) Default Values C=(A B) (Table 4-A) Total N Excretion by livestock 3 N (NEX) (kg N/yr) Frac. of Total Manure N Excreted that Volatilizes Frac (GASM) (Kg N/Kg N) Default Values 4 (Table 4.17) Total N Excreted by livestock that Volatilizes (kg N/kg N) F=(D x E) Emission Factor EF 4 Default Values 5 (Table 4.18) N 2 Emissions (Gg N 2 -N/yr) H=(C+F) Gg 10-6 Atlantic Prov. 27,799, , Quebec 89,443, ,944, ,752, ,150, ntario 219,446, ,944, , , Manitoba 235,960, ,596,000 66,837, ,367, Saskatch. 317,600, ,760,000 93,879, ,775, Alberta 308,908, ,890, ,179, , B. C. 33,537, ,353,700 39,957, ,2 7,991, CANADA 1,204,894, ,489, ,968, ,393, Spearin and 'Connor, Based from Statistics Canada, IPCC/ECD,1996b; (Table 4-18). 2 4 IPCC/ECD,1996a; (Table 4-A). IPCC/ECD,1996b; (Table 4-17). 16
22 Table 9. Indirect N 2 emissions from atmospheric deposition of NH 3 and N x in A B C D E F G H Synthetic fertilizer N (fert) 1 (kg N/yr) Fraction of Syn. Fert. N Applied that Volatilizes 2 Frac (GASFS) (kg N/kg N) Amt. of Syn. N Applied to Soil that Volatilizes (kg N/kg N) Total N Excretion by livestock N (NEX) 3 (kg N/yr) Fraction of Total Manure N Excreted that Volatilizes Frac (GASM) (Kg N/Kg N) Total N Excreted by livestock that Volatilizes (kg N/kg N) Emission Factor EF 4 N 2 Emissions (Gg N 2 -N /yr) Province Default Values (Table 4-A) C=(A x B) Default Values 4 (Table 4-17) F=(D x E) Default Values 5 (Table 4-18) Atlantic Prov. 25,850, ,170, H=(C+F) xgg x 10-6 Quebec 91,760, ,176, ,130, ,626, ntario 174,860, ,486, ,319, ,063, Manitoba 254,903, ,490,300 67,880, ,576, Saskatchewan 226,396, ,639, ,669, ,133, Alberta 328,301, ,830, ,642, ,528, B. C. 21,791, ,179,100 38,759, ,751, CANADA 1,121,273, ,127, ,252, ,850, Spearin and 'Connor, IPCC/ECD,1996a; (Table 4-A). 3 Based from Statistics Canada, IPCC/ECD,1996b; (Table 4-17). 5 IPCC/ECD,1996b; (Table 4-18). Tables 10 and 11 summarize the N 2 emissions from N leaching and runoff (columns I-M). Canada contributed a total of Gg N 2 -N/yr and Gg N 2 -N/yr from N leaching and runoff in 1986 and 1991, respectively. The highest indirect emissions from N leaching and runoff were from the province Alberta. Total indirect N 2 emissions for 1986 (27.10 Gg N 2 ) are slightly higher compared to the emissions for 1991 (26.39 Gg N 2 ). This is consistent with the estimates from nitrogen fertilizers and nitrogen from animal manures. Table 10. Indirect N 2 emissions from N leaching in Province I J K L M N Livestock N Fraction of N that N Emission 2 Total Indirect Synthetic Excretion Leaches 2 3 Factor 4 Emissions N 2 Emissions Fertilizer Used, N (NEX) Frac (LEACH) From 1 N (fert) Leaching EF 5 (kg N/yr) (kg N/yr) (kg N/kg N) Default Values (Table 4-17) Default Values (Table 4-18) (Gg N 2 -N/yr) M=(I+J) K L 10 4 (Gg N 2 /yr) N=(H+M)[44/28] Atlantic Prov. 27,799, Quebec 89,443, ,752, ntario 219,446, ,561, Manitoba 235,960,000 66,637, Saskatchewan 317,600,000 93,879, Alberta 308,908, ,179, B. C. 33,537,000 39,957, CANADA 1,204,894, ,968, Spearin and 'Connor, Based from Statistics Canada, IPCC/ECD, 19966; (Table 4-17). 4 IPCC/ECD, 1996b; (Table 4-18). 17
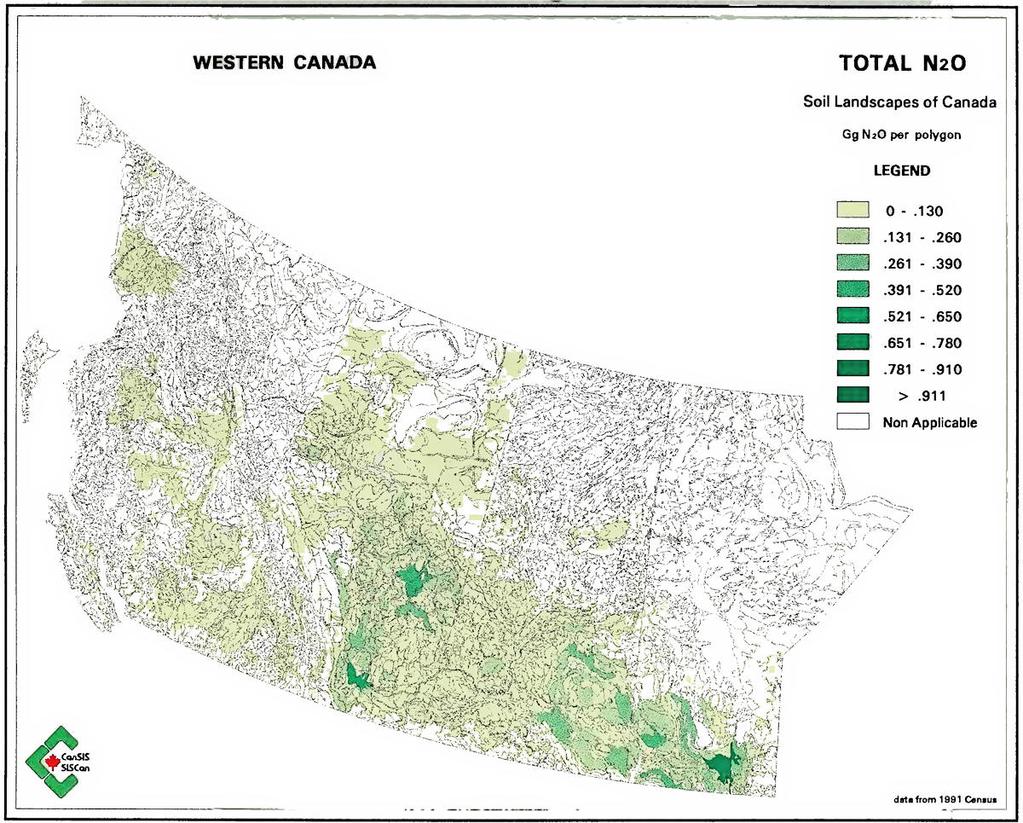
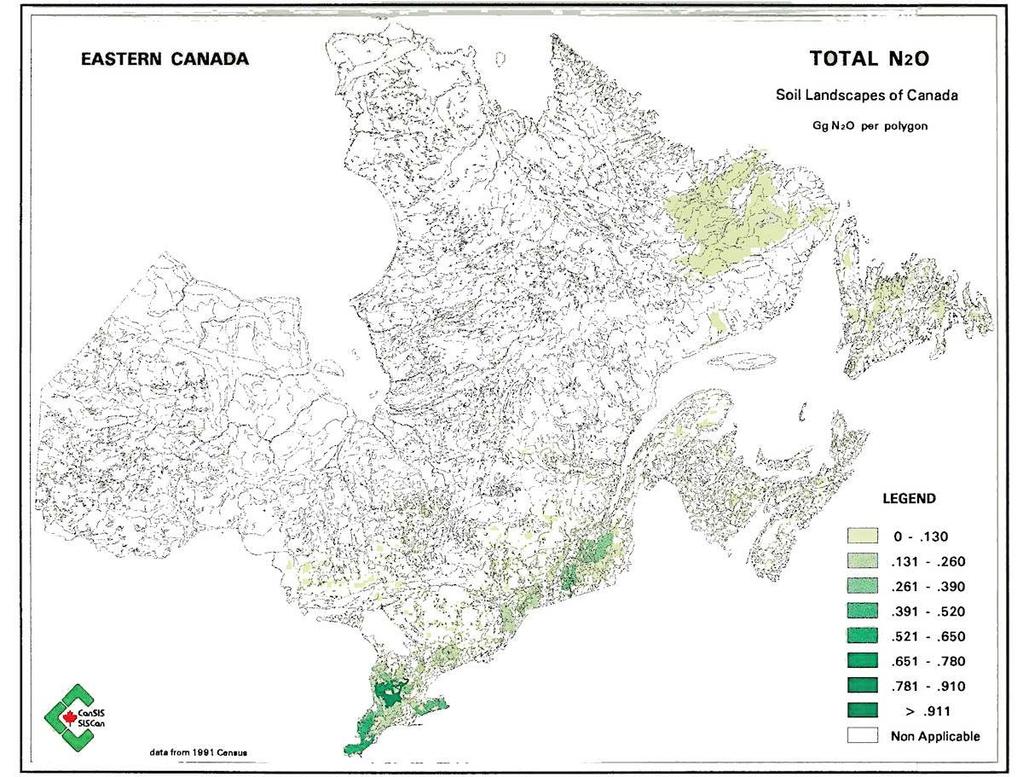
23 Table 11. Indirect N 2 emissions from N leaching in I J K L M N Synthetic Livestock N Fraction of N N 2 Emissions Fertilizer Used, Excretion that Leaches From Leaching 1 2 N (fert) N 3 (NEX) Frac (LEACH) Total Indirect N 2 Emissions Emission Factor 4 EF 5 (kg N/yr) (kg N/yr) (kg N/kg N) (Gg N 2 -N/yr) (Gg N 2 /yr) Province Default Values Default Values (Table 4-17) (Table 4-18) M=(I+J) K L 10 4 N=(H+M)[44/28] Atlantic Prov. 25,850, Quebec 91,760, ,130, ntario 174,860, ,319, Manitoba 254,903,000 67,880, Saskatchewan 226,396, ,669, Alberta 328,301, ,642, B. C. 21,791,000 38, CANADA 1,121,273, ,252, Spearin and 'Connor, Based from Statistics Canada, IPCC/ECD, 1996b; (Table 4-17). 4 IPCC ECD, 1996b; (Table 4-18). 3.4 Estimates of Total N 2 Emissions from Agricultural Soils The estimated total N 2 emissions from agricultural soils are summarized in Table 12. The most significant emissions were from the direct emissions from soils, which contain more than half of total emissions. Nitrous oxide emissions from agricultural soils contributed a total of ~ Gg N 2 in 1986 and ~ Gg N 2 in Alberta contributed most to the total N 2 emissions from agricultural soils followed by ntario and Saskatchewan. Table 12. Total N 2 emissions from agricultural soils by province in 1986 and Province A B C D Direct Emissions from soils Direct Emissions from Grazing Animals Indirect Emissions NH 3 & N x, Leaching (Gg) (Gg) (Gg) Total N 2 Emissions (Gg) D=A+B+C Atlantic Provinces Quebec ntario Manitoba Saskatchewan Alberta B. C CANADA The total N 2 emissions occurring in eastern and western Canada are shown in Figures 2a and b. The emissions are given Gg of N 2 at the scale of the Soil Landscape of Canada (SLC) polygon level. These are stratified into major soil zones and textural classes. The relative changes in N 2 emissions on a provincial basis for 1986 to 1991 are shown in Figure 3. These values depend of the amount and type of agriculture practiced in each of the provinces. 18
24 19
25 20

26 ntario, Saskatchewan and Alberta have the highest N 2 emissions, but they also have the largest agricultural regions. The only increases in total N 2 emissions from agricultural soils between 1986 and 1991 were in Manitoba and Alberta. This is perhaps because these provinces were the only two to increase fertilizer applications (F SN ) between 1986 and 1991 (Tables 5 and 6). The largest decrease in total emissions from soils was in Saskatchewan. This is largely due to a decrease in most sources contributing to direct N 2 emissions from agricultural soils (also Tables 5 and 6). Figure 3. Total N 2 emissions from agricultural soils by province in 1986 and Estimates of N 2 Emissions from other Sources. Tables 13 and 14 present the N 2 emissions from the different animal waste management systems (AWMS). About 4.32 Gg and 4.43 Gg of N 2 in 1986 and 1991 respectively, were emitted from this source. The highest contributions were from ntario (1.18 Gg N 2 ) in 1986 and Alberta (1.12 Gg N 2 ) in Table 13. Total N 2 emissions from animal waste management systems by province in Province A B C Nitrogen Excretion N (NEX) (AWMS) Emission Factor for AWMS (EF3) 2 (kg N/yr) 1 (Kg N 2 -N/kg N) (Gg) AL LS SSD S AL LS SSD S Annual N 2 Emissions C= (AxB) [44/28] 10-6 Atlantic Prov. 1, , , , Quebec 6, , , , ntario 6, , , , Manitoba , , , Saskatchewan , , , Alberta 2, , , , B. C. 1, , , , , CANADA 19, , ,238, , Based from Statistics Canada, 1993, 2 IPCC/ECD, 1996b; Table
27 Table 14. Total N 2 emissions from animal waste management systems by province in A B C Nitrogen Excretion N (NEX) (AWMS) Emission Factor for AWMS (EF3) 2 Annual N 2 Province Emissions (kg N/yr) 1 (kg N 2 -N/kg N) (Gg) AL LS SSD S AL LS SSD S C=(AxB) [44/28] 10-6 Atlantic Prov. 1, , , , Quebec 6, , , , ntario 6, , , , Manitoba 1, , , , Saskatchewan 1, , , , Alberta 2, , , , B.C. 1, , , , CANADA 20, , ,299, ,816, Based from Statistics Canada, IPCC/ECD, 1996b; Table 4-8. Table 15 shows the N 2 contribution from human sewage. This is a minor source and the emissions are directly related to population density. Table 15. N 2 emissions from human sewage by province in 1986 and Province Total Population 1 A B C D E Annual per capita Protein Consumption (kg/person/yr) Fraction of nitrogen in protein (kg N/kg of protein) 2 Default Emission Factor for Indirect Emissions kg N 2 -N/kg sewage-n produced 3 EF 6 Total Nitrous xide Emissions E=A B C D [44/28] Atlantic Prov. 2,277,613 2,322, Quebec 6,532,461 6,896, ntario 9,101,694 10,085, Manitoba 1,063,016 1,092, Saskatchewan 1,009, , Alberta 2,365,825 2,546, B. C. 3,282,061 3,282, CANADA 25,309,331 27,297, Estimated from 1991 Population; Statistics Canada Cat. No IPCC/ECD, 1996a; Table IPCC/ECD, 1996b; Table (Gg) 3.6 Estimates of Total N 2 Emission from Agriculture A summary of the N 2 emissions from various agricultural sources and the total agricultural N 2 emissions for Canada is shown in Figure 4, for the years 1986 and
28 Figure 4. Total N 2 emissions for Canada in 1986 and Total N 2 emissions in Canada decreased between 1986 and 1991, from and Gg (Table 12). The largest contributors were (in descending order of magnitude) from direct emissions from agricultural soils, N leaching and grazing animals. ut of these, only N 2 emissions from grazing animals increased between 1986 and The total national N 2 emissions can be expressed in C 2 equivalency (using the 100 year GWP Time Horizon) as Gg C 2 equivalent in 1986 and Gg C 2 equivalent in Summary and Conclusion This report presents an estimate of the N 2 emissions from agricultural sources in Canada, using the 1996 Revised IPCC/ECD methodologies for 1986 and The direct emissions from agricultural soils represent about half of the total emissions. This corresponds to Gg N 2 in 1986 and Gg N 2 in Crop residues (37%) and N fertilizers (31%) were the most important sources of direct emissions. The relative importance of N 2 emissions among the five direct sources is: crop residues, N fertilizers, animal wastes, biological nitrogen-fixing crops, and histosols. The estimated emissions from grazing animals accounted for Gg N 2 and Gg N 2 in 1986 and 1991, respectively. Higher emissions were found in Alberta where the largest concentration of grazing cattle is found. Emissions from animal wastes during storage were about 4.32 Gg N 2 and 4.43 Gg N 2 in 1986 and 1991 respectively. Emissions from human sewage were about 2.37 Gg N 2 (1986) and 2.56 Gg N 2 (1991). verall, N 2 emissions were higher in Alberta, ntario and Saskatchewan. These are proportional to the level of agricultural activity found in these provinces. Agricultural soils in Canada contributed a total of ~ Gg N 2 in 1986 and ~ Gg N 2 in
29 The results calculated in this report do not take into account any N 2 emissions produced from fossil fuel consumed on the farm. Liu (1995) estimated that about 2 Gg of N 2 was emitted in 1986 and 1991 from this source. 5.0 Future Undertakings It is well recognized that the methodology used in this report still has many limitations. Although the results provide a good indication of the magnitude of emissions from the various agricultural sources, this report does not take into account environmental conditions that might have considerable influence on the inter-annual variations of N 2 emissions. As well, the emission factors are still highly uncertain because of the high degree of spatial variation of N 2 emissions. Results from the inventory will soon be compared to model results obtained using the DNDC model recently developed by Li et al. (1994). Field measurements using enclosures and tunable diode are presently being collected. These studies should provide emission factors that are more representative of conditions across Canada. 24
30 Acknowledgments The organizers of the PERD program for financial support; the Southeast Asia Regional Committee (SARS) Secretariat/Global Change System for Analysis and Training (START) for the Fellowship grant which permitted the senior author to spend four months in Research Branch Laboratories in ttawa; Dr. Arvin Mosier who provided the reference materials of the 1996 Revised IPCC/ECD Inventory Methodology and his technical advice; Ward Smith and Richard Riznek for the helpful discussions; Dan Sabourin and Brian Monnet for preparing the maps; and Richard Riznek, Corinne Merrill and Michelle Buckley for helping in the preparation of the report. 25
31 List of Figures Figure 1 Schematic of main sources considered for calculation of N 2 emissions 3 Figure 2a N 2 emissions from western Canada 19 Figure 2b N 2 emissions from eastern Canada 20 Figure 3 Total N 2 emissions from agricultural soils by province in 1986 and Figure 4 Total N 2 emissions for Canada in 1986 and Lists of Tables Table 1 Percentage of N fertilizer evolved as N 2 4 Table 2 N content in manure from various animal types and manure N produced 5 in pasture and paddock as well as respective emission factors Table 3 Default values for N-fixing crops and crop residues 8 Table 4 Default values for N excretion per head per animal type 12 Table 5 Magnitude of the sources of the direct N 2 emission from agricultural 14 soils in 1986 Table 6. Magnitude of the sources of the direct N 2 emission from agricultural 14 soils in 1991 Table 7. Total N 2 emissions from grazing animals by province in 1986 and Table 8 Indirect N 2 emissions from atmospheric deposition NH 3 and N x, in Table 9 Indirect N 2 emissions from atmospheric deposition NH 3 and N x, in Table 10 Indirect N 2 emissions from N leaching in Table 11 Indirect N 2 emissions from N leaching in Table 12 Total N 2 emissions from agricultural soils by province in 1986 and Table 13 Total N 2 emissions from animal waste management systems by 21 province in 1986 Table 14 Total N 2 emissions from animal waste management systems by 22 province in 1991 Table 15 N 2 emissions from human sewage by province in 1986 and
32 References Angers, D.A., and A. N'Dayegamiye Effects of manure application on carbon, nitrogen and carbohydrate contents of a silt loam and its particle-size fractions. Biol. Fert. Soils. 11: Asselstine, A., and L. Girard Canadian fertilizer consumption, shipments and trade, 1990/1991. Farm Development Policy Directorate. Farm input markets unit, Agriculture Canada. Batjes, N.H., and E.M. Bridges World inventory of soil emissions. International Soil Reference and Information Centre, Wageningen, The Netherlands, p Blevins, R.L., and W.W. Frye Conservation tillage in soil management. Adv. Agron. 51: Bouwman, A.F Exchange of greenhouse gases between terrestrial ecosystems and the atmosphere. In A.F. Bouwman (ed.), Soils and greenhouse effect. John Wiley and Sons, N.Y., p Bouwman, A.F Direct emission of nitrous oxide from agricultural soils. Nutrient cycling of agroecosystems. Kluwer Academic Publishers, 46: Bremmer, J.M. and A.M. Blackmer Nitrous xide: Emission from soils during nitrification of fertilizer nitrogen. Science 199: Byrnes, B.H., C.B. Christianson, L.S. Holt and E.R. Austin Nitrous xide emissions from the nitrification of nitrogen fertilizer. p In A.F. Bouwman (ed.), Soils and greenhouse effect: the present status and future trends concerning the effects of soils and their cover on the fluxes of greenhouse gases, the surface energy balance and the water balance. John Wiley and Sons, Chester, England. Collins, H.P., P.E. Rasmussen, & C.L. Douglas Jr Crop rotation and residue management effects on soil carbon and microbial dynamics. Soil Sc. Soc. Am. J. 56: Culley, J.L.B., and G.M. Barnett Land Disposal of Manure in the Province of Quebec. Canadian Journal of Soil Science. 64: Czepiel, P., P. Crill, and R. Harriss Nitrous oxide emissions from municipal wastewater treatment. Environ. Sci. Technol. 29: Duxbury, J.M., L.A. Harper and A. R. Mosier Contribution of agroecosystems to global climate change. p In L.A. Harper, A. R. Mosier, J.M. Duxbury and D.E. Rolston (eds.) Agricultural ecosystem effects on trace gases and global climate change. Amer. Soc. Agron. Publication No