Market Outlook. David Reinbott.
|
|
|
- Shawn Townsend
- 5 years ago
- Views:
Transcription
1 Market Outlook David Reinbott Agriculture Business Specialist P.O. Box 187 Benton, MO (573)
2 Trending Issues China, Weather & Money Flow Pre-2007 Marketing trends Big Crops in the U.S. and World U.S and World Growing Ending Stocks Corn Export Good Soybean Exports Slow Larger South American Corn and Soybean crops in Strong Dollar
3 Trending Issues Volatile World Trade Agreements Chinese Economic Growth China corn stocks Weather El Nino Weather Threat
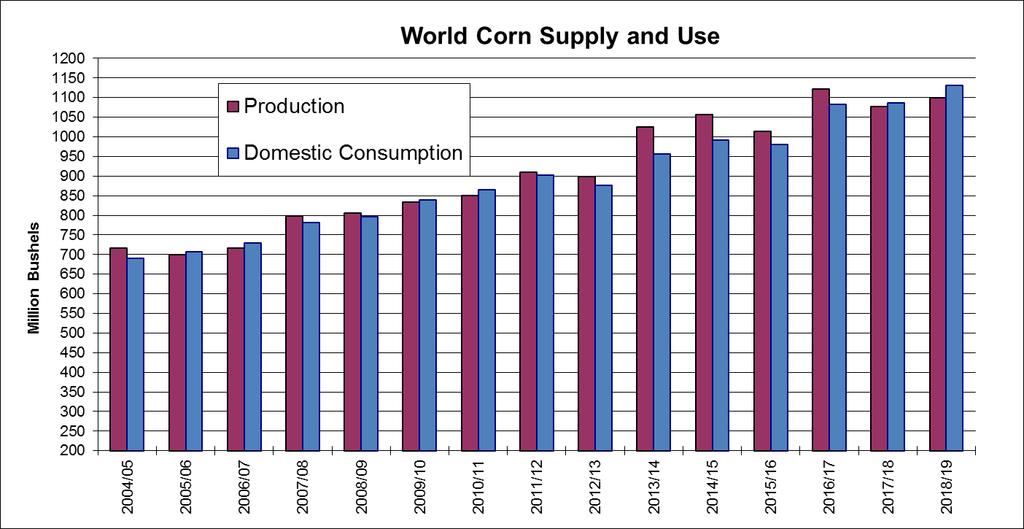
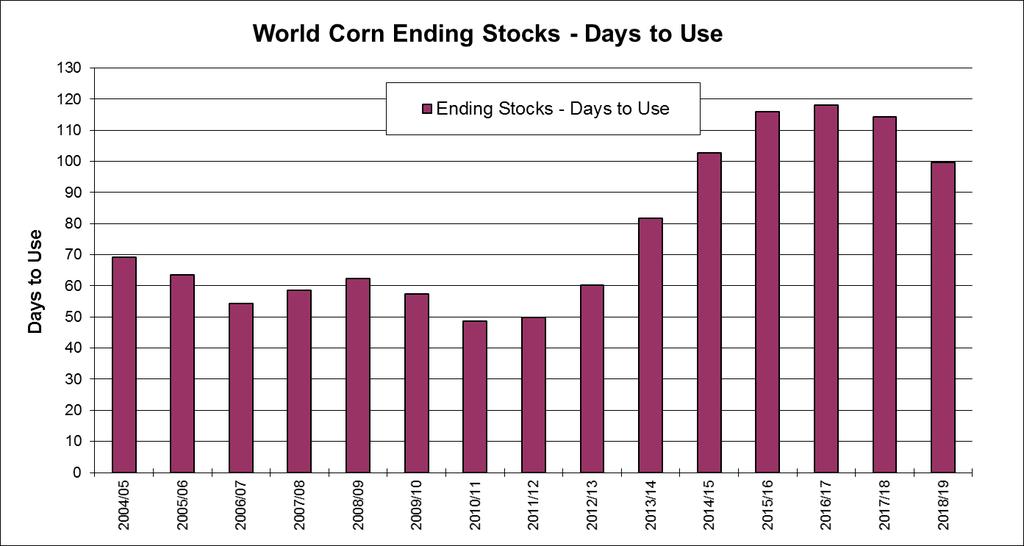
4 Trending Issues January Report bigger crop? World Production Increasing? World Demand Steady? World Ending Stocks Increasing? Quarterly Stocks Feed?

5 David Reinbott November 19, 2018
6
7
8
9
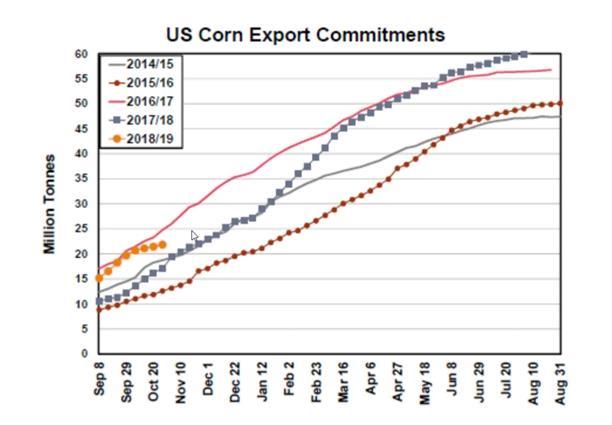
10 Accumulated US Corn Exports and Outstanding Sales to All Countries (As of November 15, 2018) 3,000 2,500 Million Bushels 2,000 1,500 1, /2 9/23 10/14 11/4 11/25 12/16 1/6 1/27 2/17 3/10 3/31 4/21 5/12 6/2 6/23 7/14 8/4 8/ / / / / /19

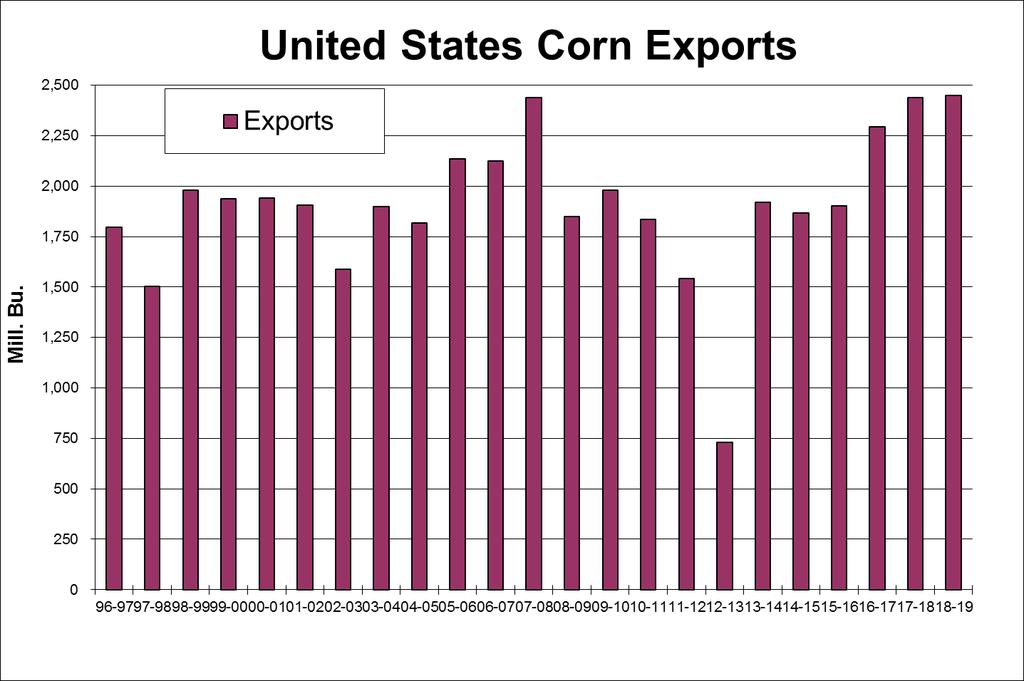
11 Exports Account for 22% of Corn Demand
12 Corn Supply & Use in Argentina and Brazil November 2018 The 2017/18 drought in Argentina reduced corn yields by 26% from the previous year. Brazil s corn yields were reduce 12% from the previous year. Notice the recovery projected by USDA for corn exports in 2018/19. Keep in mind that Brazil plants two corn crops and their 2018/19 corn area can change substantially depending on the economics when the safrinha crop is
13
14
15
16
17
18
19
20
21
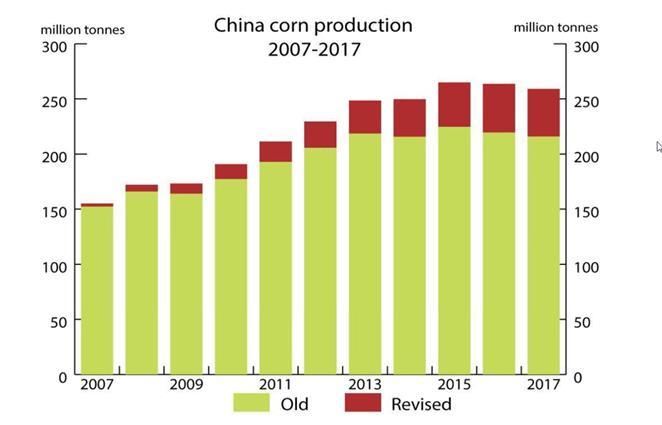
22 China s Historical Data Revisions 2017/18 Example For years many speculated that China s corn stocks were much higher China officially revised their corn data in October and those revision were reflected in USDA s Nov PSD Revisions were made back through As show in the table in 2017/18: Corn area revised up 20% Corn production revised up 20% Feed use revised up 12% Food, Seed, & Industrial use revised up 3% Stocks revised up 9.1% Implication: Significant Chinese corn imports unlikely for the foreseeable future.
23
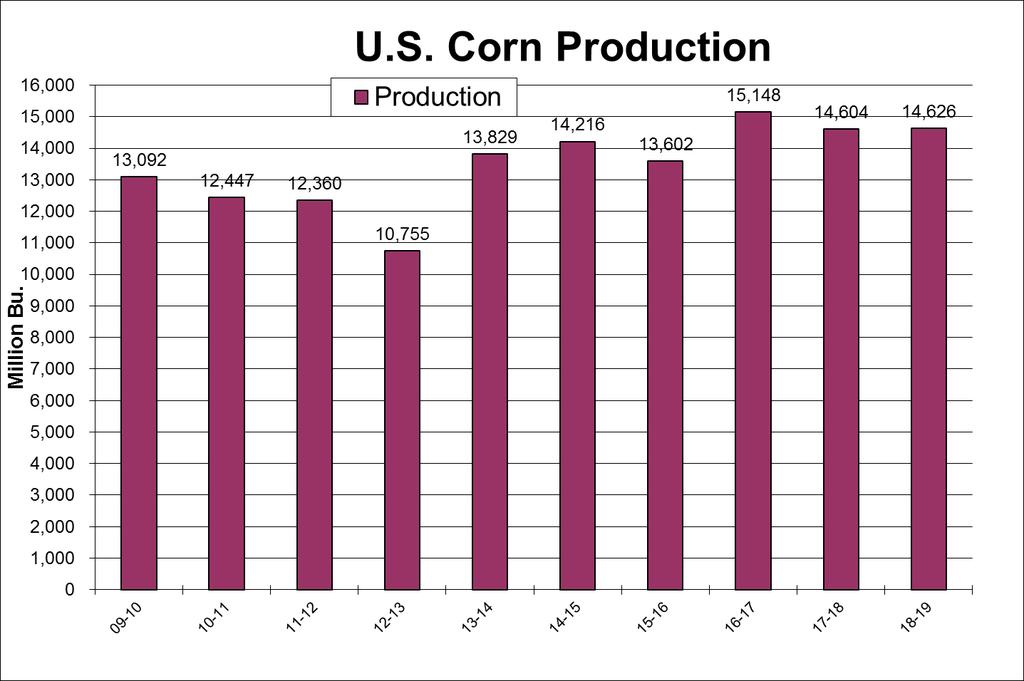
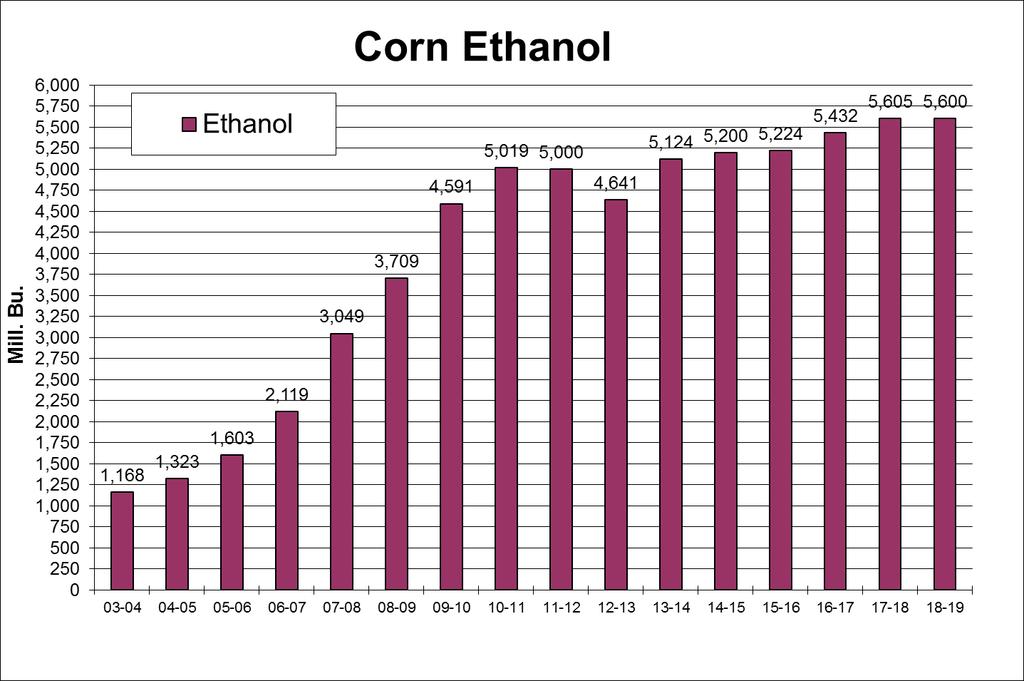
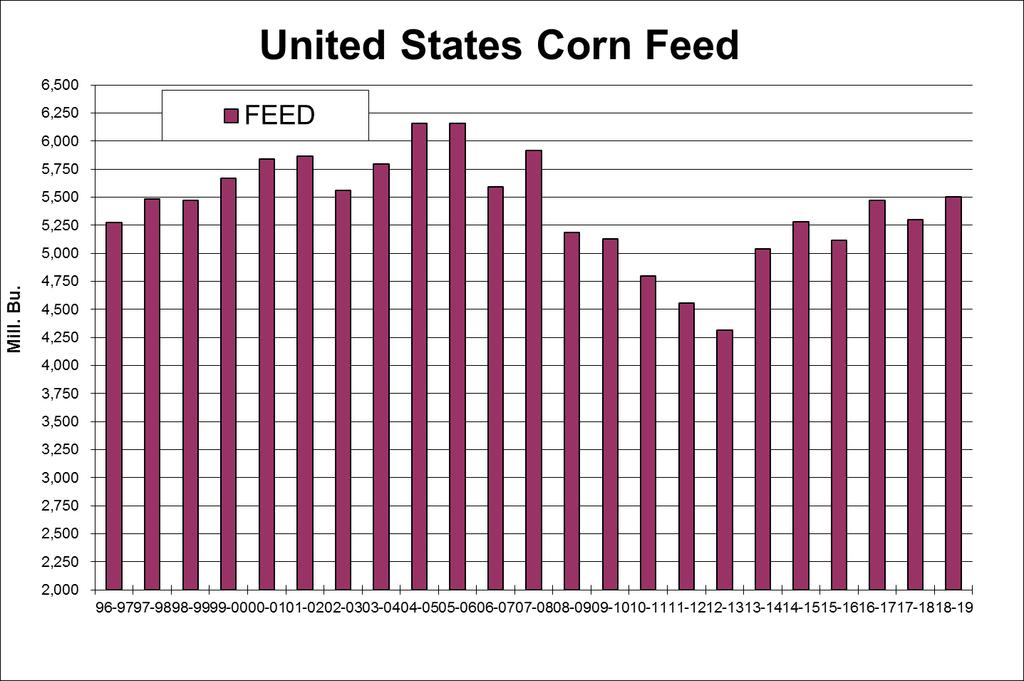
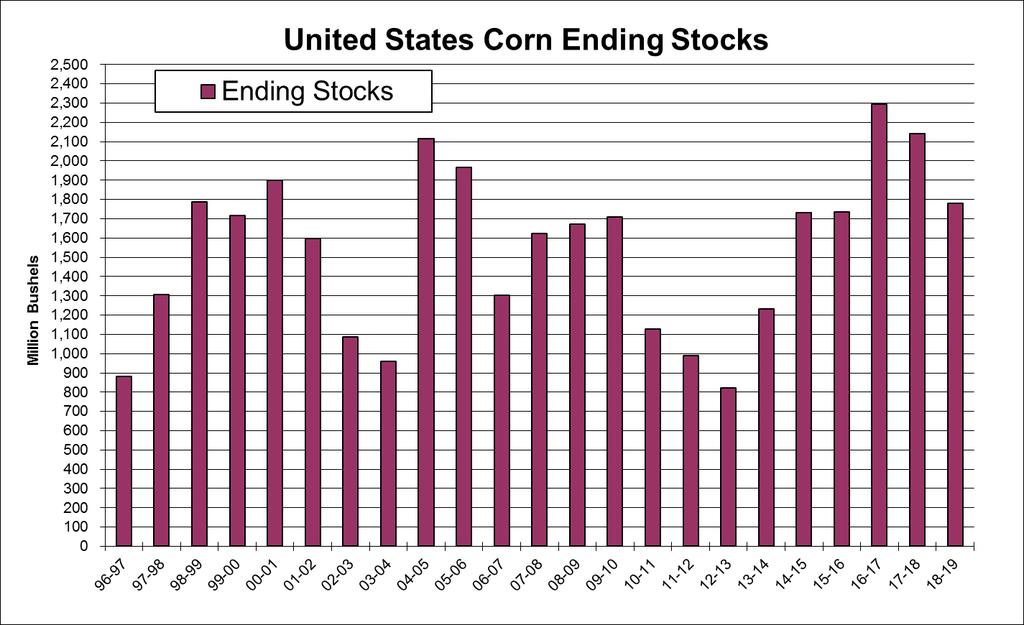
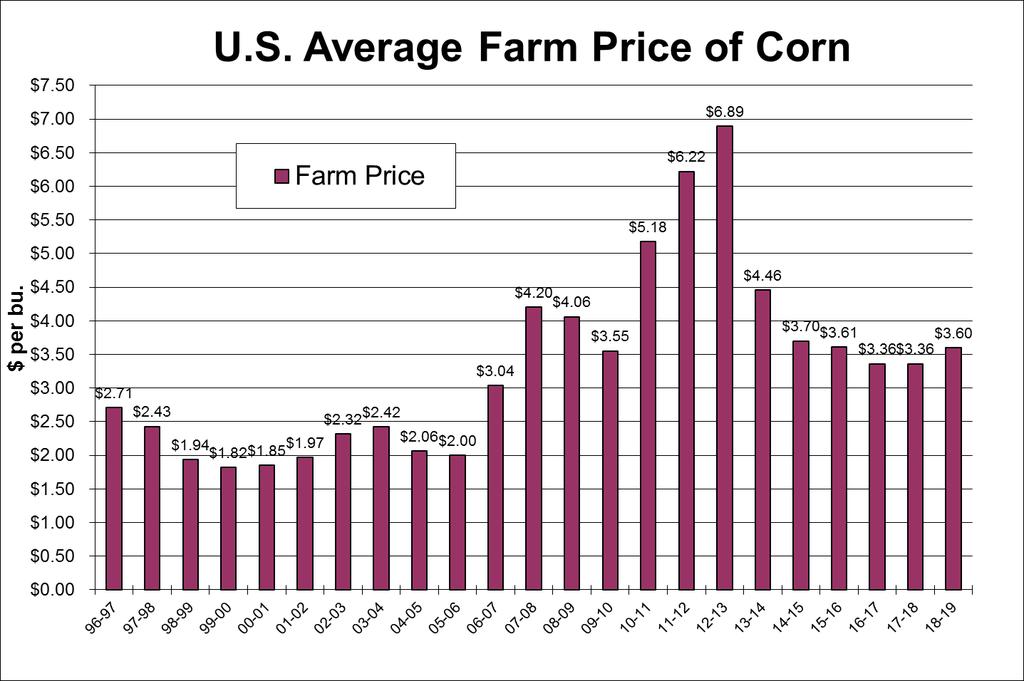
24 U.S. Corn: Supply & Use 2016/ / /19 Planted Acres Harvested Acres Yield Beginning Stocks 1,738 2,294 2,140 Production 15,148 14,604 14,626 Imports Total supply 16,943 16,934 16,816 Feed & Residual 5,470 5,298 5,500 Food, Seed, & Industrial 6,885 7,058 7,130 Ethanol 5,432 5,605 5,650 Total Domestic 12,355 12,356 12,630 Export 2,294 2,438 2,450 Total use 14,649 14,794 15,080 Ending Stocks 2,294 2,140 1,736 Stocks/Use 15.7% 14.5% 11.5% Ave Farm Price $3.36 $3.36 $3.60
25 U.S. New Crop Balance Sheets Corn Balance Sheet U.S. Corn: Supply & Use Up 3 million New Crop New Crop New Crop 2018/ / / /20 Planted Acres Harvested Acres Yield Beginning Stocks 2,140 1,781 1,781 1,781 Production 14,626 14,542 14,796 15,219 Imports Total supply 16,811 16,373 16,627 17,050 Feed & Residual 5,500 5,650 5,650 5,650 Food, Seed, & Industrial 7,080 7,200 7,200 7,200 Ethanol 5,600 5,650 5,650 5,650 Total Domestic 12,580 12,850 12,850 12,850 Export 2,450 2,300 2,300 2,300 Total use 15,030 15,150 15,150 15,150 Ending Stocks 1,781 1,223 1,477 1,900 Stocks/Use 11.8% 8.1% 9.7% 12.5% Ave Farm Price $3.60 $4.02 $3.83 $3.64
26 March 2019 Corn Futures
27 March 2019 Corn Futures $4.35 Objective
28 December 2019 Corn Futures

29 December 2019 Corn Futures $4.30 Objective
30 Weekly December Corn Futures
31 Corn - Old Crop Cash Hist Return Month Price Futures Basis Basis Storage Dec $3.85 $3.85 $0.00 $0.08 Jan $3.93 $3.85 $0.08 $0.14 $0.04 Feb $3.98 $3.85 $0.13 $0.19 $0.06 Mar $4.01 $3.92 $0.09 $0.14 $0.05 Aug $3.92 $4.00 -$0.08 $0.02 -$0.21 Sept $3.92 $4.04 -$0.12 -$0.21 -$0.25 Oct $3.96 $4.04 -$0.08 -$0.10 -$0.24

32 David Reinbott November 19, 2018
33
34
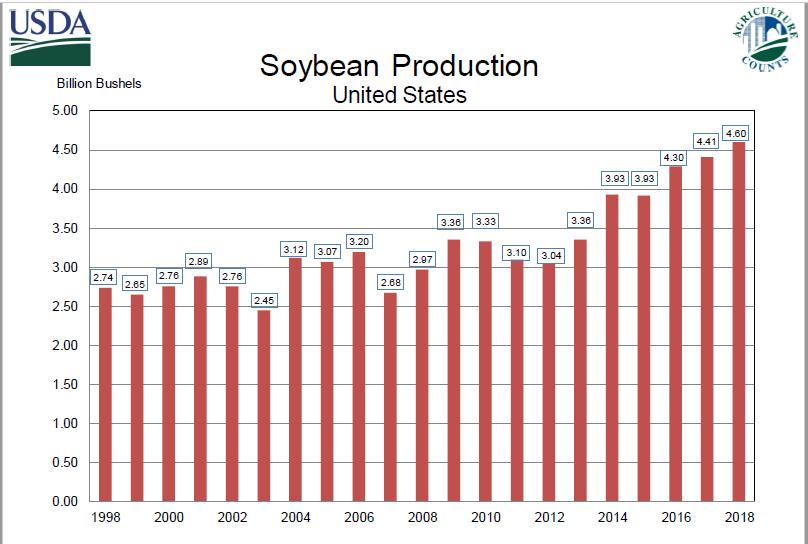
35 Mill. Bu. United States Soybeans Production 5,000 4,500 Production 4,000 3,500 3,000 2,500 2,000 1,500 1,
36 Mill. Bu. 2,200 2,100 2,000 1,900 1,800 1,700 1,600 1,500 1,400 1,300 1,200 1,100 1, United States Soybeans Crush CRUSH
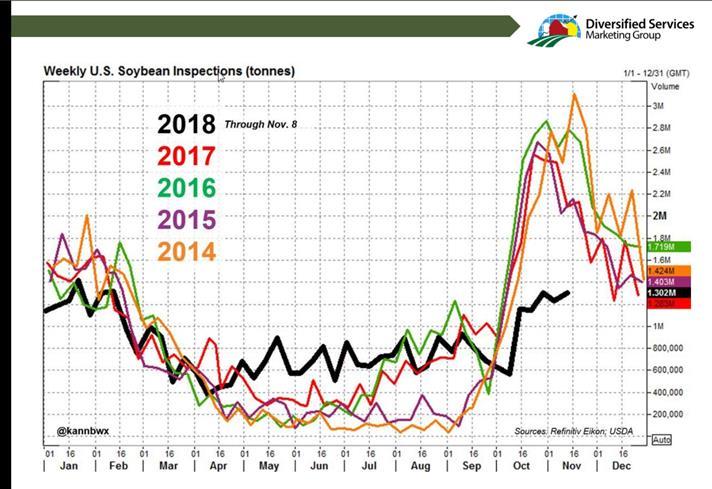
37 Mill. Bu. 2,300 2,200 2,100 2,000 1,900 1,800 1,700 1,600 1,500 1,400 1,300 1,200 1,100 1, United States Soybeans Exports Exports
38
39
40 9/2 9/23 10/14 11/4 11/25 12/16 1/6 1/27 2/17 3/10 3/31 4/21 5/12 6/2 6/23 7/14 8/4 8/25 Million Bushels Accumulated Soybean Exports and Outstanding Sales to All Countries (As of November 15, 2018) 2,500 2,000 1,500 1, / / / / /19
41 9/2 9/23 10/14 11/4 11/25 12/16 1/6 1/27 2/17 3/10 3/31 4/21 5/12 6/2 6/23 7/14 8/4 8/25 Million Bushels Accumulated US Soybean Exports to China (As of November 15, 2018) 1,600 1,400 1,200 1, / / / / /19
42 16/17 17/18 18/19 16/17 17/18 18/19 16/17 17/18 18/19 16/17 17/18 18/19 16/17 17/18 18/19 16/17 17/18 18/19 16/17 17/18 18/19 16/17 17/18 18/19 16/17 17/18 18/19 Million Bushels Accumulated US Soybean Exports and Outstanding Sales to Top Export Destinations (YTD as of November 15, 2018) China European Union - 27 Mexico Indonesia Japan Taiwan Bangladesh Thailand Egypt
43 China Soybean Supply & Use China s Strategy in the Trade War Import as few US soybeans as possible by sourcing from other countries. Substitute other protein meals for soybean meal. Reduce the meal inclusion rate in livestock rations. Increase domestic soybean production. Draw down ending stocks
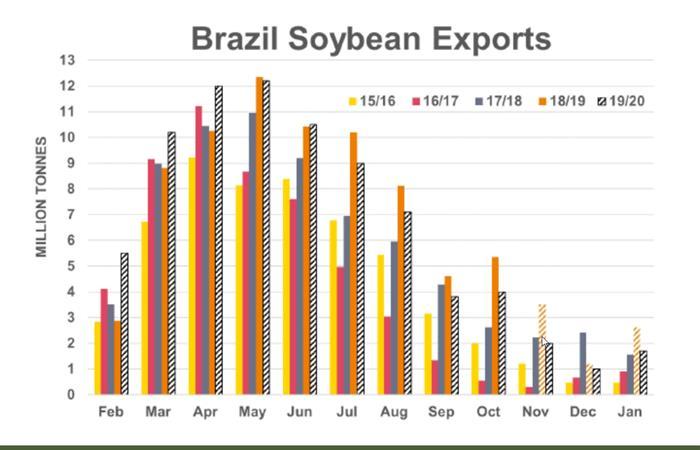
44 Global Soybean Spot Prices October 2017 October 2018 Has China s strategy worked? They have successfully limited imports of US soybeans to under 24 million bushels. US soybean exports and outstanding sales are now 395 million bushels below last year s export levels at this time. Argentina and Brazil crushing industries are struggling because of negative crushing margins since the Chinese have bid up the price of their soybeans. Argentina has increased their export tariff on soybeans and Brazil is considering imposing a 10% export tariff on soybeans. Soybean arbitrage has been slow to happen. Some have suggest this is because Argentina and Brazil s port infrastructure is designed for exports, not imports. In addition, it also takes time to set up new trade pathways. China is getting desperate to find non-us protein meal. If price differences persist, the market will find a way to arbitrage US soybeans.
45 Million Bushels 1, Soybean Stocks Ending Stocks
46 Ending Stocks to Days of Use Soybean Ending Stocks - Days of Use Days of Use
47 $ per bu. United States Average Farm Price of Soybeans $16.00 $15.00 $14.00 $13.00 $12.00 Farm Price $14.40 $13.00 $12.50 $11.30 $11.00 $10.00 $9.00 $10.10 $9.97 $9.59 $10.10 $9.47 $9.33 $8.95 $8.60 $8.00 $7.35 $7.34 $7.00 $6.47 $6.43 $6.00 $5.00 $4.00 $3.00 $2.00 $1.00 $0.00 $4.93 $4.63 $4.54 $4.38 $5.53 $5.74 $5.66
48
49 2004/ / / / / / / / / / / / / / /19 Million Metric Tons World Soybean Ending Stocks and Ending Stocks to Use Ending Stocks Ending Stocks to Use 35% 30% 25% 20% 15% 10% 5% 0%
50 2004/ / / / / / / / / / / / / / /19 Million Metric Tons China Soybean Production, Domestic Use and Imports Production Domestic Use Imports
51 2004/ / / / / / / / / / / / / / /19 Million Metric Tons South America Soybean Production South America
52 Soybean Balance Sheet U.S. Soybean: Supply & Use 2016/ / /19 Planted Acres Harvested Acres Yield Beginning Stocks Production 4,296 4,411 4,600 Imports Total supply 4,516 4,736 5,065 Crush 1,901 2,055 2,080 Seed & Feed Total Domestic 2,047 2,167 2,208 Export 2,166 2,129 1,900 Total use 4,213 4,296 4,108 Ending Stocks Stocks/Use 7.2% 10.2% 23.3% Ave Farm Price $9.47 $9.33 $8.60
53 Soybean Balance Sheet U.S. Soybean: Supply & Use Down 6 million New Crop New Crop New Crop 2018/ / / /20 Planted Acres Harvested Acres Yield Beginning Stocks Production 4,600 3,961 4,126 4,291 Imports Total supply 5,065 4,948 5,113 5,278 Crush 2,080 2,100 2,100 2,100 Seed & Feed Total Domestic 2,208 2,235 2,235 2,235 Export 1,900 2,100 2,100 2,100 Total use 4,108 4,335 4,335 4,335 Ending Stocks Stocks/Use 23.3% 14.1% 17.9% 21.8% Ave Farm Price $8.60 $8.86 $8.74 $8.66
54 March 2019 Soybeans Futures
55 March 2019 Soybeans Futures $10.20 Objective
56 November 2019 Soybeans Futures

57 November 2019 Soybeans Futures $10.20 Objective
58 Weekly November Soybean Futures
59 Soybeans - Old Crop Cash Hist Return Month Price Futures Basis Basis Storage Dec $8.85 $9.15 -$0.30 $0.34 Jan $8.93 $9.28 -$0.35 $0.33 $0.03 Feb $9.06 $9.28 -$0.22 $0.28 $0.11 Mar $9.10 $9.41 -$0.31 $0.15 $0.10 Oct $9.36 $9.62 -$0.26 $0.14 $0.01 Nov $9.32 $9.70 -$0.38 $0.18 -$0.08

60 David Reinbott November 19, 2018
61 Oct-15 Dec-15 Feb-16 Apr-16 Jun-16 Aug-16 Oct-16 Dec-16 Feb-17 Apr-17 Jun-17 Aug-17 Oct-17 Dec-17 Feb-18 Apr-18 Jun-18 Aug-18 Oct-18 Thousand Contracts $/Bu Wheat Managed Money (Spec Funds) Net Position Net Position $600 $575 $550 $525 $500 $475 $450 $425 $400 $375 $350
62 Wheat Balance Sheet U.S. Wheat: Supply & Use USDA USDA 2016/ / /19 Planted Acres Harvested Acres Yield Beginning Stocks 976 1,181 1,100 Production 2,309 1,740 1,884 Imports Total supply 3,403 3,078 3,124 Feed Food, Seed, & Industrial 1,010 1,027 1,039 Total Domestic 1,171 1,077 1,149 Export 1, ,025 Total use 2,222 1,978 2,174 Ending Stocks 1,181 1, Stocks/Use 53.2% 50.7% 150.7% Ave Farm Price $3.89 $4.72 $5.10
63 Wheat Balance Sheet U.S. Wheat: Supply & Use USDA New Crop New Crop New Crop 2018/ / / /20 Planted Acres Harvested Acres Yield Beginning Stocks 1, Production 1,884 1,974 2,060 2,146 Imports Total supply 3,124 3,054 3,140 3,226 Feed Food, Seed, & Industrial 1,039 1,043 1,043 1,043 Total Domestic 1,149 1,163 1,163 1,163 Export 1,025 1,000 1,000 1,000 Total use 2,174 2,163 2,163 2,163 Ending Stocks ,063 Stocks/Use 150.7% 41.2% 45.2% 49.2% Ave Farm Price $5.10 $5.40 $5.20 $4.80
64 Million Bushels Wheat Stocks and Ending Stocks to Use 1,250 1,200 1,150 1,100 1,050 1, Ending Stocks Ending Stocks/USE % 50.0% 40.0% 30.0% 20.0% 10.0% 0.0%
65 2004/ / / / / / / / / / / / / / /19 Million Metric Tons World Wheat Ending Stocks and Ending Stocks to Use Ending Stocks Ending Stocks to Use 40% 35% 30% 25% 20% 15% 10% 5% 0%
66 July 2019 Wheat Futures

67 July 2019 Wheat Futures
68 Weekly July Wheat Futures
69 David Reinbott December 7, 2018
70 Revenue University of Missouri Extension Southeast Missouri Non-Irrigation Crop Budgets 2019 Corn GMO Soybean Roundup Ready 2 Xtend Soybean Liberty Link Cotton Wheat D. C. Soybean L.L. Estimated Yield (Bu/Acre) A Estimated Price ($/Bushel) B $3.90 $8.75 $8.75 $0.712 $5.20 $8.75 Estimated Gross Revenue ($/Acre) $ $ $ $ $ $ Total Variable Cost $ $ $ $ $ $ Total Costs (Excluding Land) $ $ $ $ $ $ Total Cost (Including Land or Rent) $ $ $ $ $ $ Estimated Returns Returns Above Variable Costs $ $ $ $ $ $ Returns Above Mach & Buildings $ $98.80 $ ($1.02) $66.34 $78.67 Returns Above Total Costs ($43.48) ($52.40) ($42.05) ($152.22) ($9.26) $3.07 Breakeven Price $4.16 $9.84 $9.63 $0.88 $5.33 $8.68 Breakeven Yield ,
71 Revenue Corn GMO Soybean Roundup Ready 2 Xtend Soybean Liberty Link Cotton Rice Convent. Wheat D. C. Soybean L.L. Estimated Yield (Bu/Acre) A Estimated Price ($/Bushel) B $3.90 $8.75 $8.75 $0.712 $5.35 $5.20 $8.75 Estimated Gross Revenue ($/Acre) $ $ $ $ $ $ $ Total Variable Cost $ $ $ $ $ $ $ Total Costs (Excluding Land) $ $ $ $ $ $ $ Total Cost (Including Land or Rent) $ $ $ $ $ $ $ Estimated Returns University of Missouri Extension Southeast Missouri Irrigation Crop Budgets 2019 Returns Above Variable Costs $ $ $ $ $ $ $ Returns Above Mach & Buildings $ $ $ $ $ $92.34 $20.21 Returns Above Total Costs ($41.38) ($30.94) ($20.59) ($1.46) $ $16.74 ($55.39) Breakeven Price $4.09 $9.23 $9.07 $0.71 $4.63 $4.98 $9.86 Breakeven Yield ,
72 Farm Labor Management Workshop December 13, 2018 Miner Convention Center, Miner, MO (Next to the Drury Inn E. Malone & I-55) Registration: 8:30 a.m. Program: 9:00 a.m. to 4:00 p.m. Fee: $20/person - Lunch Provided

73 David Reinbott November 19, 2018
74 Oct-12 Dec-12 Feb-13 Apr-13 Jun-13 Aug-13 Oct-13 Dec-13 Feb-14 Apr-14 Jun-14 Aug-14 Oct-14 Dec-14 Feb-15 Apr-15 Jun-15 Aug-15 Oct-15 Dec-15 Feb-16 Apr-16 Jun-16 Aug-16 Oct-16 Dec-16 Feb-17 Apr-17 Jun-17 Aug-17 Oct-17 Dec-17 Feb-18 Apr-18 Jun-18 Aug-18 Oct-18 $/LB Cotton Commodity Funds Net Postion
75
76
77
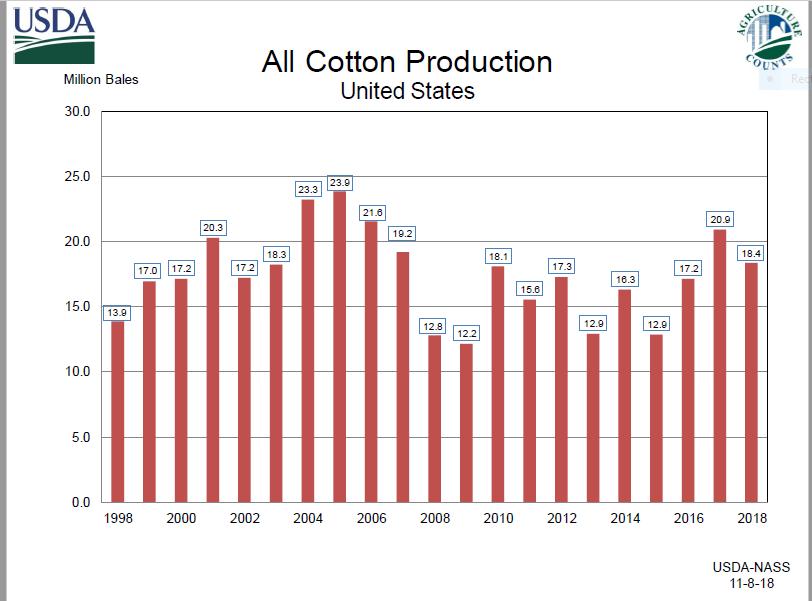
78 Million Bales Cotton Stocks and Ending Stocks to Use Ending Stocks EDST/ USE % 50.0% 40.0% 30.0% 20.0% 10.0% 0.0%
79 2004/ / / / / / / / / / / / / / /19 Million 480-pouond bales World Cotton Ending Stocks and Ending Stocks to Use Ending Stocks Ending Stocks to Use 100% 90% 80% 70% 60% 50% 40% 30% 20% 10% 0%

80 2004/ / / / / / / / / / / / / / /19 Million Bales China Cotton Production and Domestic Consumption Production Dom Cons. Imports
81 2004/ / / / / / / / / / / / / / /19 Million Metric Tons China to World Cotton Ending Stocks 70.0% 65.0% 60.0% 55.0% China to World Ending Stocks 56.37% 62.74%62.16% 62.77% 57.11% 50.0% 45.0% 40.0% 35.0% 30.0% 36.40% 32.60%33.14% 34.77% 30.16% 30.85% 43.08% 47.29% 41.14% 25.0% 20.0% 21.52% 15.0% 10.0% 5.0% 0.0%
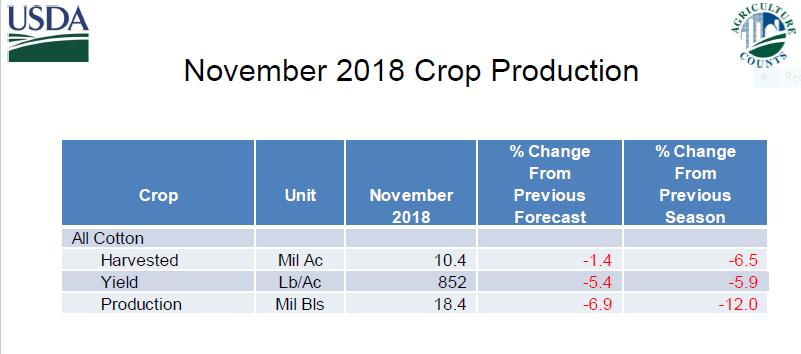
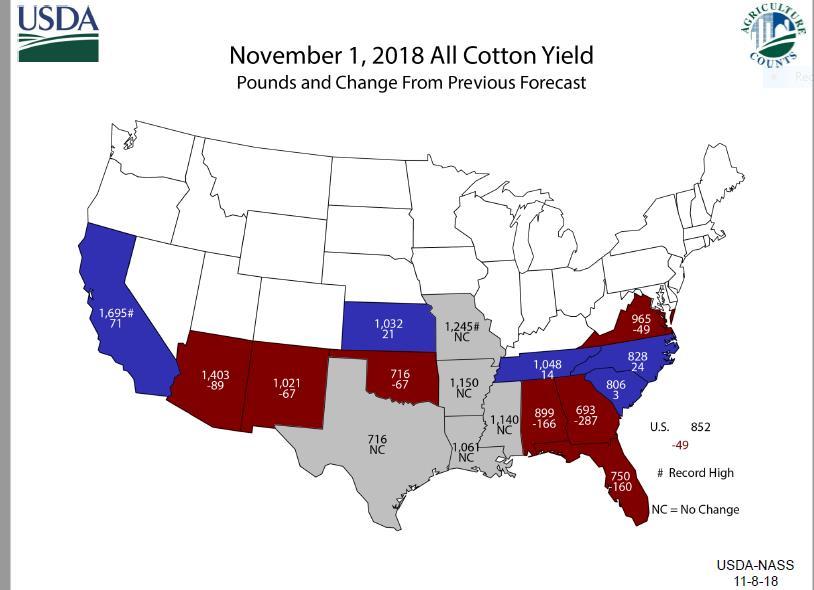
82 Cotton Balance Sheet U.S. Cotton: Supply & Use 2016/ / /19 Planted Acres Harvested Acres % Harvested 94% 88% 74% Yield Beginning Stocks Production Imports Total supply Mill Export Total use Unaccounted Ending Stocks Stocks/Use 15.1% 30.3% 30.3% Ave Farm Price $0.680 $0.686 $0.740

83 Million Acres Ratio of Dec Corn/Dec Cotton Futures, Three Month Average First Quarter, vs. June Cotton Planted Acreage Report 13+ million acres in Ratio Note: Informa has already forecasted 14.6M acres. Accounts for influence of lower soybean plantings
84 Cotton Balance Sheet U.S. Cotton: Supply & Us New Crop New Crop New Crop 2019/ / /20 Planted Acres Harvested Acres % Harvested 90% 90% 90% Yield Beginning Stocks Production Imports Total supply Mill Export Total use Unaccounted Ending Stocks Stocks/Use 23.1% 29.5% 35.8% Ave Farm Price $0.750 $0.700 $0.650

85 March 2019 Cotton Futures

86 December 2019 Cotton Futures

87 Weekly Cotton Futures

88 David Reinbott November 19, 2018
89 Oct-12 Dec-12 Feb-13 Apr-13 Jun-13 Aug-13 Oct-13 Dec-13 Feb-14 Apr-14 Jun-14 Aug-14 Oct-14 Dec-14 Feb-15 Apr-15 Jun-15 Aug-15 Oct-15 Dec-15 Feb-16 Apr-16 Jun-16 Aug-16 Oct-16 Dec-16 Feb-17 Apr-17 Jun-17 Aug-17 Oct-17 Dec-17 Feb-18 Apr-18 Jun-18 Aug-18 Oct-18 3,000 2,500 2,000 1,500 1, ,000-1,500-2,000-2,500-3,000-3,500-4,000-4,500-5,000-5,500 Rice Managed Money (Spec Funds) Net Position Net Position
90 Million Bushels Rice Stocks and Ending Stocks to Use END. STKS Ending Stocks/Use 25% % % % % %
91 2004/ / / / / / / / / / / / / / /19 Million Metric tons World Rice Ending Stocks and Ending Stocks to Use Ending Stocks Ending Stocks to Use 40% 35% 30% 25% 20% 15% 10% 5% 0%
92 Rice Balance Sheet U.S. Rice: Supply & Use 2016/ / /19 Planted Acres Harvested Acres Yield 7,237 7,507 7,522 Beginning Stocks Production Imports Total supply Domestic Export Total use Ending Stocks Stocks/Use 18.5% 13.2% 13.2% Ave Farm Price $ $ $ Ave Farm Price (bushel) $4.68 $5.72 $5.40 Long Grain Price $9.61 $11.50 $10.70 Long Grain Price (bushel) $4.32 $5.18 $4.82 PLC Payment (Bushel) $1.98 $1.13 $1.49
93 Rice Balance Sheet U.S. Rice: Supply & Use New Crop New Crop New Crop 2018/ / / /20 Planted Acres Harvested Acres Yield 7,522 7,550 7,722 7,900 Beginning Stocks Production Imports Total supply Domestic Export Total use Ending Stocks Stocks/Use 13.2% 16.8% 18.8% 20.8% Ave Farm Price $ $ $ $ Ave Farm Price (bushel) $5.40 $5.63 $5.36 $4.95 Long Grain Price $10.70 $ $ $ Long Grain Price (bushel) $4.82 $5.18 $4.77 $4.50 PLC Payment (Bushel) $1.49 $1.13 $1.53 $1.80
94 January 2019 Rice Futures

95 Weekly Rice Futures

96 David Reinbott November 19, 2018
97 Revenue University of Missouri Extension Southeast Missouri Non-Irrigation Crop Budgets 2019 Corn GMO Soybean Roundup Ready 2 Xtend Soybean Liberty Link Cotton Wheat D. C. Soybean L.L. Estimated Yield (Bu/Acre) A Estimated Price ($/Bushel) B $3.90 $8.75 $8.75 $0.712 $5.20 $8.75 Estimated Gross Revenue ($/Acre) $ $ $ $ $ $ Total Variable Cost $ $ $ $ $ $ Total Costs (Excluding Land) $ $ $ $ $ $ Total Cost (Including Land or Rent) $ $ $ $ $ $ Estimated Returns Returns Above Variable Costs $ $ $ $ $ $ Returns Above Mach & Buildings $ $ $ $36.74 $69.73 $88.34 Returns Above Total Costs ($46.99) ($59.79) ($45.37) ($125.26) ($11.27) $7.34 Breakeven Price $4.18 $10.00 $9.70 $0.85 $5.36 $8.58 Breakeven Yield ,
98 Revenue Corn GMO Soybean Roundup Ready 2 Xtend Soybean Liberty Link Cotton Rice Convent. Wheat D. C. Soybean L.L. Estimated Yield (Bu/Acre) A Estimated Price ($/Bushel) B $3.90 $8.75 $8.75 $0.712 $5.35 $5.20 $8.75 Estimated Gross Revenue ($/Acre) $ $ $ $ $ $ $ Total Variable Cost $ $ $ $ $ $ $ Total Costs (Excluding Land) $ $ $ $ $ $ $ Total Cost (Including Land or Rent) $ $ $ $ $ $ $ Estimated Returns University of Missouri Extension Southeast Missouri Irrigation Crop Budgets 2019 Returns Above Variable Costs $ $ $ $ $ $ $ Returns Above Mach & Buildings $ $ $ $ $ $95.73 $25.22 Returns Above Total Costs ($48.25) ($42.89) ($24.35) $22.04 $ $14.73 ($55.78) Breakeven Price $4.12 $9.41 $9.12 $0.70 $4.63 $5.00 $9.87 Breakeven Yield ,

99 David Reinbott November 19, 2018
100 Projected PLC Payment Rate for November 8, 2018 Price Crop Marketing Final Reference Price Payment P -Proj. (bu/ac) Year Payment Price November Rate F- Final Corn Sep. 1-Aug. 31 Sep. 29, 2018 $3.70 $3.36 $0.34 F- Final Soybeans Sep. 1-Aug. 31 Sep. 29, 2018 $8.40 $9.33 $0.00 F- Final Grain Sorghum Sep. 1-Aug. 31 Sep. 29, 2018 $3.95 $3.22 $0.73 F- Final Wheat Jun. 1-May 31 Jun. 29, 2018 $5.50 $4.72 $0.78 F- Final Rice (LG) $/bu Aug. 1-Jul. 31 Oct. 29, 2018 $6.30 $5.18 $1.12 F- Final Peanuts Aug. 1-Jul. 31 Aug. 31, 2018 $ $ $ F- Final Projected PLC Payment Rate for November 8, 2018 Price Crop Marketing Final Reference Price Payment P -Proj. (bu/ac) Year Payment Price November Rate F- Final Corn Sep. 1-Aug. 31 Sept., 2019 $3.70 $3.60 $0.10 P Soybeans Sep. 1-Aug. 31 Sept., 2019 $8.40 $8.60 $0.00 P Grain Sorghum Sep. 1-Aug. 31 Sept., 2019 $3.95 $3.40 $0.55 p Wheat Jun. 1-May 31 August, 2019 $5.50 $5.10 $0.40 P Rice (LG) $/bu Aug. 1-Jul. 31 October, 2019 $6.30 $4.82 $1.48 P Peanuts Aug. 1-Jul. 31 August, 2019 $ $ $ P Seed Cotton Aug. 1-Jul. 31 October, 2019 $ $ $ P
101 Winter Meetings Corn Meeting Dec. 12 Miner Cvt. Ct. Farm Labor Mang. - Dec. 13 Miner CC Soybean Meeting Jan MCC Cotton Meeting Jan 24 Delta Center Rice Meeting Feb 21 Malden Cm. Ct.
 545-3516")
102 Questions? Comments? David Reinbott (573)