Future Opportunities for Beef and Beef Cattle
|
|
|
- Milo Copeland
- 5 years ago
- Views:
Transcription


1 Future Opportunities for Beef and Beef Cattle Andy D. Herring and Gary C. Smith Department of Animal Science III Seminario Internacional del Sector Cárnico Bovino Bucaramanga, de Noviembre, 2015
2 Main Points Addressed Characteristics and trends of U.S. beef industry Import considerations into USA Utilization of coordinated beef production systems concepts Global beef thoughts and trends
3 SOME U.S. BEEF INDUSTRY CHARACTERISTICS


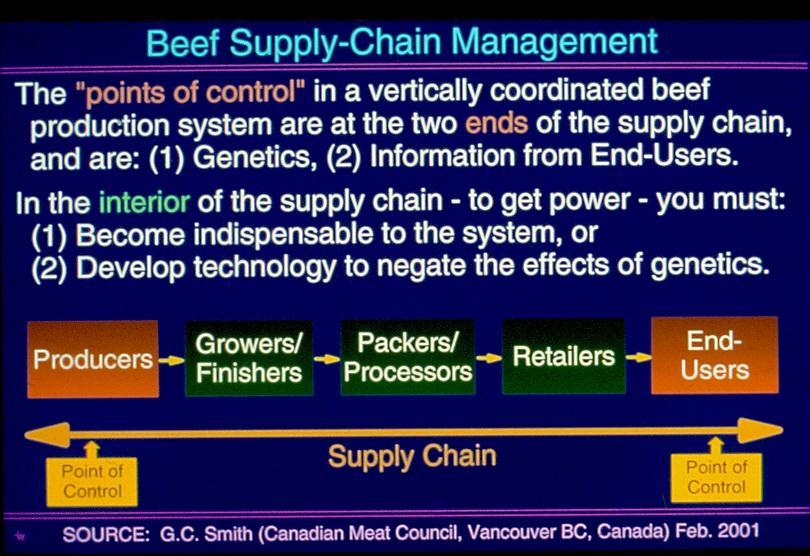
4 Stocker Cow-calf Feedlot Packer Retailer Consumer Traditional supply chain for beef production for North American industries. Animal and product flow represented by solid arrows, information and market signals represented by broken arrows.
5 Stocker Cow-calf Feedlot Packer Retailer Consumer Potential for open information along the supply chain of beef production for North American industries. Animal and product flow represented by solid arrows; traditional information and market signals represented by broken arrows; possible information exchange between sectors represented by dotted lines.
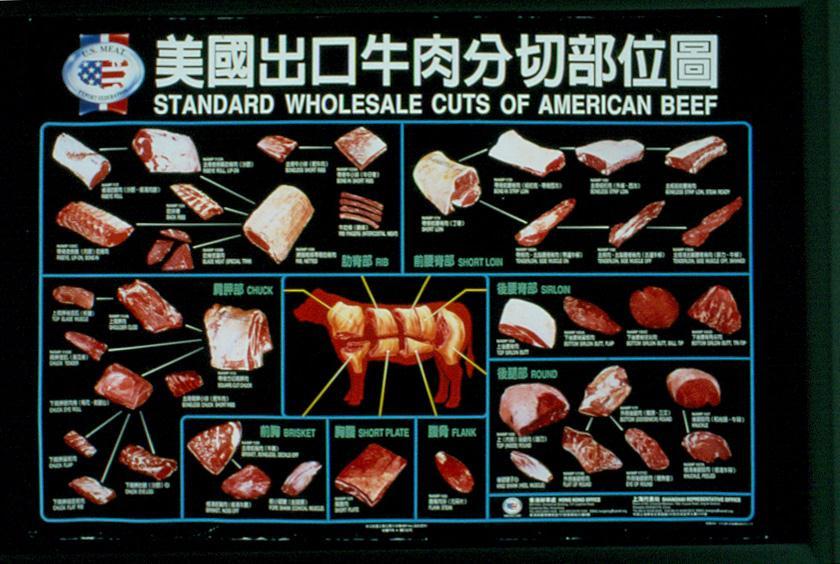
6 U.S. Beef Industry (2013 numbers) 9.2 mil dairy cows Source of 29.3 mil beef cows Ave: 192 Ave: 40 48,000 operations domestic cattle 730,000 operations 2.0 mil calves imported 67% Mexico, 33% Canada Feeder calves 26.3 mil Veal calves mil 10% public 90% private 80% public 20% private 2,100 feedyards > 1,000 head capacity Fed steers and heifers 25.6 mil 5% public 95% private Cull cows (3.2 mil beef, 3.2 mil dairy) and bulls (0.566 mil) 55% public 45% private 98.4% of cattle processed at 147 federally inspected packing plants
7 Million head 140,0 Dairy cows Beef cows Total cattle Beef production 30,0 120,0 100,0 80,0 60,0 40,0 20,0 25,0 20,0 15,0 10,0 5,0 Billion lb 0,0 0,0 U.S. inventory (in millions) for total cattle, and cows from 1931 to In the early part of the 20 th Century milk cows outnumbered beef cows approximately 3:1, but the reverse has been the case since the mid 1970s. Data from USDA National Agricultural Statistics Service (NASS) based on January 1 inventories (89.8 million U.S. cattle in January 2015) and beef production (in billion lb) for calendar year.
8 Opportunities: Beef (USA thoughts) 1. Emphasize systems approaches to supply-chains and to prescriptive production (high-quality, Natural, Organic, Grass- Fed) 2. Seek natural improvement in production, disease prevention and palatability through genetic selection 3. Assure beef is microbiologically and chemically safe 4. Attract the brightest minds of the next generation to careers in the beef industry 5. Increase supply base; rebuild the cow herd
9 Opportunities: Beef (USA thoughts) 6. Counter challenges of consumer activists (use of technology, animal well-being, sustainability, cancer) 7. Demand value-based marketing of feeder cattle 8. Embrace international beef trade (both import and export) 9. Prepare for issues of food security, food defense, bioterrorism and introduction of foreign animal diseases 10.Solve problems of water scarcity, usage and impaired quality
10
11 SOME U.S. BEEF IMPORT CONSIDERATIONS
12 U.S. agencies and regulations pertaining to importation of beef Food Safety Inspection Service (FSIS) - branch of USDA is responsible for assuring that U.S. imported meat, poultry and egg products are safe, wholesome, unadulterated, and properly labeled and packaged. U.S. Food and Drug Administration (FDA) branch of Human and Health Services to keep unapproved chemicals and residues out of U.S. food supply. Animal and Plant Health Inspection Services (APHIS) branch of USDA related to animal diseases that may threaten U.S. food supply and consumers Country of Origin Labelling (COOL) accurate labelling of imported meat products and regulated by the Agricultural Marketing Service of USDA.
13 Checklist for Importing Meat, Poultry and Processed Egg Products into USA 1. Products must originate from certified countries and establishments eligible to export to the United States. 2. The Animal and Plant Health Inspection Services (APHIS) restricts some products from entering the United States because of animal disease conditions in the country of origin. For information on restrictions related to animal diseases and information about APHIS, contact the APHIS Veterinary Services, National Center for Import and Export. 3. Countries and establishments become eligible following an equivalence determination process by FSIS. 4. Imported products must meet the same labeling requirements as domestically-produced products. 5. After filing the necessary forms for U.S. Customs and Border Protection, and meeting animal disease requirements of APHIS, all imported meat, poultry and processed egg products must be presented for inspection by FSIS at an official import establishment. More detailed information can be found on the FSIS web site:
14 Countries in process to access U.S. beef import markets Region Countries Region Countries Asia (2) Japan, Taiwan* North America (2) Canada, Mexico Central America (3) Costa Rica, Honduras, Nicaragua South America (4) Argentina*#, Brazil*, Chile, Uruguay Europe (2) Ireland, Iceland* Oceana (2) Australia, New Zealand *Raw beef eligibility suspended pending equivalence verification; 22 EU countries eligible under APHIS regulations but are ineligible until FSIS equivalence is verified. #Regional availability of processed products. Information from FSIS for November 5, 2015.
15 Sanitary Requirements for U.S. Beef Imports: Obtaining U.S. beef market access is a multi-step process. Countries must first be approved by the Animal and Plant Health Inspection Service (APHIS) based on animal disease status. APHIS assesses the risks of introducing animal diseases as a result of trade. In addition, the Food Safety Inspection Service (FSIS) must certify that foreign food regulatory systems employ equivalent sanitary measures to U.S. standards.
16 Country of Origin Labelling (COOL) Which foods are covered under the COOL law? Muscle cuts of beef (including veal), lamb, pork, goat, and chicken; Ground beef, ground lamb, ground pork, ground goat, and ground chicken There are four country of origin labeling categories depending on where the animal was born, raised and slaughtered: 1. Product of the U.S. - meat from animals born, raised, and slaughtered in the United States or from animals present in the United States on or prior to July 15, Product of the U.S., Country X, Country Y, if applicable - meat from animals born in Country X or (as applicable) Country Y, raised and slaughtered in the United States and were not derived from animals imported for immediate slaughter. 3. Product of Country X, U.S. - meat from animals imported into the United States for immediate slaughter, and 4. Product of Country X - foreign meat imported into the United States.
17 SOME BEEF SUPPLY CHAIN AND PRODUCTION SYSTEMS THOUGHTS
18 Optimal beef production systems Strategic combinations of: (1) animal genetics, (2) production environment resources, (3) management, and (4) target market specifications that evaluate all components of the supply/value chain.


19 A Tale of two production systems: Left: U.S. steer carcass with 0.4 inches of rib fat killed at 18 months old, less than 25% Bos indicus. Right: Bull carcass in Latin America with little fat killed at 30 months old, 100% Bos indicus. Photos: D.B. Griffin and A.D. Herring
20 60,0 50,0 40,0 30,0 20,0 10,0 0,0 60% 50% Prime Upper Choice Low Choice Select Other 40% 30% 20% 10% 0% < >.90 Distribution of U.S. beef carcass quality grades across fat thickness categories (0.10 in increments). Data from 2000 (top graph) and 2011 (bottom graph) U.S. National Beef Quality Audits.
21 The pyramid of genetic potential IVF Think about what the foundation of your breeding program should be The right type(s) of animals first Embryo transfer Genetic tests Ultrasound for composition AI sires with high ACC EPD (considering all traits) Animal & breed choices, known pedigrees, accurate records
22 Some levels of reproduction and survival in cow herds that result in constant breeding herd size Number (or %) of breeding age females cow herd base Rate of breeding cow herd used for next calf crop Calf crop born rate Calf survival rate from birth to weaning Calf crop weaned rate Survival rate from weaning to breeding Rate for female calves kept as replace ments Scenario comments High fertility and survival rates allows for more surplus animals to be produced Adequate fertility, good survival rates Adequate fertility, negligible fetal losses, and good survival rates Marginal fertility, adequate survival rates High calf losses from birth to weaning (20%) and weaning to breeding age (20%) These are some scenarios that allow for maintaining a set, constant number of breeding females. Assumes 50% of calves born are female, and mature cows are removed from herd when found to be not pregnant. Within a scenario, lower levels of performance will result in reduction of the breeding herd size; however, increased performance levels within a scenario allow for potential to increase herd size, and/or to generate more surplus animals.
23 Levels of reproduction/survival in cow herds resulting in different numbers of market animals Number (or %) of breeding age females cow herd base Rate of breeding cow herd used for next calf crop Calf crop born rate Calf survival rate from birth to weaning Calf crop weaned rate Survival rate from weaning to breeding & market Rate for female calves kept as replacem ents Surplus male progeny Surplus female progeny Total surplus progeny These are some scenarios that allow for maintaining a set, constant number of breeding females. Assumes 50% of calves born are female, and mature cows are removed from herd when found to be not pregnant. Within a scenario, lower levels of performance will result in reduction of the breeding herd size; however, increased performance levels within a scenario allow for potential to increase herd size, and/or to generate more surplus animals.
 365-day YWT in Angus bulls has gone from 855 to 1,179 for those born 1974 vs.")
24 Trend in beef carcasses weights Progressive Cattleman Heavier carcasses are the trend; is it sustainable? Sherry Bunting, published 24 July 2015 Increase of 7 lb per year recently; 100 lb increase every 15 to 20 yr. Trend in yearling weight EPD of 7 major U.S. beef breeds Proceedings of 2015 Beef Improvement Federation Meeting (Keuhn & Thallman) 365-day YWT in Angus bulls has gone from 855 to 1,179 for those born 1974 vs. born 2014 (8 lb increase/yr); YWT EPD went from -9 to +92 (increase 2.5 lb/yr).
25 Net return per animal ($) Bottom 20% Average Top 20% $ range $ range $ range $ range Cow-calf Backgrounding Replacements Finishing Figure 13.7 Variation in profit across U.S. beef industry production segments in Average values per animal with the bottom 20%, average, and top 20% profit categories provided within industry components. Production segments/systems here refer to production of calves nursing cows to weaning at 7 months age, short-term feeding and growing of weaned calves, development of heifers for breeding cows, and feeding of cattle to mm of external fat for carcass production. Source: FINBIN (2012) online data base spanning several states in USA. Herring (2014) Beef Cattle Production Systems CABI Publishing
26 Cow herd base and land capacity needs to supply annual production of beef packing plants of various sizes from forage-based finishing systems Plant daily kill capacity Operating days per year Number of cattle harvested per year Cow herd needed to supply Land area needed for cow herd (ac) Land area needed for growing and finishing cattle (ac) Total land needed (ac) Total land area needed (sq mi) ,000 2,600 15, ,600 4,333 65,000 13,000 78, ,000 21, ,000 65, , ,000 43, , , ,000 1, , ,667 3,250, ,000 3,900,000 6, , ,333 6,500,000 1,300,000 7,800,000 12, , ,667 13,000,000 2,600,000 15,600,000 24, ,000 1,300,000 19,500,000 3,900,000 23,400,000 36, ,040,000 1,733,333 26,000,000 5,200,000 31,200,000 48,750 Assumptions: (1) stocking rate of 15 acres per cow annually for cow herd, (2) number of animals annually harvested are 60% of breeding cow herd size [i.e. from 100 cows 40 male and 20 female offspring harvested, etc.], and (3) stocking rate of 5 acres of forage per animal harvested. These estimates do not include land area needed for any potential supplements provided to cow herd or growing and finishing animals.
27 SOME RECENT U.S. MEAT & BEEF TRENDS
28
29
30
 and North American Meat Institute (NAMI).")
31 The Power of Meat - (2015) 10 th annual survey of meat purchase trends. Food Marketing Institute (FMI) and North American Meat Institute (NAMI).
32 USA predicted to account for 20.6% of world s beef imports in Total beef imports: 7.6 million metric tons Top 5 countries* imported 54% Top 10 countries* imported 74% *EU counted as 1 country, 2015 data (FAS-USDA)

33 Currently, 11 countries are eligible to ship fresh or frozen beef to the United States: Australia, Canada, Chile, Costa Rica, Honduras, Iceland, Ireland, Mexico, New Zealand, Nicaragua, and Uruguay.
34 U.S. Beef Trade Ground beef is the number one beef product produced and used in USA. U.S. producers specialize in raising high-valued grain-finished cattle, while beef imports largely consist of lower-value grass-fed lean product that is processed into ground beef. Excess fat trim from grain-finished carcasses is blended with lean beef from older U.S. (non-feedlot) animals and imported, grass-fed beef. Overall, imports accounted for slightly more than 10 percent of beef supplies in Volumes (tonnage) of beef imports and beef exports are usually similar. Many export markets for wide varieties of beef and beef by-products exist.
35
36 SOME GLOBAL BEEF AND CATTLE TRENDS
 Gridded Livestock of the World (GLW), Livestock density page. Available: http://www.fao.org/ag/againfo/resources/en/glw/glw_dens.")
37 Total cattle: 964 million Top 5 countries* had 82% Top 10 countries* had 95% *EU counted as 1 country, 2015 data (FAS-USDA) Figure 1.1 Global distribution and density of cattle. Source: Food and Agriculture Organization of the United Nations (2012) Gridded Livestock of the World (GLW), Livestock density page. Available: Reproduced with permission for Beef Cattle Production Systems.

38 Total carcass beef production: 58.4 million metric tons Top 5 countries* produced 66% Top 10 countries* produced 84% *EU counted as 1 country, 2015 data (FAS-USDA)
 Global ecological zones for FAO forest reporting: 2010 Update")
39 Figure 14.2 Global Ecological Zones of the world. Source: Food and Agriculture Organization of the United Nations (2012) Global ecological zones for FAO forest reporting: 2010 Update available at: Reproduced with permission.
40 Global beef production considerations Efficient and inefficient production scenarios are possible and exist in all areas of the world, and, the same biological considerations apply universally. Critical limitations may occur in some regions, such as marketing infrastructure, political conditions, sanitary regulations, extreme environmental conditions, etc. that threaten all other When there has been increased wealth, there has been increased meat consumption, increased awareness of quality and increased potential for market/product diversification.
41 India Egypt Belarus Ukraine Russia New Zealand EU-27 Japan Brazil Mexico Colombia United States China Canada Korea, South Australia Argentina Uruguay Dairy cows Beef cows Number of cows (in 1,000) Distribution of cow numbers within some regions of the world. Data are from 2012 market year from USDA-FAS. Values reported are in thousands (i.e. India has 129 million dairy cows, etc.).
42 Capital cost Land cost Labor cost Other inputs Other inputs beef enterprise Insurance, taxes Vet and medicine Buildings Fuel, energy, lubricants, Machinery Feed Animal purchases USA Germany Brazil Australia Cost $300 $442 $250 $ US$ Cost of producing 100 kg of carcass weight. Values are in $US from 2010 estimates. These are weighted values relative to the enterprises in the AgriBenchmark database. Source: Deblitz (2012).
43
44
45 Potential to accumulate profit (or debt) through a supply chain Cow-calf Cow-calf Feeder calf backgrounding, stocker calf growing, replacement heifer development Feeder calf backgrounding, stocker calf growing, replacement heifer development Variation within a product is not the same as variation across products. Finishing, advanced heifer development, bull development Carcass traits, cow and/or bull productivity and longevity Finishing, advanced heifer development, bull development Carcass traits, cow and/or bull productivity and longevity End-products properly matched with consumer or customer expectations - consistency Understanding and identification of potential critical control points are very important (HACCP approach to food safety). End-products not properly matched with consumer or customer expectations - inconsistency Multiple Products may be developed at various points along the chain.
46 Concluding Remarks It is inefficient to attempt to use the same type of cattle for all types of markets (or multiple types of cattle for the same market). Many tropical and subtropical areas have potential to utilize forage resources and genetic coordination Bos indicus-bos taurus crossbreeding programs.
47 Concluding Remarks Food safety and quality assurance guidelines and documentation will continue to increase in importance for all beef value chains. There are many positive aspects to promote about the production story and the nutritional aspects of beef. Informed producers, managers, sales people, and consumers allow for more total production efficiency, and, more value-added opportunities.
48 Concluding Remarks World beef (and meat) consumption will continue to increase, and a wider array of beef products, by-products, and value-added opportunities will be desired. Different products (and different types of production) have different selling points for different audiences. Consistency within product is critical.