Waste Discharge Requirements: What does it mean to the grower? Roberta Firoved Manager of Industry Affair January 2014
|
|
|
- Brittany Lindsey
- 5 years ago
- Views:
Transcription


1 Waste Discharge Requirements: What does it mean to the grower? Roberta Firoved Manager of Industry Affair January
2 2
3 3
4 Advancing into the WDR CRC used same successful principles Surface water started with the Rice Pesticides Program and Irrigated Lands Regulatory Program Ground water starts with Ground Water Assessment Report to summarize existing data specific to rice Includes newly developed data from UC Davis through the Rice Research Board Provides the scientific basis for a rice-specific WDR through the conceptual model 4
5 5 Groundwater Assessment
6 Groundwater Assessment Purpose: Develop technical analysis to support long-term monitoring and implementation recommendations Approach Evaluate field and soil environment Assess historic groundwater quality data Evaluate vulnerability 6


, a statutory organization representing about 2,500 rice farmers and handlers, which manages the only commodity")
 Long-Term Irrigated Lands Regulatory Program (LTILRP).")
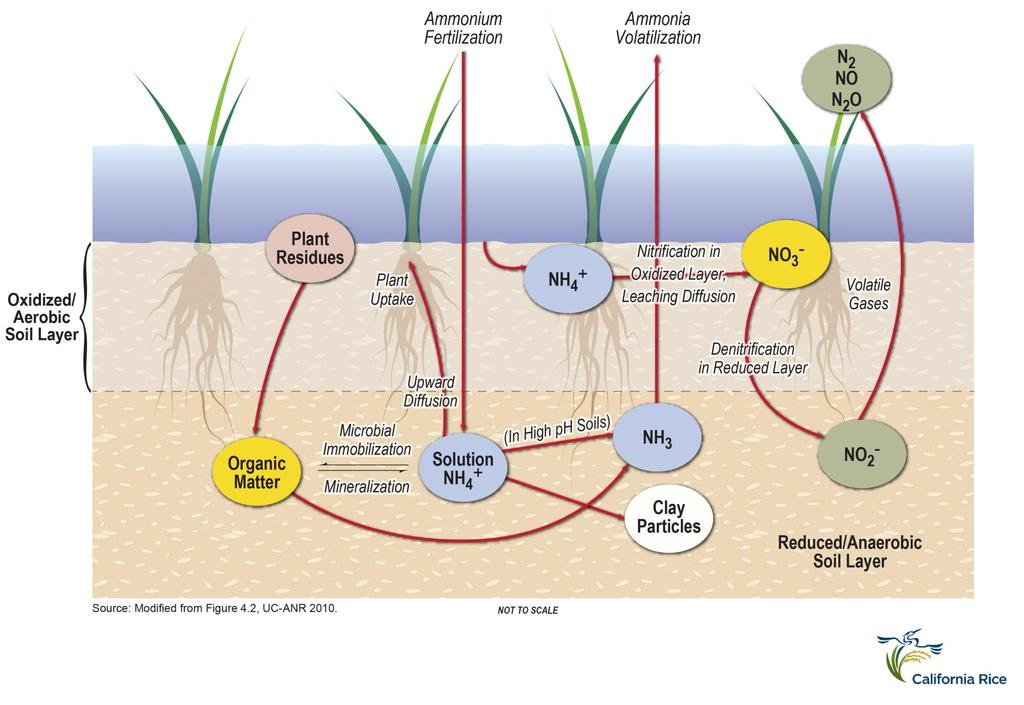
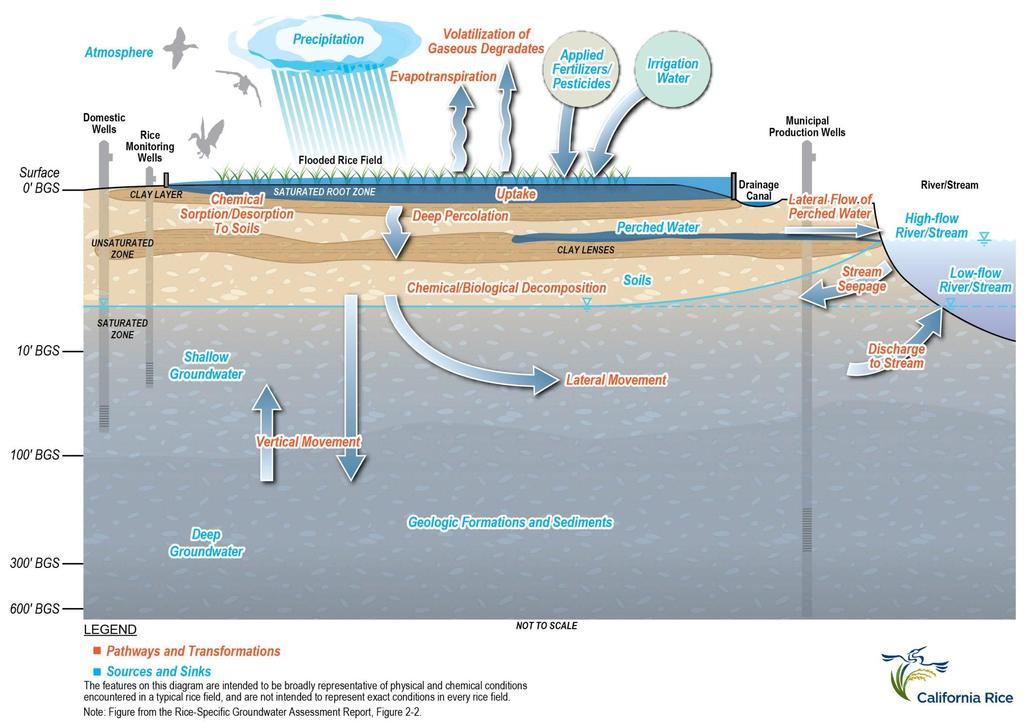
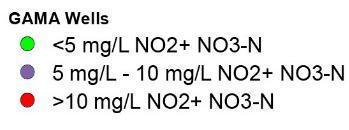
7 Assessment of Nitrate Concentrations in Groundwater Underlying Rice Farming Areas of the Sacramento Valley Lisa Porta, CH2M HILL; Summer Bundy, CH2M HILL; John Dickey, PlanTierra; Peter Lawson, CH2M HILL ABSTRACT Rice is farmed on approximately 500,000 acres in the Sacramento Valley. A rice-specific Conceptual Site Model (CSM) was developed to frame a groundwater assessment report (GAR) to analyze the potential for rice farming to impact local groundwater quality. A rice-specific CSM is valuable in the context of Sacramento Valley groundwater management because rice farming occupies such significant acreage overlying major groundwater basins. The main components of the rice-specific CSM are the physical-chemical conditions and dynamics pertaining to flooded fields and root zones, water and pollutant sources and sinks, and potential transformations and pathways for migration of water and pollutants. The CSM describes characteristics specific to rice farming, including soil types, water management and its influence on soil conditions, and then relates these to underlying groundwater quality. The groundwater quality analysis relied on readily available sources of information regarding root zone geochemistry, and nutrient, pesticides, and general parameter concentrations in the shallow groundwater, and deep groundwater underlying the rice fields. In addition, the fate of applied nitrogen fertilizers, and sources and fate of salinity were evaluated. The assessment was performed on behalf of the California Rice Commission Coalition (CRC), a statutory organization representing about 2,500 rice farmers and handlers, which manages the only commodity specific water quality coalition with representation specifically for rice in the Sacramento Valley. The GRA is required by the Central Valley Regional Water Quality Control Board s (RWQCB) Long-Term Irrigated Lands Regulatory Program (LTILRP). The LTILRP adds groundwater monitoring and reporting requirements to the ongoing surface water monitoring portion of the program. A rice-specific Monitoring and Reporting Plan (MRP) will be developed for the CRC, based on the findings of the GAR. This poster presents the ricespecific CSM and provides an overview of data collected for this effort. A preliminary discussion of results pertaining to nitrate transformation processes in the rice root zone, and nitrate concentrations in the shallow and deep groundwater is also provided. DATA SETS Data from historical and current monitoring networks were reviewed to determine which were applicable to this analysis and to identify significant gaps in monitoring of groundwater quality in the Sacramento Valley s rice-growing region. Well networks were chosen based on the following features: Location of wells in proximity to rice farmland Availability of well construction information Availability of information on sampling depth Range of chemical constituents monitored Peer-review and publication of results The following data sets were reviewed for groundwater quality and nitrate concentrations: USGS Rice Wells, Shallow Domestic Wells, USGS GAMA Wells. NRCS soils survey (texture, hydraulic conductivity, and soil drainage classifications) were also reviewed, as well as results of root zone studies. RICE-SPECIFIC CONCEPTUAL SITE MODEL The CSM is a framework for analyzing data related to subsurface hydrology and pollutant transport. It helps describe and analyze connections of rice fields to the broader environment. The CSM embodies interrelated processes and potential transport pathways. Independent lines of evidence can be developed to assess risk of groundwater quality degradation by rice farming. Figure 1: Conceptual Site Model in Sacramento Valley Rice Fields Ultimately, the CSM can be used as a tool to design targeted monitoring, field research, and adaptive management. SUMMARY OF FINDINGS Figure 4: Maximum Observed NO2+NO3-N Concentrations in the Three USGS Datasets Figure 2: Nitrogen Transformations in Flooded Soils Figure 5: NRCS Soil Drainage Classifications in Rice Growing Areas of the Sacramento Valley Water and nutrient management in rice farming: The flooding of rice fields creates reducing soil conditions that maintain nitrogen in the ammonium (not nitrate) form. Rice-specific conceptual site model: The large, contiguous acreage farmed continuously in rice, combined with the uniqueness of rice farming practices, support a rice-specific approach to groundwater quality management. Rice soils: Sacramento Valley soils on which rice is grown are usually composed of tight clays and have very low vertical hydraulic conductivity, limiting downward movement of applied materials to very low rates, regardless of their concentration in soil pore water. Local hydrogeology: Local geology includes old marine deposits and volcanic rocks, that are sources of naturally occurring salinity and common elements (e.g. Fe, Mn). Shallow groundwater quality: Nitrate was not detected in any USGS Rice Well at a level exceeding the MCL. The quality of this shallow groundwater suggests that there is no evidence of nitrate contamination from the rice lands that are represented by these wells. Most of the USGS Rice Wells had TDS concentrations below 1,000 mg/l (the upper limit SMCL for TDS). NITRATE IN RICE ROOT ZONES Figure 3: Vertical distribution of nitrate-n on eight soil profiles sampled in the spring, pre-flooding. Source: Linquist et al., 2011 Porewater concentrations (about 1.2x those shown for soils) are all below the MCL, and those at the base of the profile are near zero. REFERENCES Linquist, Bruce, Chris van Kessel, Jim Hill, Randall Mutters, Chris Greer, and Luis Espino Improving fertilizer guidelines for California s changing rice climate. (Annual Report to the Rice Research Board). UC-ANR (University of California Agriculture and Natural Resources) Rice Nutrient Management in California. UC-ANR Publication 3516, 136 pp. USGS (U.S. Geological Survey). 2001a. Shallow Ground- Water Quality Beneath Rice Areas in the Sacramento Valley, California, Water-Resources Investigations Report National Water-Quality Assessment Program. USGS (U.S. Geological Survey). 2001b. Ground-Water Quality in the Southeastern Sacramento Valley Aquifer, California, Water-Resources Investigations Report USGS (U.S. Geological Survey) Ground-Water Quality Data in the Middle Sacramento Valley Study Unit, 2006 Results from the California GAMA Program. U.S. Geological Survey Data Series 385, 100 p. ACKNOWLEDGEMENTS We would like to thank: Tim Johnson and Roberta Firoved of the California Rice Commission Tess Dunham of Somach, Simmons and Dunn Joseph Domagalski of the USGS, NAWQA Program Bruce Linquist of UC Cooperative Extension 7

8 Rice Lands Groundwater quality generally high Contiguous blocks of continuous rice Relatively consistent farming practices since about


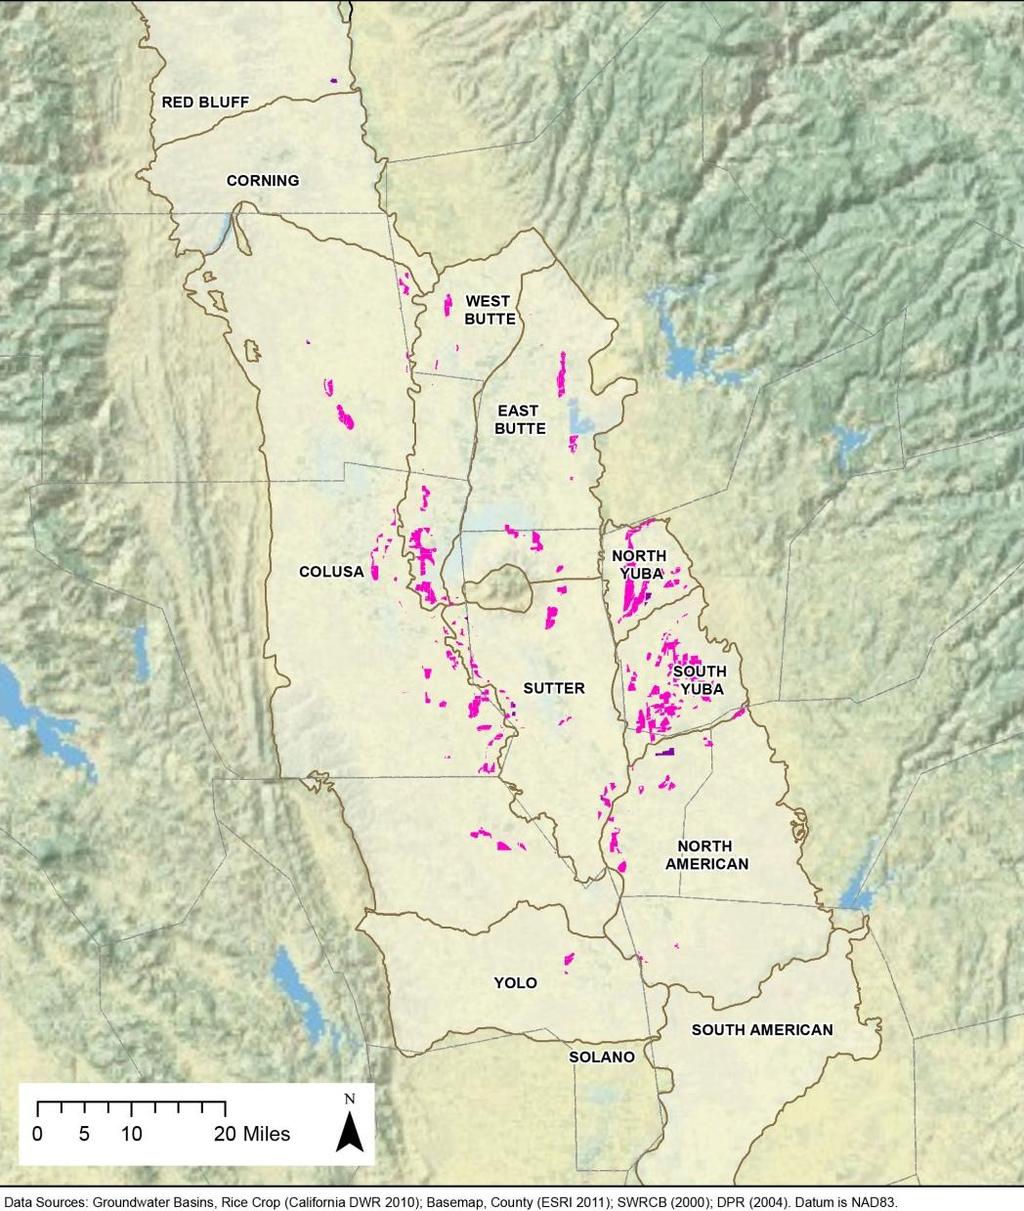

9 SWRCB Initial Vulnerability Areas and DPR Groundwater Protection Areas Rice Within SWRCB Initial Vulnerability Areas and DPR Groundwater Protection Areas 50,000 acres or 10% of total rice acres is grown on initial HVAs and GPAs 9
10 10 10
 2011- Nitrate-N between 5")
 8 7 6 5 4 3 2 1 Nitrate-N")

11 Site number Root-zone Study (UCCE) Nitrate-N between 5 and 6 feet deep in springtime (mg/l) Nitrate-N between 5 and 6 feet deep in springtime (mg/l) Primary MCL 11
12 12 12

13 13 Groundwater Data Quality Analysis
 Salinity (TDS, specific conductance)")
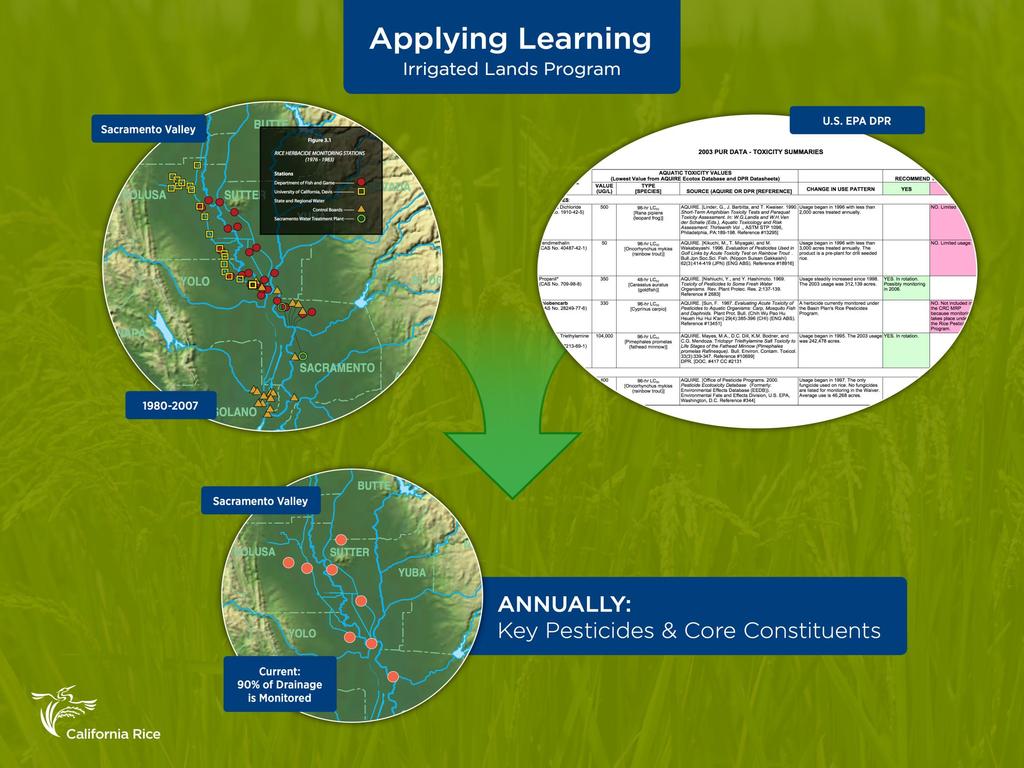
14 Collected & Analyzed Existing Groundwater Quality Data Key Features of Selected Datasets Proximity to rice Range of constituents Range of depths: shallow, medium, and deep groundwater Documented, peerreviewed, or published Crop/Soil Mapping and Analysis Compared Groundwater Quality Results* Nutrients (nitrate, phosphorus, potassium, sulfur, zinc, iron) Salinity (TDS, specific conductance) Pesticides registered for use on rice Metals and non-metals *Compared to drinking water standards and other triggers 14

15 Evaluated Well Networks Shallow and Deep Well Networks Overlying the Initial HVAs and GPAs in Rice Fields USGS Well Networks and Rice Initial HVAs 15


16 Nitrate Results for All Well Networks 16

17 Review of DPR Groundwater Protection Program Review of DPR technical approach DPR Groundwater Database Incorporates statewide pesticide monitoring DPR, CDPH, USGS 17

18 Groundwater Assessment Summary Crop/Soil Mapping and Analysis Rice- Specific Applied Materials Information Water Quality Data Rice-Specific Conceptual Site Model Multiple lines of evidence Low risk Nitrate in USGS Rice Wells below the MCL No confirmed detections of pesticides registered for use on rice Analysis forms basis for Trend Monitoring Program 18


19 Major Rice-Specific WDR Features GW & SW monitoring Farm evaluations & management practices Rice lands Ongoing coordination with DPR Rice-specific N management tool (CRC initiative) 19
20 CRC Due Dates for Reports Report Date Updates Submittal of templates for Farm Evaluation and Nitrogen Management Plan November 30, 2014 As needed Groundwater Trend Monitoring Work Plan October 1, 2014 As needed Farm Evaluation Management Practice Summary July 31, 2015 Every three years Annual Monitoring Report December 31 Annually 20
21 Farm Evaluation Template ID rice acres and crop grown in rotation Location of farm ID and track management practices implemented on farm ID where water leaves property In-service and abandoned wells Acknowledgement by Grower of landowner notification 21
22 Nitrogen Management Plan Template Developed in consultation with others Soil & plant tissue testing Nitrogen application rates Nitrogen application timing Consideration of organic N fertilizer Consideration of irrigation water N levels 22
23 Grower Due Dates for Reports Report Date Update Notification of Landowner As part of Farm Evaluation Initial notification and when change in ownership for rice land Farm Evaluation March 1, 2015 Annually Nitrogen Management Plan Nitrogen Management Plan Summary Report Mitigation Monitoring Report March 1, 2016 If identified within a high vulnerability area triggered by nitrates By October 1st when mitigation measures are implemented Annually Specified in GWQMP Annually 23
24 Three Items for Rice Growers Report Date Update Notification of Landowner As part of Farm Evaluation Initial notification and when change in ownership for rice land Farm Evaluation March 1, 2015 Annually Nitrogen Management Plan March 1, 2016 Annually 24
25 25 Discussion/Questions?