Climate Data Services for Agriculture
|
|
|
- Osborne Barber
- 5 years ago
- Views:
Transcription

1 Climate Data Services for Agriculture The Power of Agricultural Intelligence Michael Ferrari, PhD Senior Climate Scientist & Biophysicist Director, Climate Services for All Contents Copyright 2015, awhere, Inc.


2 Agricultural intelligence business since 1999 Cloud analytics platform for agriculture and global development Using big data to help large & small holder farming operations Long-term customers 2

3 Increased Climate Risk


4 Climate Change is at the Center of Major Societal Challenges Weather Variability Population Growth Food Production
5 The Global Food Challenge By 2050, our population will gain another 2.4 billion people Source: United Nations Dept of Economic and Social Affairs That means, in just 34 growing seasons, the world s 580 million farmers must feed 9.6 billion while facing: Increased Weather Variability rendering traditional practices ineffective Information Gap lack of adequate data across the value chain Lack of Field-Level insight to prevent risk and improve production
6 There is no Debate: Climate is Changing for agriculture this means food insecurity and risk


7 Increased Weather Variability The US Federal Government spends $8-$10 Billion annually on gathering climate and weather data not much of it not commercially available Opportunity exists to access this extensive knowledgebase to improve weather & climate risk projections
8 Why 8

9 Market Opportunity Commercial Application of Climate Informatics Industry shift from reacting to weather/climate to becoming proactive regarding climate informatics decision making. Weather and climate information as a tool for decision making: Energy Prices/Supply Crop Potential & Losses Long Range Drought Assessment Hurricane Frequency and Severity Water Resource Planning Food Security

10 Climate Services Partnership

11


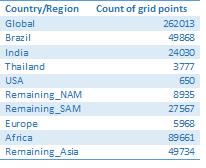
12 Our Data minimum humidity morning wind maximum wind Data Quantity Data every few kilometers 1.6 million surface points 1 million + customer points 5 billion points daily 1.1 trillion points total
13 Weather Agronomics Weather Advanced Weather Agronomic Agro-economic Daily Forecast Short Term Forecast Accumulations Trends Seasonal Comparisons Harvest Planning Pest & Disease Alerts Predicted Yields Agronomic Actions Pre-season planning Market Options Fertility Options Basic Advanced 13

14
15

 Models")


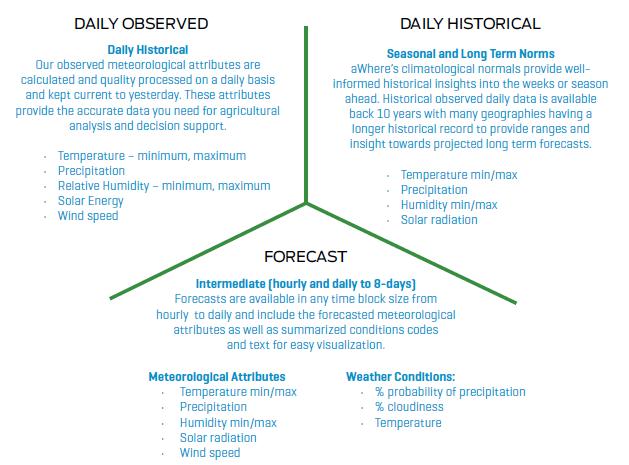
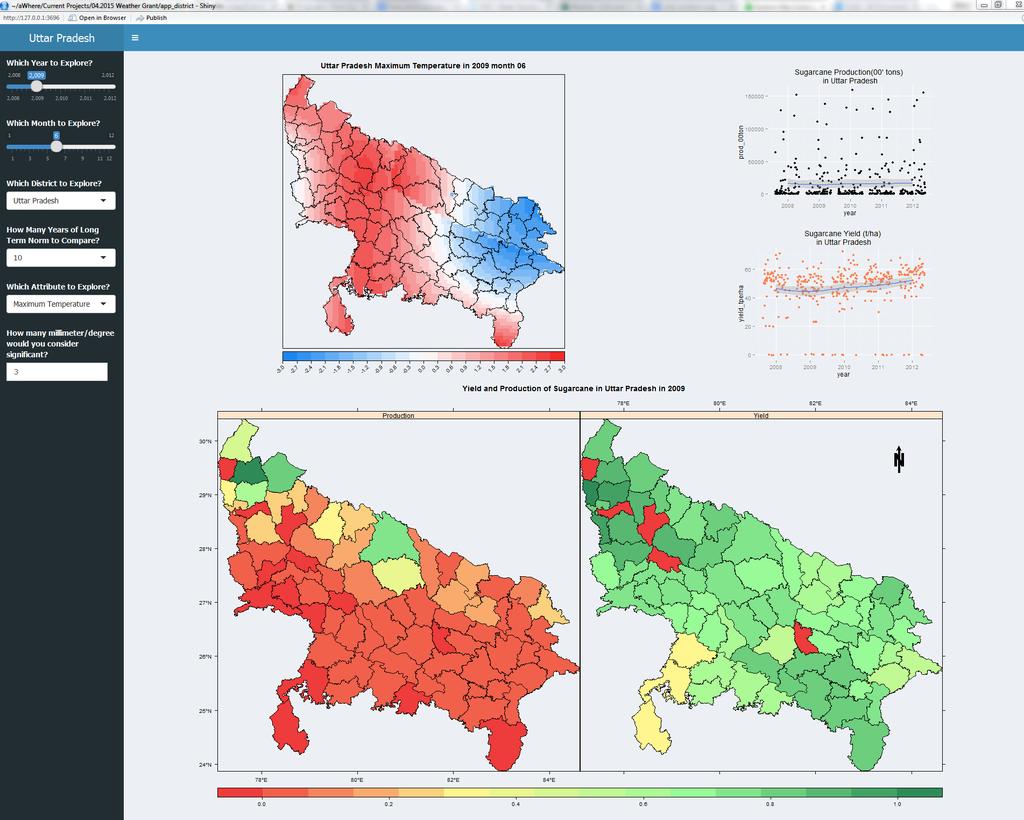
16 WeatherTerrain Global Weather Forecast 8 days of hourly forecast (updated 4x daily) Observed (20 years) Models Precipitation Min/Max Temperature Min/Max Relative Humidity Max/Mean Windspeed Solar Radiation PET GDD Pest and Disease Panchagarh, Bangladesh Embu, Kenya


 Doppler")


")

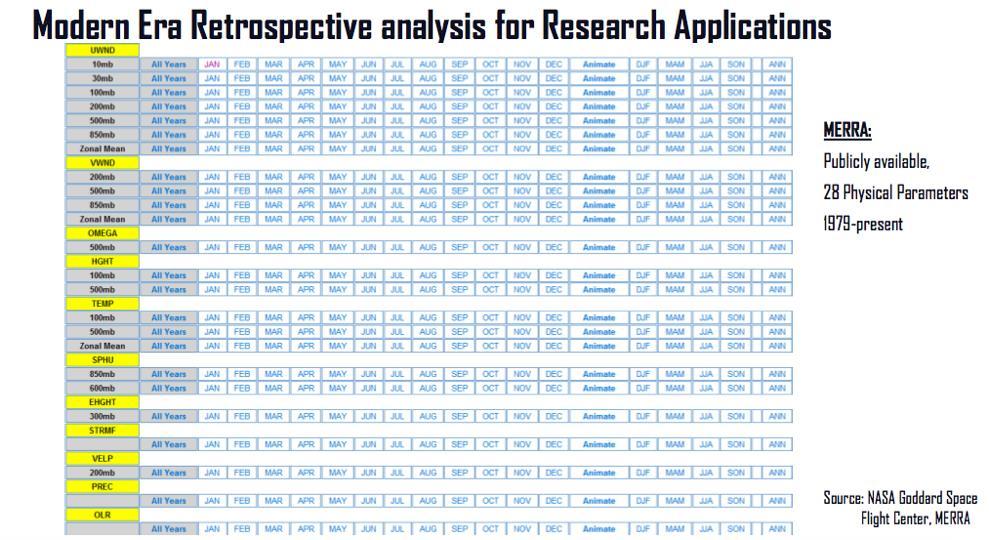
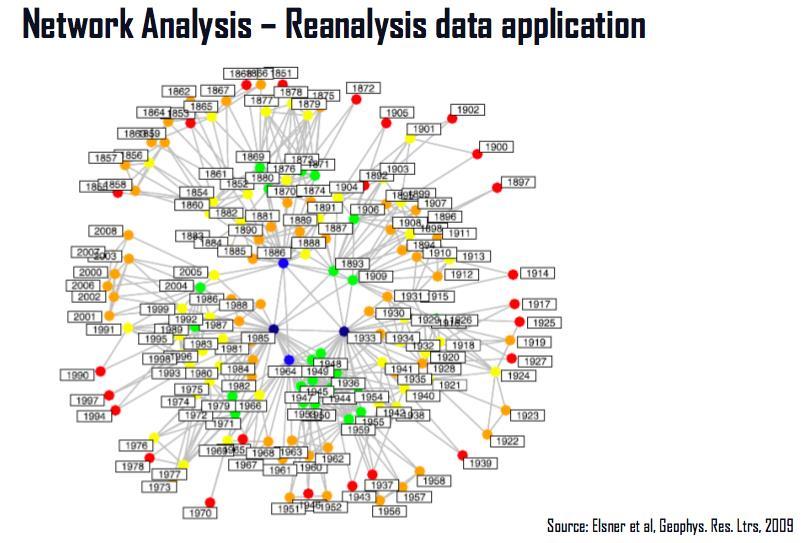
17 Data Sources Weather Station Observations Field Observations Global Forecast Models (GFS) Doppler Ground Radar Spatial Interpolation Models Satellite Observations (TRMM, GPM) Predictions and Recommendations Modeling
18 Modeling Weather and Climate 20 Year Historical Observed 10 Day Forecast Predictive Models 1 to 50 Year Climate Models Historical scenarios Biological and GDD indexes Statistical modeling Multi-variate regression Cross-validation

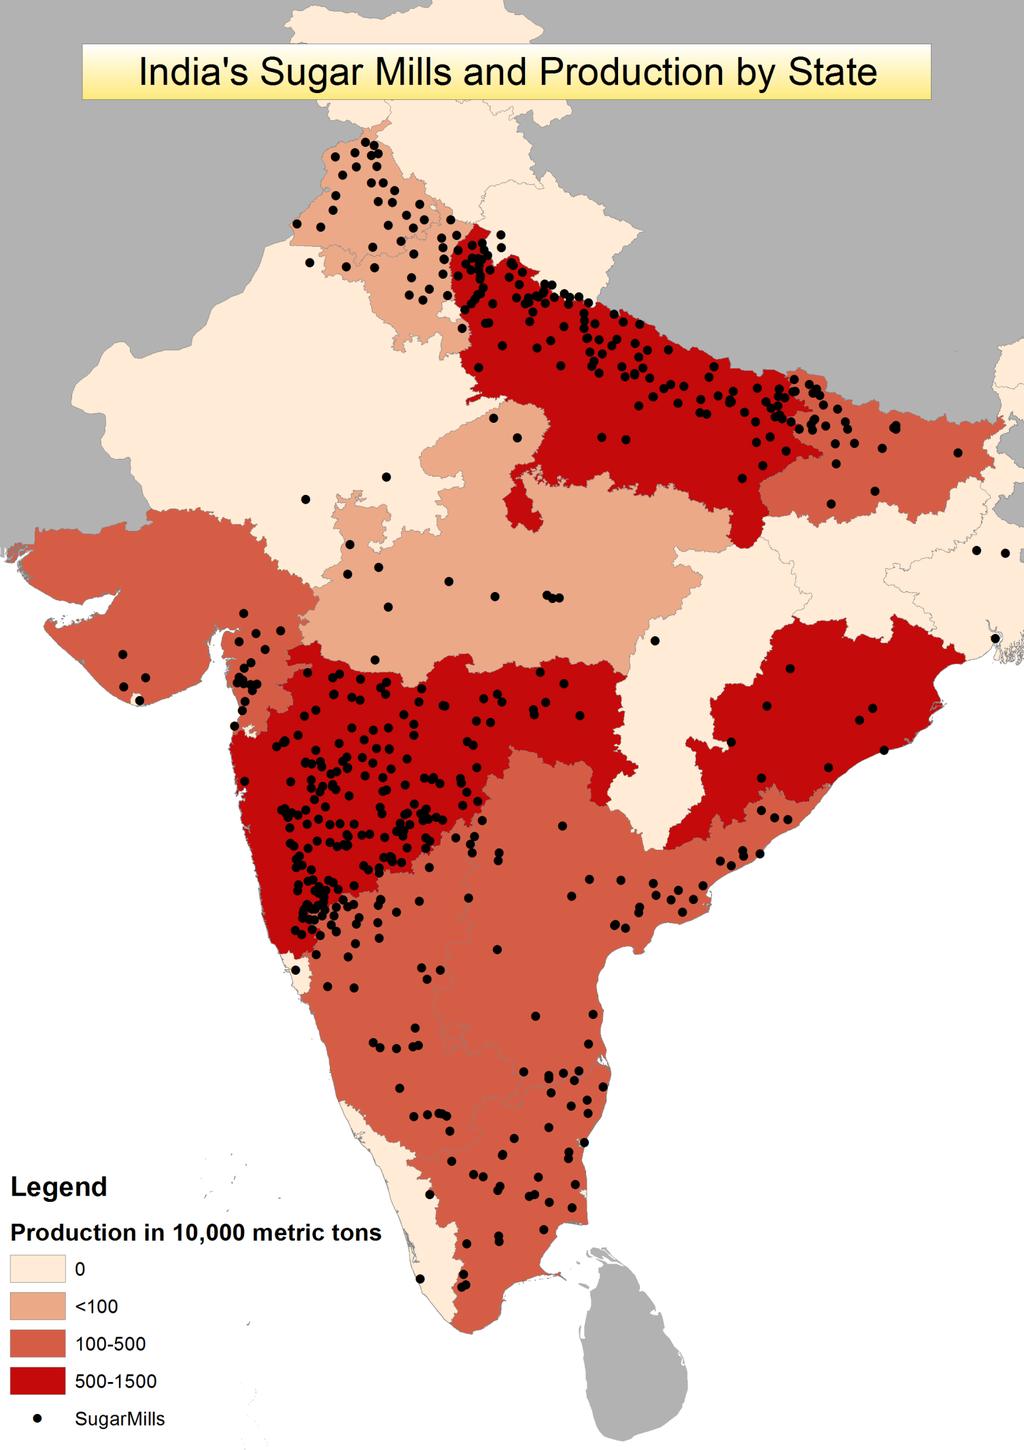
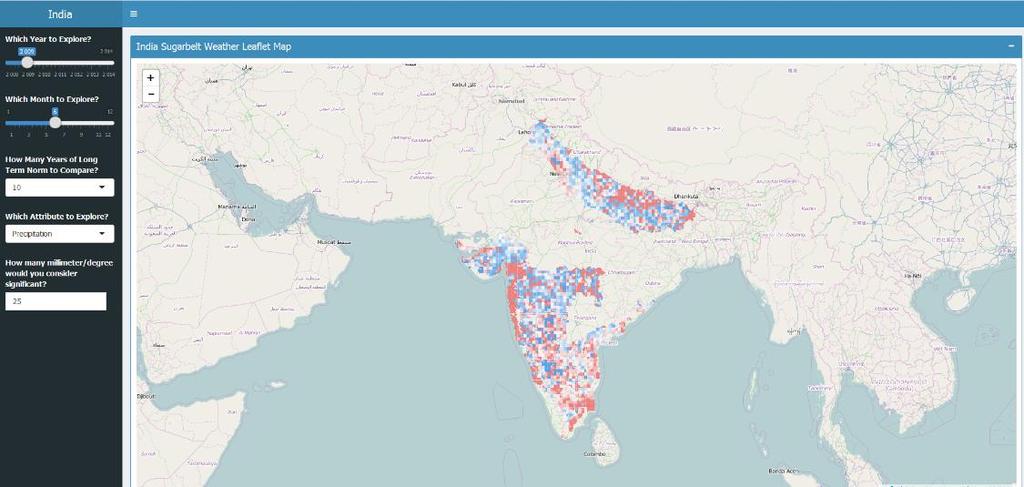
19 Weather Commodity Identify Buckets of target clients Growers Traders (Banks/HF) Commodity Analysts CPG/F&B Growers Agricultural Growing Organizations Commodity Consortiums Financial Services Banks Hedge Funds Proprietary Traders Portfolio Managers Equity Analysts Consumer Goods/Food & Bev Direct Commodity Users Entire Food & Beverage Value Chain Risk Management Origin Commodity Risk Brazil Soybeans Coffee United States Corn West Africa Cocoa India Sugarcane DAILY RISK SCORE Warning China Malaysia/Indonesi a Sugarcane Sugarbeet Palm Oil Watch & Monitor Favorable Conditions

20
 Agri analytics not extremely useful as a predictive tool No Market")
21 Competition Comparison: Speedwell Weather Derivatives Weather/forecast focused Tied to actual weather stations (sugar: 9 BR locations, 14 IN locations) Agri analytics not extremely useful as a predictive tool No Market Intel

22
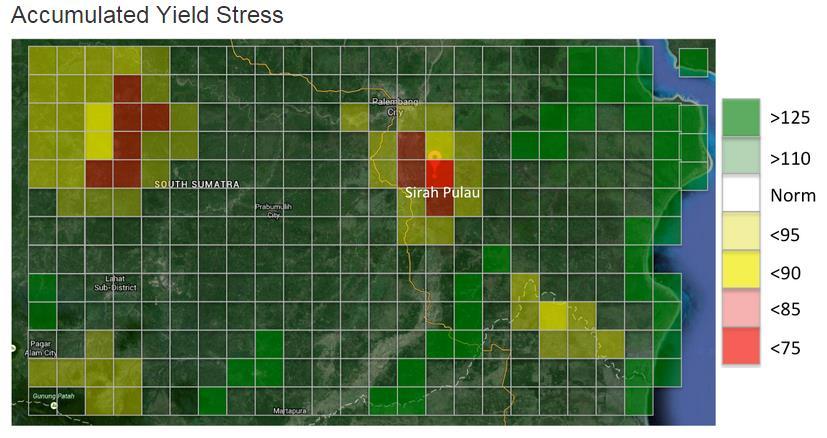
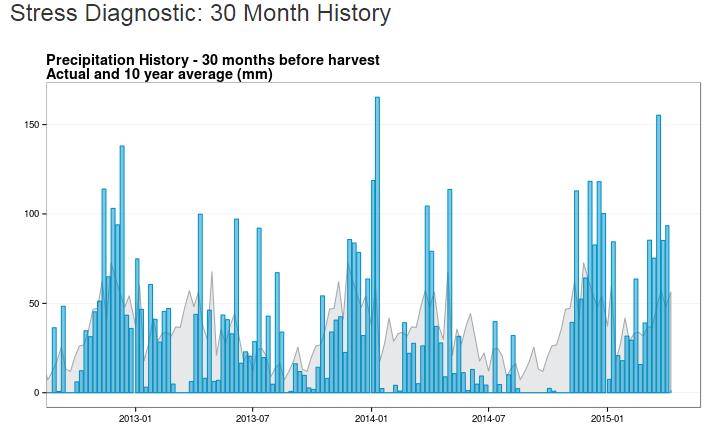
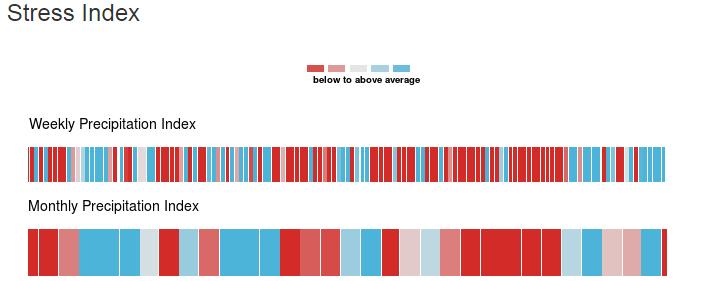
23 Stress Diagnostics Replicate Palm Oil tool for Sugarcane
24 Advanced Risk Analytics

25 Advanced Risk Analytics
26 Advanced Risk Analytics

27 Advanced Risk Analytics

28 Advanced Risk Analytics

29 Commodities 101

30

31 Source: FinViz.com
32

33
34
35
36
37
38 Add title
39
40
41
42
43
44
45
46

47 JJA prcp v.10 yr normal

48 Global Weather Usage

49 Grid Cell Stress Monitor
50 Why 50


51 El Nino signals starting to emerge Source: NOAA
52 El Nino signals starting to emerge Source: Australia Bureau of Meteorology

53 Higher potential for negative crop conditions for BR/IN/AU Source: NOAA

54 JAS Risk Favorable onset period, particularly in south Seasonal dipole eroding Y/Y pattern: drier in both production belts for Jul/Aug Highest risk: Aug 2009 analogs appearing Risk to cane yields Source: JAWF
55 #11 Price Risk Source: ino.com
56 Market Impacts Favorable for Brazil, 2015/16 Monsoon will start favorably, start to drop off JulAug Impacts to India, South China, Australia, Thailand With production cost range, supports a constructive World sugar market through 1Q2016

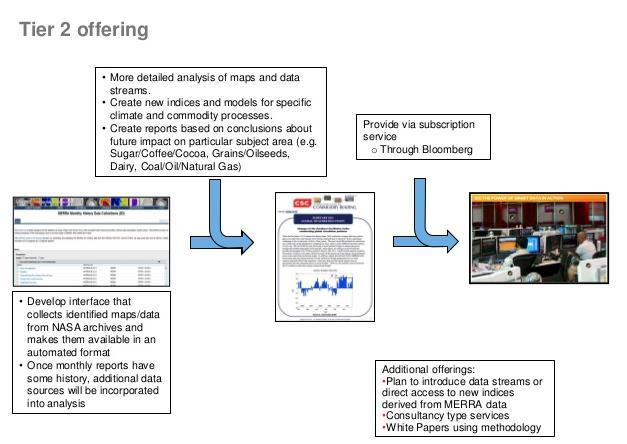
57 awhere will introduce a Bloomberg-Type Offering 1. Landing page will have a brief description of our service, with a fairly straightforward risk visual (we can decide on a generic index that is given away for free. Possibly something around corn. 2. Users will see a global map. From there, they can select or zoom in on their area of interest either via geographic region or commodity. For example, Sao Paulo sugarcane. 3. From here, I envision a tiered offering approach. Tier 1 products will contain a weekly dashboard by commodity, including: Daily/Weekly weather variables (via WxTerrain) 8-day forecast Monthly-seasonal indices Crop Stress Index (by crop, by geography) P/PET (by crop, by geograph) CC disease indices (where appropriate) Flag of 3 sigma events as an early warning system 4. Tier 2 products will be the next-gen products, and will be partly defined by customer & prospect feedback. For now the sole focus will be in Tier Once the AOI is selected, the various indices that we will offer (#3 above) for the particular geography will appear. 6. Market risk signals via probability distribution function will be available. 7. Some market comments (weekly discussion, monthly report, etc) will likely be required to start, at least until revenue starts to be generated.
58
59 Questions?

60 Michael Ferrari, PhD Senior Climate Scientist & Biophysicist Director, Climate Services for