Global Grains R&D Opportunities for Australian Growers. Dr. Siang Hee, Tan Executive Director, CropLife Asia 27 th July 2015 Grand Hyatt, Melbourne
|
|
|
- Gerard Hudson
- 5 years ago
- Views:
Transcription


1 Global Grains R&D Opportunities for Australian Growers Dr. Siang Hee, Tan Executive Director, CropLife Asia 27 th July 2015 Grand Hyatt, Melbourne


2 Agenda Australian Exports and a Growing Market - ASIA Australian Grains Produc;on, Forecast and Exports Canola in Australia a Compara;ve Discussion What s for the Future?
3 Alastair James, Policy Manager AgChem Regulation and Stewardship Minor Use

4 Exports & Asia: Growing Demands MIDDLE CLASS POPULATION IN ASIA BY 2020 ASIA 50% of world s middle class population SOUTH EAST ASIA More than DOUBLE to 400 million CHINA 80 million in million in 2020 Sources: National Australia Bank Limited. Australia-China Trade Report Agribusiness Focus. 22 April, Retrieved from Nielsen. (2014). ASEAN DBS Bank. (2011). Imagining Asia McKinsey. (2013). Mapping China s Middle Class. Retrieved from


. Imagining Asia 2020.")
5 Exports & Asia: Growing Demands A Growing Middle Class suggests Ø Rising disposable income Ø Increasingly urban preferences By 2020, Chinese consumers would have increased spending on food to US$1.48 trillion Asia s growing middle class is stimulating demand for grains, especially wheat-based foods. The increase in demand is a consequence of changes in the tastes and diets of this segment of the Asian economy and marks a boon for wheat exporters such as Australia and the United States. VOA CAKES PIZZA PASTA BREAD Sources: Nielsen. (2014). ASEAN DBS Bank. (2011). Imagining Asia Voice of America. Asia s Middle Class Changes Demand for Wheat Grain Exporter. 31 March, 2015.

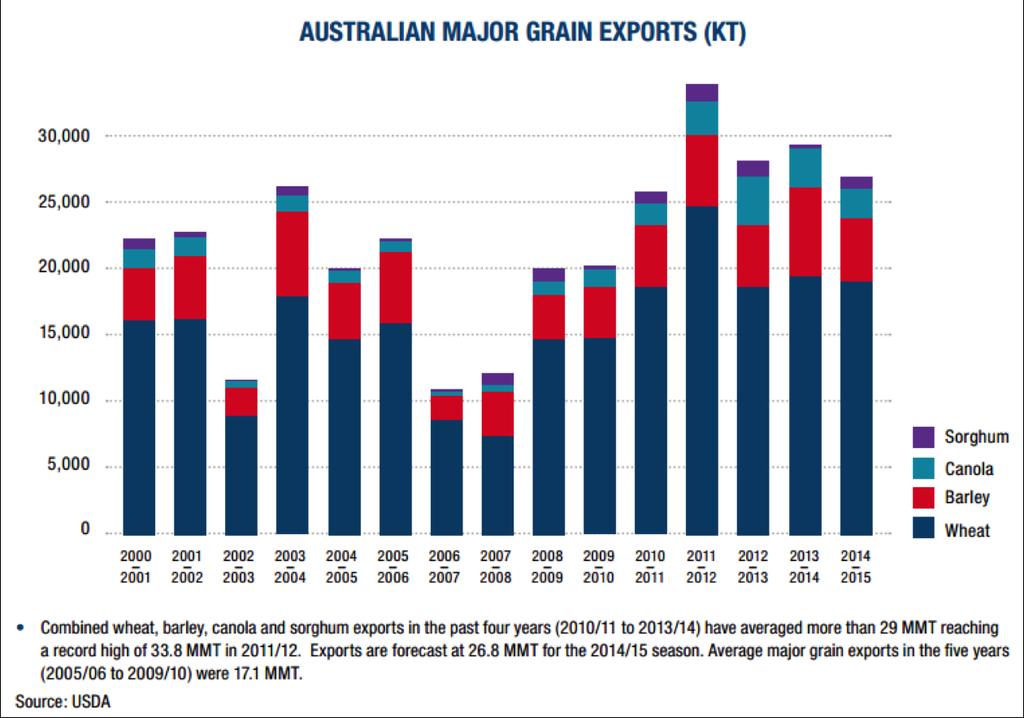
6 Australian Exports Australia s Main Agricultural Exports to Asia Dairy Meat Cereal Horticulture Sources: Australian Farm Institute. Australian Agricultural Trade in the Asian Century. Retrieved from Grain Trade Australia. Annual Report 2013/2014.


.")
7 Growing Trends and Potential Development Beyond 2015? Australia is China s 3 rd largest source of agricultural imports Some notable increases in China grain demands China Barley Consumption grew by x2.5 while Barley Imports increased by x3.15 from 2011 to 2014 China Sorghum Consumption grew by x5.18 while Sorghum Imports increased by x between 2011 to 2015 (from 84,000MT to 9,000,000 MT) Source: United States Department of Agriculture. (2015). Grain: World Markets and Trade. Retrieved from on 2 July, 2015.
8 Ag Value /worker Vs Ag % GDP US$ ,018 1,166 9,674 27,240 36,625 46,045 63,269 66,236 49, % GDP Agriculture $ added/ worker % GDP 1.Agriculture value added per worker is a measure of agricultural productivity. Value added in agriculture measures the output of the agricultural sector 2. Agriculture (% GDP) includes forestry, hunting, and fishing, as well as cultivation of crops and livestock production. Source:
 4500 4000 3500 3000 2500 2000 1500 1000 500 0 Australian Canola Produc;on (1990-2014) 1990 1991 1992 1993 1994 1995 1996 1997 1998 1999 2000 2001 2002")

9 Australian Canola Production and Export Year 2008/ / / / / / / /16(f) Export (to World) ( 000 MT) ( 000 MT) Australian Canola Produc;on ( ) Canola Export by Des9na9on ( 000 MT) 2013/ / / /10 Europe China Pakistan Japan Bangladesh Sources: ABARES, Australian Bureau of Statistics, Australian Oilseed Federation Others

 Clearfield (not trangenic; herbicide tolerant) Conven;onal 0 1986 1990 1994 1998 2002 2006")
10 Canola Yield Comparison Es9mated % of HT and Conven9onal Canola in Canada Canola Yield in Australia, Canada and US Roundup Ready (transgenic; herbicide tolerant) Liberty (transgenic; herbicide tolerant) Clearfield (not trangenic; herbicide tolerant) Conven;onal Canada US Australia Sources: Statistics Canada, Canola Council of Canada, USDA, ABARES, Australian Oilseed Federation

11 If world were to produce 2.5 times of current food, this is how the contributors will be


12 The Potential of Biotechnology Resistance to diseases and pests Higher profitability More nutri;ous plants USES OF BIO-TECH CROPS Beher produc;on effec;veness Resistance to cri;cal climate condi;ons FOOD FORAGE BIOFUEL Resistance to crop protec;on products
13 Yield of selected crops (AUS vs US) Phenotype Pre-1990s Single-cross hybrids with biotech traits US Maize Phenotype 8 Single-cross hybrids Genotype 1990s-2000s MT/HA 6 AUS Maize Phenotype Genotype 4 2 US Barley US Sorghum US Wheat AUS Sorghum AUS Wheat AUS Barley US Canola AUS Canola Today Sources: FAOSTAT, Index Mundi, DuPont Pioneer, USDA, ABARE, Australian Bureau of Statistics
14 Quan;ty (1000 MT) UKRAINE MAIZE MARKET Ukraine Corn Produc9on, Export and Harvest from Year Produc;on Exports Area Harvested Area Harvested (1000 HA) 5 th Largest Producer Source: Index Mundi. (2015).Ukraine Corn Exports by Year [Data file]. Retrieved from Index Mundi. (2015). Ukraine Corn Area Harvested by Year [Data File]. Retrieved from Index Mundi. (2015). Ukraine Corn Production by Year [Data File]. Retrieved from
15
16
17
18
19 Leveraging on Plant Biotech Crops to Enhance Agriculture Competitiveness License to operate under smart regulations (Science and evidencebased regulations) and social responsibility will allow a sustainable approach to food security. GM Insect Resistance technology: improved profits & environment gains. GM Herbicide Tolerant technology: combination of direct benefits (mostly cost reductions) & facilitation of changes in farming systems (no till & use of broad spectrum products) plus major GHG emission gains Combination of additional farm income, improved environment, higher production and greater production security = improved sustainability of global agriculture
20 Thank you.