Basin Electric Power Cooperative CHS Foundation North Dakota Farm Bureau North Dakota Farmers Union
|
|
|
- Shon Melton
- 5 years ago
- Views:
Transcription
1
2 North Dakota Department of Career and Technical Education Mr. Wayne Kutzer, State Director Board Members Mr. Darrel Remington, Chairperson Mr. Jeffrey Lind, Vice Chairperson Ms. Maren Daley Mr. Brian Duchscherer Mr. Robert Geske Mr. William Goetz Dr. Wayne Sanstead Ms. Susan Stibbe Ms. Rita Wilhelmi Belfield Rugby Bismarck Carrington Enderlin Bismarck Bismarck Hunter Stanley The N.D. Farm Management Education Association recognizes the listed organizations for their contribution toward the production and distribution of the N.D. Farm and Ranch Business Management Regional and State Averages for 2007 Basin Electric Power Cooperative CHS Foundation North Dakota Farm Bureau North Dakota Farmers Union Cover photo courtesy of the North Dakota Grain Growers Association.
3 NORTH DAKOTA FARM BUSINESS MANAGEMENT EDUCATION STATE AVERAGES 2007 ANNUAL REPORT The farm business analyses were submitted by the following instructors represented by their cooperating schools. School Instructor Bismarck State College... Mark Holkup Bottineau MSU... Rueben Mayer Carrington High School... Steve Metzger Central Cass School, Casselton... Ron Smithberg Devils Lake Lake Region State College... Jay Olson Loren Severson Ray Sletteland Langdon Lake Region State College... Rodney Armstrong Dickinson... Jerry Tuhy Glen Ullin High School... Donald Hagen Jamestown (JVATC)... Virgil Dagman Minot High School... Tom Hanson ND State College of Science Wahpeton... Keith Torgerson Napoleon High School... Jory Hansen Rugby High School... Allen Graner Williston State College... Beau Anderson This report was made possible by the farm families who cooperated with their farm management instructors in getting the records for 2007 closed out on a timely basis. The farm management instructors cited above generated the Finpack year-end farm analyses. Andrew Swenson, NDSU Extension Service, databased the Finpack analyses of farms and generated the comparative tables for this report. Location of all Farm Business Management Education Programs in North Dakota Bottineau Langdon Williston Minot Rugby Devils Lake Carrington Dickinson Glen Ullin Bismarck Jamestown Casselton Napoleon Wahpeton
4 2007 State Report North Dakota Farm Business Management Education TABLE OF CONTENTS Introduction... 1 Explanatory Notes for the Farm Operators' Reports... 2 Farm Income Statement... 7 Inventory Changes... 9 Depreciation and Other Capital Adjustments Profitability Measures Liquidity Measures Balance Sheet at Cost Values Statement of Cash Flows Financial Standards Measures Crop Production and Marketing Summary Household and Personal Expenses Operator and Labor Information Nonfarm Summary Financial Summary (sorted by gross farm income) Financial Summary (sorted by age of operator) Financial Summary (sorted by farm type) Explanatory Notes for Crop Tables Barley on Owned Land Barley on Cash Rent Barley on Share Rent Beans, Pinto on Owned Land Beans, Pinto on Cash Rent Canola on Owned Land Canola on Cash Rent Canola on Share Rent Corn on Owned Land Corn on Cash Rent Corn on Share Rent Corn Silage on Owned Land Corn Silage on Cash Rent CRP on Owned Land Fallow on Owned Land Flax on Owned Land Flax on Cash Rent Flax on Share Rent Hay, Alfalfa on Owned Land Hay, Alfalfa on Cash Rent Hay, Grass on Owned Land Hay, Grass on Cash Rent Hay, Mixed Alfalfa/Grass on Owned Hay, Mixed Alfalfa/Grass on Cash Rent Hay, Small Grain on Owned Land Hay, Small Grain on Cash Rent Lentils on Cash Rent...50 Oats on Owned Land Oats on Cash Rent Pasture on Owned Land Pasture on Cash Rent... 54
5 Peas, Field on Owned Land Peas, Field on Cash Rent Prevented planting on Owned Land Prevented planting on Cash Rent Safflower on Cash Rent...59 Soybeans on Owned Land Soybeans on Cash Rent Soybeans on Share Rent Sugar Beets on Owned Land Sugar Beets on Cash Rent Sunflowers on Owned Land Sunflowers on Cash Rent Sunflowers on Share Rent Sunflowers, Confectionary on Owned Land...68 Sunflowers, Confectionary on Cash Rent Wheat, Durum on Owned Land Wheat, Durum on Cash Rent Wheat, Spring on Owned Land Wheat, Spring on Cash Rent Wheat, Spring on Share Rent Wheat, Winter on Owned Land Wheat, Winter on Cash Rent Explanatory Notes for Livestock Tables Beef Cow-Calf Average Per Cwt. Produced Beef Cow-Calf Average Per Cow Beef Cow-Calf (shares) Average Per Cwt. Produced Beef Cow-Calf (shares) Average Per Cow Beef Replacement Heifers Average Per Head Beef, Background Beef Average Per Cwt. Produced Beef, Background Beef Average Per Head Dairy Average Per Cwt. Of Milk Dairy Average Per Cow Figure 1. Gross Cash Income per Farm Figure 2. Net Farm Income (Accrual) per Farm Figure 3. Financial Efficiency Measures Figure 4. Profitability Measures per Farm Figure 5. Assets and Liabilities per Farm, Figure 6. Total Farm Assets and Liabilities Figure 7. Household and Personal Expenses Figure 8. Crop Acreage per Farm Figure 9. Spring Wheat Costs per Acre Figure 10. Average Net Return per Beef Cow... 91
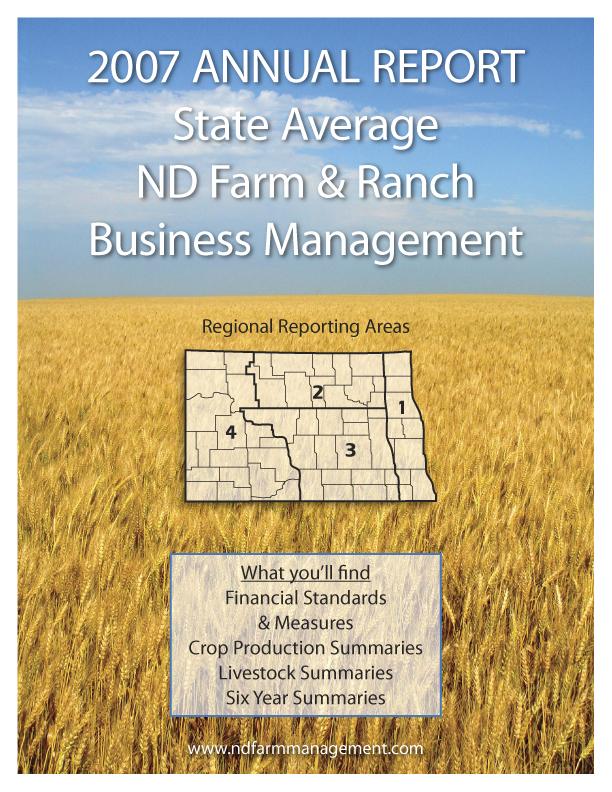
6 INTRODUCTION This report summarizes the individual farm records of the specific region or the whole state as identified on the acknowledgement page. The current financial status of farm operators and net returns from each crop and livestock enterprise is reported. In addition to the average of all farms, the averages for the high, middle, and low-income groups are also presented. All participating farm/ranch families are provided a copy of the regional averages report. They can compare their own Finan business analysis to the regional and/or state averages report and study the areas that may need management improvement. A review of the comparative information may reveal how certain aspects of the business or enterprises excel and help answer why they are profitable. The regional and state averages reports are divided into three major sections; farm operators reports, crop reports and livestock reports. Explanatory notes precede each section. The first section contains 15 tables with whole farm financial and operator information. The last three tables of this section are financial summaries in which farms are categorized by gross revenue, age of operator and farm type, respectively. The second section provides performance information on crop enterprises. The third section provides performance results on livestock enterprises. Lastly, figures 1 through 10 provide trend information for various measures of finance and/or production. The 2007 summary reports are based upon data generated by the Finan individual farm analysis completed by farm/ranch families enrolled in the statewide Adult Farm and Ranch Business Management Education program in North Dakota. Instructors pooled the individual business analysis and submitted the combined school data to the FINPACK Center located at North Dakota State University. The FINPACK Center did provide schools with local averages in order to assist instructors with obtaining relevant local management trends. Farm/ranch families enrolled in the statewide program are encouraged to request assistance from their instructors to determine short-term cash flow and long-term projections. Each instructor has access to FINPACK computer programs, which can be used to generate annual or multi-year (cash flow) farm plans and/or long term alternative projections. This is the nineteenth year that the regional averages have been generated in North Dakota based upon the four regions shown in the state map on the cover of this publication. A regional report has been generated and published for Regions 2, 3 and 4 identified on the North Dakota map. Most farms in Region 1 are located within the Red River Valley. Those farms are contained in a combined Minnesota- North Dakota Red River Valley regional report. The state averages report includes all farms participating in the that were represented in the regional averages and also those farms which were processed and submitted after the March deadline date. All of these reports may be ordered from Farm Business Management, P.O. Box 6022, Bismarck, ND, for $5 per copy. 1
7 EXPLANATORY NOTES FOR THE FARM OPERATORS' REPORTS The tables include the same number of farms, which were all of the farms whose records were judged to be of sufficient quality to be included in the overall report. However, the balance sheet includes only sole proprietors. Partnerships and corporations are excluded because some debt is held outside of the business causing potential misinterpretations of the financial statement. The number of farms included in each of the crop tables varies because all farms do not have the same enterprises. Also, some farmers' records were complete enough to be included in the whole-farm tables, but at times, these same farmers' crop records were not complete enough to include in the respective crop tables. Rounding of individual items for the report may have caused minor discrepancies with the printed totals which are calculated before rounding. Farm Income Statement This statement is a summary of income, expenses, or resultant profit or loss from farming operations during the calendar year. The first section of the table lists cash farm income from all sources. Cash crop sales are listed first followed by cash sales of livestock and livestock products. The Direct & CC govt payments" are government payments decoupled from crop production but the counter-cyclical payment is coupled to national average prices. "LDP payments" are loan deficiency payments that may be received on production when local prices are below the county loan rate for the crop. Other government payments refers to all other government payments such as disaster payments but not including CRP payments. The second section of the income statement lists cash expenses. "Labor" includes only labor hired. "Interest" includes only interest actually paid. No opportunity charges on farm equity capital or unpaid labor are included. The difference between "Gross Cash Farm Income" and "Total Cash Expenses" is the "Net Cash Farm Income." This is net farm income on a cash basis. The last two sections of the income statement deal with the non-cash changes in the farm business. The "Inventory Changes" and "Depreciation and Other Capital Adjustments" sections are used to convert the cash income statement (Net Cash Farm Income) derived from the first two sections into an accrual income statement. The bottom line, labeled "Net farm Income," represents the return to the operator's and family's unpaid labor, management, and equity capital (net worth). In other words, it represents the return to all of the resources that are owned by the farm family and hence, not purchased or paid a wage. However, it does not include any debt forgiveness or asset repossessions. Inventory Changes This is the detailed statement of inventory changes that is summarized in the income statement. It includes beginning and ending inventories and the calculated changes. Depreciation and Other Capital Adjustments This is the detailed statement of depreciation and other capital adjustments that is summarized in the income statement. It includes beginning and ending inventories, sales, purchases, and depreciation. 2
8 Profitability Measures The table shows profitability when capital assets are valued at cost. Various measures of performance are calculated for the farms in this report. In the previous tables no opportunity costs are used. In this, opportunity costs for labor, capital, and management are used. The measures and their components are described below. "Labor and management earnings" equals "Net farm income" minus an opportunity interest cost of 6% on average farm net worth. "Rate of return on assets" is the "Return on farm assets" divided by "Average farm assets." "Rate of return on equity "is the "Return of farm equity" divided by "Average farm equity." "Operating profit margin" is the "Return on farm assets" divided by "Value of farm production." "Asset turnover rate" is the "Value of farm production" divided by "Average farm assets." "Interest on farm net worth" is the "Average farm equity" multiplied by a 6% opportunity interest cost charge. "Farm interest expense" is the accrual interest cost, usually it will be different from the cash interest expense. "Value of operator's labor and management" is an opportunity cost for unpaid operator's labor and management that is used in the calculation of several financial performance measures. A value of $18,000 per full time operator plus 5% of value of farm production. "Return of farm assets" is calculated by adding "Farm interest expense" to "Net farm income" and then subtracting the "Value of operator's labor and management." "Average farm assets" is the average of beginning and ending total farm assets. "Return on farm equity" is calculated by subtracting the "Value of operator's labor and management" from "Net farm income." "Average farm equity" is the average of beginning and ending farm net worth. "Value of farm production" is gross cash farm income minus purchased feed and feeder livestock and adjusted for inventory changes in crops, market livestock, accounts receivable and breeding livestock. Liquidity Measures Liquidity (Cash Basis) "Family living and taxes" is calculated cash family living plus income and social security taxes. "Cash available for intermediate debt" on the cash basis is the sum of "Net cash farm income" and "Net nonfarm income" minus "Family living and taxes" and "Real estate principal payments." "Average intermediate debt" is the average of beginning and ending intermediate farm liabilities. "Years to turn over debt" is "Average intermediate debt" divided by "Cash available for intermediate 3
9 debt." If the cash-based or accrual-based "Cash available for intermediate debt" is a negative number, debt repayment is not possible because of negative cash flow on a cash or accrual basis, respectively, and "Years to turn over intermediate debt" cannot be calculated. Cash "Expense as a percent of income" is "Total cash expense" divided by "Gross cash farm income." "Interest as a percent of income" is "Interest paid" divided by "Gross cash farm income" Liquidity (Accrual Basis) "Available for intermediate debt" on the accrual basis is "Net accrual operating income" plus "Net nonfarm income" minus "Family living and taxes" and "Real estate principal payments." Accrual "Expense as a percent of income" is "Total cash expense" adjusted by inventory changes in accounts payable, accrued expense items, prepaid expenses and growing crops divided by "Gross farm income." "Gross farm revenue" is "Gross cash farm income" adjusted by changes in inventories of crops and feed, feeder livestock and accounts receivable. "Interest as a percent of income" is "Interest paid" adjusted by changes in accrued interest for the year, divided by "Gross farm revenue." Balance Sheet at Cost Values The ending balance sheet statements and solvency measures are presented for sole proprietors only. Current assets are valued at market price at the time of the inventory which is December 31. In balance sheet at cost values, intermediate and long-term assets that are depreciable are valued at cost remaining (amount remaining to be depreciated, plus salvage value). Raised breeding livestock is valued at conservative market replacement costs. Land is valued at cost or conservative market value. Statement of Cash Flows This statement organizes cash inflows and outflows by the following three categories: Operating activities, investing activities, and financing activities. Financial Standards Measures This table contains the 16 measures of financial performance recommended by the Farm Financial Standards Task Force (FFSTF). The Finpack financial management program used by the North Dakota Farm Business Education complies with nearly all of with the FFSTF recommendations for calculating the financial guidelines measures. The measures are calculated on an accrual basis. Liquidity "Current ratio" is "Total current farm assets" divided by "Total current farm liabilities." "Working capital" is "Total current farm assets" less "Total current farm liabilities." Solvency "Farm debt to asset ratio" is "Total farm liabilities" divided by "Total farm assets." "Farm equity to asset ratio" is "Total farm assets" minus "Total farm liabilities," divided by "Total farm assets." 4
10 "Farm debt to equity ratio" is "Total farm liabilities," divided by the result of "Total farm assets" minus "Total farm liabilities." Profitability "Rate of return on farm assets" is "Net farm income" plus "interest expense" minus "Value of operator's labor and management," divided by the average of beginning and ending "Total farm assets." "Rate of return on farm equity" is "Net farm income" minus "Value of operator's labor and management," divided by the average of beginning and ending farm net worth. "Operating profit margin" is "Net farm income" plus "interest expense" minus "Value of operator's labor and management," divided by "Value of farm production." Repayment Capacity "Term debt coverage ratio" is "Net farm income" plus "depreciation and other capital adjustments" plus "Net nonfarm income" plus scheduled interest on term debt minus "Family living and taxes," divided by scheduled term debt principal and interest payments. "Capital replacement margin" is "Net farm income" plus "Depreciation and other capital adjustments" plus "Net nonfarm income" minus "Family living and taxes" and scheduled term debt principal payments. Efficiency "Asset turnover rate" is "Value of farm production" divided by the average of beginning and ending "Total farm assets." "Operating expense ratio" is total expense less "Farm interest expense" and "Depreciation and capital adjustment," divided by "Gross farm revenue." "Depreciation expense ratio" is "Depreciation and capital adjustments" divided by "Gross farm revenue." "Interest expense ratio" is "Farm interest expense" divided by "Gross farm revenue" "Net farm income ratio" is "Net farm income" divided by "Gross farm revenue." Crop Production and Marketing Summary This table contains three sections. The first section reports average acreage by land use. The next two sections show average price received and average yields for major crops. These tables are sorted on the basis of "Net farm income." Household and Personal Expenses For those farms that keep records, the household and personal expenses are summarized. The farms are grouped in the same ranking as in the Income Statement. Since not all farms keep these records, the number of farms in the low profit and high profit groups may be different. Averages are determined by the number of farms keeping these records. The Statement of Cash Flows presents calculated family living and includes all farms. Income tax paid is also shown in the Statement of Cash Flows and includes all farms. 5
11 Operator and Labor Information This table reports the average for the number of operators per farm, the operator's age, and the number of years farming. Nonfarm Summary This table reports nonfarm income. The figures reported are the average over all farms not just those reporting nonfarm incomes. 6
12 Farm Income Statement (Farms Sorted By Net Farm Income) Number of farms Cash Farm Income Barley 25,877 4,754 14,521 62,730 Beans, Black Turtle Beans, Garbonzo Beans, Navy ,200 Beans, Pinto 12, ,310 47,013 Canola 13,971 3,127 8,202 23,088 Corn 46,411 18,520 38,417 91,770 Flax 3, ,370 9,197 Hay, Alfalfa ,036 Hay, Grass Hay, Mixed Hay, Mixed Alfalfa/Grass Lentils ,415 Mustard Seed Oats Peas Seed ,535 Peas, Field 5,310 1,199 2,306 12,470 Safflower ,479 Soybeans 59,171 11,151 50, ,282 Straw , Sugar Beets 21,335 2,910 20,117 38,697 Sunflowers 17,558 1,617 16,482 45,582 Sunflowers, Confectionary 3,556-3,314 10,567 Wheat, Durum 9,938 2,662 4,593 23,948 Wheat, Spring 92,513 11,689 81, ,841 Wheat, Winter 8,228 1,891 6,715 21,294 Wheat, Hard White Rented Out ,454 Barley, Seed ,134 Wheat, Seed Other crops Miscellaneous crop income Beef Bulls 1,081 1,085 2,479 - Beef Cow-Calf, Beef Calves 13,033 16,418 13,761 7,078 Beef Replacement Heifers 1,612 4,328 1,659 7 Beef, Custom Fed ,012 - Beef, Background Beef 23,051 31,739 17,045 9,699 Beef, Finish Beef Calves 7,697 1,100 8,581 25,883 Beef, Finish Yrlg Steers Beef, Grazing Beef ,577 Dairy, Milk 4, ,281 1,630 Dairy, Dairy Calves Dairy Replacement Heifers Dairy Steer Finishing Hogs, Farrow-Fin, Raised Hogs Hogs, Feeder Pigs, Feeder Pigs Hogs, Finish Feeder Pigs 958 2,363 1,606 - Sheep, Feeder Lambs, Fdr Lambs Sheep, Lamb Finishing Sheep, Market Lambs, Mkt Lambs Beef, Finish Cull Cows Bison, Bison Cows, Bison Calves Beef Cow-Calf (shares), Beef Calv ,072 Cull breeding livestock 5,100 6,742 5,600 1,519 Misc. livestock income LDP payments Direct & CC govt payments 17,109 4,238 14,710 35,008 CRP payments 1,917 1,717 1,672 1,819 Other government payments 4,462 1,992 3,920 7,546 Custom work income 8,656 2,615 13,137 13,002 Patronage dividends, cash 2, ,042 5,426 Insurance income 24,067 6,453 23,984 45,908 Cash from hedging accts Other farm income 9,102 4,212 10,052 13,015 Gross Cash Farm Income 457, , , ,098 7
13 Farm Income Statement (Continued) (Farms Sorted By Net Farm Income) Number of farms Cash Farm Expense Seed 34,198 7,247 28,939 76,064 Fertilizer 56,657 10,389 45, ,446 Crop chemicals 37,097 5,941 27,073 86,533 Crop insurance 20,270 4,091 16,880 44,129 Drying fuel 1, ,837 Irrigation energy CCC buyback 6, ,227 15,179 Crop hauling and trucking Crop marketing ,388 Crop miscellaneous 1,549 1,074 1,686 3,220 Feeder livestock purchase 10,559 5,793 7,612 23,798 Purchased feed 10,277 10,382 12,260 6,440 Breeding fees Veterinary 1,845 2,069 2, Supplies 1,185 1,254 1, Livestock custom hire Livestock leases Grazing fees Livestock hauling and trucking Livestock marketing , Interest 28,046 15,361 24,708 48,633 Fuel & oil 27,872 12,149 24,371 49,962 Repairs 30,181 11,880 27,943 51,274 Custom hire 11,370 3,517 10,097 20,698 Hired labor 11,385 2,348 8,136 27,489 Land rent 48,983 15,887 44, ,209 Stock/quota lease 2, ,583 2,949 Machinery leases 3,797 1,034 3,166 8,972 Building leases ,187 Real estate taxes 3,785 2,030 3,078 5,849 Farm insurance 5,447 2,571 4,736 9,472 Utilities 4,490 2,683 4,063 6,573 Dues & professional fees 1, ,272 3,724 Hedging account deposits 3, ,952 Miscellaneous 5,385 2,940 5,775 9,071 Total cash expense 373, , , ,741 Net cash farm income 84,581 28,240 68, ,357 Inventory Changes Crops and feed 103, , ,661 Market livestock 1,058-5,962 3,148 7,590 Accounts receivable 14,764 3,715 7,963 25,530 Prepaid expenses and supplies 15, ,004 37,704 Accounts payable -1,061-5, ,341 Total inventory change 133,388-7,786 78, ,826 Net operating profit 217,969 20, , ,183 Depreciation and Other Capital Adjustments Breeding livestock -2,324-7, ,578 Machinery and equipment -23,165-6,409-18,098-50,329 Buildings and improvements -1, ,676-3,564 Other farm capital 1, ,517 Total depr. and other capital adj -25,769-14,860-18,141-52,954 Net farm income 192,200 5, , ,229 8
14 Inventory Changes (Farms Sorted By Net Farm Income) Number of farms Net cash farm income 84,581 28,240 68, ,357 Crops and Feed Ending inventory 261,217 34, , ,768 Beginning inventory 157,717 34, , ,106 Inventory change 103, , ,661 Market Livestock Ending inventory 37,128 31,014 41,263 28,369 Beginning inventory 36,071 36,975 38,114 20,779 Inventory change 1,058-5,962 3,148 7,590 Accts Receivable & Other Current Assets Ending inventory 39,131 10,943 34,660 64,154 Beginning inventory 24,367 7,228 26,697 38,624 Inventory change 14,764 3,715 7,963 25,530 Prepaid Expenses and Supplies Ending inventory 33,920 4,275 23,580 81,247 Beginning inventory 18,793 3,635 14,577 43,543 Inventory change 15, ,004 37,704 Accounts Payable & Accrued Expenses Beginning inventory 26,997 11,641 27,956 42,595 Ending inventory 28,057 17,536 28,305 39,254 Inventory change -1,061-5, ,341 Total inventory change 133,388-7,786 78, ,826 Net operating profit 217,969 20, , ,183 9
15 Depreciation and Other Capital Adjustments (Farms Sorted By Net Farm Income) Number of farms Net operating profit 217,969 20, , ,183 Breeding Livestock Ending inventory 54,654 69,679 55,217 24,064 Capital sales 2,335 1,776 4,615 1,224 Beginning inventory 51,310 62,883 51,902 24,365 Capital purchases 8,002 16,445 7,120 3,501 Depreciation, capital adjust. -2,324-7, ,578 Machinery and Equipment Ending inventory 278,611 98, , ,937 Capital sales 4,464 1,157 3,096 9,395 Beginning inventory 245,608 88, , ,641 Capital purchases 60,632 17,641 40, ,021 Depreciation, capital adjust. -23,165-6,409-18,098-50,329 Buildings and Improvements Ending inventory 52,107 21,000 34, ,726 Capital sales Beginning inventory 45,764 18,918 29,980 95,248 Capital purchases 8,293 2,975 5,934 20,457 Depreciation, capital adjust. -1, ,676-3,564 Other Capital Assets Ending inventory 36,561 11,111 34,681 70,102 Capital sales 2, ,668 Beginning inventory 35,403 9,414 32,079 70,703 Capital purchases 2,205 2,100 2,138 3,551 Depreciation, capital adjust. 1, ,517 Total depreciation, capital adj. -25,769-14,860-18,141-52,954 Net farm income 192,200 5, , ,229 10
16 Profitability Measures (Farms Sorted By Net Farm Income) Number of farms Profitability (assets valued at cost) Net farm income 192,200 5, , ,229 Labor and management earnings 159,324-5, , ,804 Rate of return on assets 18.2 % 0.8 % 15.5 % 27.1 % Rate of return on equity 27.7 % -7.3 % 24.2 % 39.4 % Operating profit margin 32.5 % 2.8 % 27.2 % 40.5 % Asset turnover rate 56.0 % 28.2 % 56.8 % 67.1 % Interest on farm net worth 32,877 11,036 23,240 70,424 Farm interest expense 28,511 16,920 25,491 46,689 Value of operator lbr and mgmt. 40,546 18,936 34,856 73,318 Return on farm assets 180,166 3, , ,600 Average farm assets 988, , ,387 1,877,487 Return on farm equity 151,654-13,342 93, ,911 Average farm equity 546, , ,330 1,173,735 Value of farm production 553, , ,915 1,259,063 11
17 Liquidity Measures (Farms Sorted By Net Farm Income) Number of farms Liquidity (cash) Net cash farm income 84,581 28,240 68, ,357 Net nonfarm income 23,861 27,987 21,118 28,840 Family living and taxes 51,167 33,633 45,251 79,492 Principal due on long term debt 9,656 4,929 9,313 14,813 Cash available for interm. debt 47,619 17,666 35, ,892 Average intermediate debt 139,974 99, , ,736 Years to turnover interm. debt Expense as a % of income 82 % 82 % 82 % 81 % Interest as a % of income 6 % 10 % 6 % 5 % Working capital to gross income 44 % 5 % 31 % 64 % Liquidity (accrual) Total accrual farm income 576, , ,976 1,291,879 Total accrual operating expense 358, , , ,696 Net accrual operating income 217,969 20, , ,183 Net nonfarm income 23,861 27,987 21,118 28,840 Family living and taxes 51,167 33,633 45,251 79,492 Principal due on long term debt 9,656 4,929 9,313 14,813 Available for intermediate debt 181,007 9, , ,717 Average intermediate debt 139,974 99, , ,736 Years to turnover interm. debt Expense as a % of income 62 % 86 % 68 % 54 % Interest as a % of income 5 % 11 % 6 % 4 % Working capital to gross income 35 % 5 % 26 % 46 % 12
18 Balance Sheet at Cost Values (Farms Sorted By Net Farm Income) Number of farms Assets Current Farm Assets Cash and checking balance 15,074 7,385 16,933 20,818 Prepaid expenses & supplies 31,203 4,227 22,700 73,475 Growing crops 2, ,793 5,061 Accounts receivable 32,824 9,751 29,792 51,585 Hedging accounts 1, ,267 Crops held for sale or feed 216,340 33, , ,852 Crops under government loan 12,473-15,445 25,185 Market livestock held for sale 36,674 31,076 40,580 24,865 Other current assets 1, Total current farm assets 349,392 87, , ,068 Intermediate Farm Assets Breeding livestock 53,950 68,953 50,811 21,597 Machinery and equipment 241,104 85, , ,586 Titled vehicles 18,503 13,756 17,237 28,503 Other intermediate assets 17,987 6,961 21,793 31,154 Total intermediate farm assets 331, , , ,840 Long Term Farm Assets Farm land 273, , , ,532 Buildings and improvements 49,689 21,202 34, ,526 Other long-term assets 14,182 4,257 12,587 30,889 Total long-term farm assets 337, , , ,947 Total Farm Assets 1,018, , ,236 1,934,855 Total Nonfarm Assets 129,982 70, , ,704 Total Assets 1,148, , ,040 2,158,559 Liabilities Current Farm Liabilities Accrued interest 13,519 9,358 11,295 19,765 Accounts payable 13,510 7,920 15,758 17,429 Current notes 110,942 44, , ,819 Government crop loans 5,581-7,554 11,104 Principal due on term debt 35,779 18,196 28,625 60,397 Total current farm liabilities 179,332 79, , ,514 Total intermediate farm liabs 120,770 94,433 95, ,500 Total long term farm liabilities 154, , , ,617 Total farm liabilities 454, , , ,631 Total nonfarm liabilities 27,424 22,882 28,265 39,329 Total liabilities 481, , , ,960 Net worth (farm and nonfarm) 667, , ,493 1,408,599 Net worth change 150,186 3, , ,086 Ratio Analysis Current farm liabilities / assets 51 % 91 % 58 % 40 % Curr. & interm farm liab. / assets 44 % 66 % 47 % 36 % Long term farm liab. / assets 46 % 54 % 49 % 40 % Total debt to asset ratio 42 % 57 % 45 % 35 % 13
19 Statement Of Cash Flows (Farms Sorted By Net Farm Income) Number of farms Beginning cash (farm & nonfarm) 17,428 7,099 14,881 28,881 Cash From Operating Activities Gross cash farm income 457, , , ,098 Net nonfarm income 23,861 27,987 21,118 28,840 Total cash farm expense -373, , , ,741 Apparent family living expense -44,462-30,441-38,881-66,824 Income and social security tax -6,606-3,192-6,243-12,300 Cash from operations 57,374 22,595 44, ,073 Cash From Investing Activities Sale of breeding livestock 2,335 1,776 4,615 1,224 Sale of machinery & equipment 4,167 1,014 2,904 8,947 Sale of titled vehicles Sale of farm land 980-2,940 1,557 Sale of farm buildings Sale of other farm assets 2, ,668 Sale of nonfarm assets 2, ,663 5,120 Purchase of breeding livestock -8,002-16,445-7,120-3,501 Purchase of machinery & equip. -54,997-13,599-36, ,348 Purchase of titled vehicles -5,634-4,042-4,379-8,673 Purchase of farm land -19,026-8,996-9,266-37,240 Purchase of farm buildings -8,293-2,975-5,934-20,457 Purchase of other farm assets -2,205-2,100-2,138-3,551 Purchase of nonfarm assets -10,420-4,775-9,150-19,372 Cash from investing activities -95,839-48,811-61, ,763 Cash From Financing Activities Money borrowed 341, , , ,322 Cash gifts and inheritances 3,915 4,358 3,876 4,927 Principal payments -302, , , ,864 Dividends paid Gifts given ,092 Cash from financing activities 42,719 29,541 22,236 56,926 Net change in cash balance 4,254 3,324 5,584 2,236 Ending cash (farm & nonfarm) 21,682 10,423 20,466 31,117 14
20 Financial Standards Measures (Farms Sorted By Net Farm Income) Number of farms Liquidity Current ratio Working capital 200,474 8, , ,083 Solvency (cost) Farm debt to asset ratio 43 % 61 % 48 % 34 % Farm equity to asset ratio 57 % 39 % 52 % 66 % Farm debt to equity ratio 75 % 156 % 91 % 52 % Profitability (cost) Rate of return on farm assets 18.2 % 0.8 % 15.5 % 27.1 % Rate of return on farm equity 27.7 % -7.3 % 24.2 % 39.4 % Operating profit margin 32.5 % 2.8 % 27.2 % 40.5 % Net farm income 192,200 5, , ,229 Repayment Capacity Term debt coverage ratio 392 % 88 % 302 % 654 % Capital replacement margin 152,027-3,465 90, ,537 Efficiency Asset turnover rate (cost) 56.0 % 28.2 % 56.8 % 67.1 % Operating expense ratio 57.3 % 75.3 % 62.4 % 50.8 % Depreciation expense ratio 4.5 % 9.8 % 4.0 % 4.1 % Interest expense ratio 4.9 % 11.2 % 5.6 % 3.6 % Net farm income ratio 33.3 % 3.7 % 28.1 % 41.5 % 15
21 Crop Production and Marketing Summary (Farms Sorted By Net Farm Income) Number of farms Acreage Summary Total acres owned ,050 Total crop acres 1, ,546 3,629 Crop acres owned Crop acres cash rented 1, ,034 2,505 Crop acres share rented Total pasture acres Average Price Received (Cash Sales Only) Wheat, Spring per bushel Barley per bushel Soybeans per bushel Corn per bushel Sunflowers per cwt Canola per cwt Peas, Field per bushel Flax per bushel Wheat, Winter per bushel Wheat, Durum per bushel Beans, Pinto per cwt Sunflowers, Confectionary per cwt Oats per bushel Hay, Alfalfa per ton Hay, Mixed per ton Hay, Grass per ton Average Yield Per Acre Wheat, Spring (bushel) Pasture (aum) Soybeans (bushel) Barley (bushel) Corn (bushel) Sunflowers (cwt) Canola (cwt) Hay, Mixed Alfalfa/Grass (ton) Hay, Grass (ton) CRP ($) Hay, Alfalfa (ton) Wheat, Winter (bushel) Wheat, Durum (bushel) Peas, Field (bushel) Hay, Small Grain (ton) Corn Silage (ton) Oats (bushel) Beans, Pinto (cwt) Sugar Beets (ton) Flax (bushel) Sunflowers, Confectionary (cwt) Hay, Mixed (ton) Lentils (cwt) Hay, Summer Annual Grass (ton)
22 Household and Personal Expenses (Farms Sorted By Net Farm Income) Number of farms Average family size Family Living Expenses Food and meals expense 7,159 5,830 6,744 8,668 Medical care 4,011 2,872 4,074 5,634 Health insurance 5,120 3,370 5,043 5,843 Cash donations 1, ,325 2,065 Household supplies 5,160 4,158 4,719 5,468 Clothing 1,939 1,226 1,770 3,269 Personal care 4,742 2,064 3,778 8,241 Child / Dependent care Alimony and Child support Gifts 1,752 1,137 1,417 2,712 Education 1,642 1,528 1,339 2,848 Recreation 3,096 2,375 2,541 4,670 Utilities (household share) 2,310 1,974 2,121 3,124 Nonfarm vehicle operating expense 3,171 3,298 3,570 3,355 Household real estate taxes Dwelling rent Household repairs 1,384 1,007 1,288 1,396 Nonfarm interest 1,112 1,067 1,289 1,775 Disability / Long term care insuran Life insurance payments 1, ,374 2,469 Nonfarm property insurance Miscellaneous 900 1, ,257 Total cash family living expense 47,372 36,197 44,187 64,300 Family living from the farm Total family living 47,645 36,841 44,594 64,336 Other Nonfarm Expenditures Income taxes 5,931 3,731 4,590 9,975 Furnishing & appliance purchases Nonfarm vehicle purchases 3,370 1,912 3,070 3,989 Nonfarm real estate purchases 1,463 1, Other nonfarm capital purchases 1, ,797 1,015 Nonfarm savings & investments 3,317 1, ,290 Total other nonfarm expenditures 16,406 9,248 9,746 26,508 Total cash family living investment & nonfarm capital purch 63,778 45,445 53,933 90,808 17
23 Operator and Labor Information (Farms Sorted By Net Farm Income) Number of farms Operator Information Average number of operators Average age of operators Average number of years farming Results Per Operator Working capital 192,651 7, , ,700 Total assets (cost) 1,175, , ,258 2,147,615 Total liabilities 474, , , ,502 Net worth (cost) 700, , ,243 1,443,113 Gross farm income 554, , ,372 1,170,420 Total farm expense 369, , , ,606 Net farm income 184,700 5, , ,814 Net nonfarm income 22,930 27,439 20,537 26,128 Family living & tax withdrawals 49,170 32,974 44,005 72,018 Total acres owned Total crop acres 1, , ,288.3 Crop acres owned Crop acres cash rented 1, , ,269.7 Crop acres share rented Total pasture acres Labor Analysis Number of farms Total unpaid labor hours 2,091 1,497 2,217 2,433 Total hired labor hours ,717 Total labor hours per farm 2,742 1,618 2,634 4,149 Unpaid hours per operator 2,009 1,468 2,156 2,204 18
24 Nonfarm Summary (Farms Sorted By Net Farm Income) Number of farms Nonfarm Income Nonfarm wages & salary 15,737 20,385 16,049 13,529 Net nonfarm business income 2,649 1, ,137 Nonfarm rental income 880 1, Nonfarm interest income Nonfarm cash dividends Tax refunds Nontaxable nonfarm income Other nonfarm income 3,207 2,827 2,410 5,107 Total nonfarm income 23,973 28,065 21,374 28,891 Gifts and inheritances 3,915 4,358 3,876 4,927 19
25 Financial Summary (Farms Sorted By Gross Farm Income) Less than 50, , , ,001 - Over All Farms 50, , , ,000 1,000,000 1,000,000 Number of farms Income Statement Gross cash farm income 457,615 29,892 79, , , ,047 1,408,758 Total cash farm expense 373,034 32,010 70, , , ,692 1,209,605 Net cash farm income 84,581-2,118 9,845 32,048 72, , ,154 Inventory change 133,388 16,071 11,640 45, , , ,430 Depreciation and capital adjust -25,769-6,254-9,312-11,215-20,566-37,927-75,321 Average net farm income 192,200 7,699 12,173 66, , , ,262 Median net farm income 130,247 8,524 16,427 56, , , ,033 Profitability (cost) Labor and management earnings 159,324 4,363 2,412 52, , , ,874 Rate of return on assets 18.2 % 1.6 % 2.0 % 11.5 % 17.7 % 20.3 % 21.3 % Rate of return on equity 27.7 % -7.7 % -2.8 % 18.1 % 26.6 % 30.4 % 32.0 % Operating profit margin 32.5 % 6.6 % 7.9 % 27.4 % 33.0 % 33.5 % 33.7 % Asset turnover rate 56.0 % 24.8 % 25.9 % 42.0 % 53.6 % 60.6 % 63.3 % Liquidity Ending current ratio Ending working capital 162,316 9,660 3,024 64, , , ,837 End working capital to gross inc 35.5 % 32.3 % 3.8 % 35.6 % 38.2 % 42.6 % 23.6 % Term debt coverage ratio % % 95.9 % % % % % Expense as a percent of income 62.2 % 72.2 % 77.5 % 66.2 % 61.4 % 60.8 % 62.9 % Interest as a percent of income 4.9 % 14.2 % 11.7 % 7.1 % 5.1 % 4.6 % 4.1 % Solvency (cost) Number of sole proprietors Ending farm assets 1,018, , , , ,538 1,532,571 2,595,215 Ending farm liabilities 454, , , , , ,294 1,206,000 Ending total assets 1,148, , , ,014 1,057,304 1,719,243 2,821,435 Ending total liabilities 481, , , , , ,515 1,254,399 Ending net worth 667,054 72, , , ,988 1,063,727 1,567,036 Net worth change 150,186 6,043 10,378 57, , , ,286 Ending farm debt to asset ratio 45 % 70 % 53 % 53 % 44 % 41 % 46 % Beg total debt to asset ratio 46 % 67 % 48 % 51 % 44 % 43 % 52 % End total debt to asset ratio 42 % 69 % 51 % 49 % 41 % 38 % 44 % Nonfarm Information Net nonfarm income 23,861 25,791 29,103 23,560 23,069 21,250 31,207 Farms reporting living expenses Total family living expense 47,231 33,246 37,784 36,679 46,230 59,712 70,640 Total living, invest, & capital 63,344 34,088 45,714 48,186 62,363 82,582 98,894 Crop Acres Total acres owned ,376 Total crop acres 1, ,665 2,584 4,699 Total crop acres owned ,007 Total crop acres cash rented 1, ,000 1,720 3,384 Total crop acres share rented
26 Financial Summary (Farms Sorted By Age Of Operator) Less All Farms than Over 60 Number of farms Income Statement Gross cash farm income 457, , , , , ,378 Total cash farm expense 373, , , , , ,914 Net cash farm income 84,581 44,357 73, ,280 93, ,464 Inventory change 133,388 58, , , , ,341 Depreciation and capital adjust -25,769-11,573-23,349-32,728-27,288-28,225 Average net farm income 192,200 91, , , , ,580 Median net farm income 130,247 56, , , , ,620 Profitability (cost) Labor and management earnings 159,324 83, , , , ,058 Rate of return on assets 18.2 % 22.1 % 19.7 % 20.8 % 14.8 % 13.6 % Rate of return on equity 27.7 % 54.4 % 34.9 % 34.0 % 19.8 % 16.4 % Operating profit margin 32.5 % 31.1 % 30.1 % 34.1 % 31.1 % 35.2 % Asset turnover rate 56.0 % 71.1 % 65.2 % 61.0 % 47.6 % 38.6 % Liquidity Ending current ratio Ending working capital 162,316 61, , , , ,782 End working capital to gross inc 35.5 % 27.6 % 31.0 % 36.2 % 37.7 % 41.9 % Term debt coverage ratio % % % % % % Expense as a percent of income 62.2 % 63.1 % 64.4 % 61.6 % 62.8 % 57.1 % Interest as a percent of income 4.9 % 5.9 % 5.3 % 4.9 % 4.7 % 4.1 % Solvency (cost) Number of sole proprietors Ending farm assets 1,018, , ,178 1,265,698 1,193,040 1,054,053 Ending farm liabilities 454, , , , , ,639 Ending total assets 1,148, , ,415 1,415,890 1,377,332 1,189,484 Ending total liabilities 481, , , , , ,338 Ending net worth 667, , , , , ,146 Net worth change 150,186 75, , , , ,843 Ending farm debt to asset ratio 45 % 64 % 53 % 46 % 37 % 33 % Beg total debt to asset ratio 46 % 72 % 58 % 50 % 36 % 32 % End total debt to asset ratio 42 % 64 % 52 % 44 % 34 % 30 % Nonfarm Information Net nonfarm income 23,861 14,040 23,429 24,157 29,129 26,569 Farms reporting living expenses Total family living expense 47,231 32,095 47,003 51,578 50,236 37,069 Total living, invest, & capital 63,344 41,579 58,526 68,149 71,505 46,290 Crop Acres Total acres owned ,170 1,437 Total crop acres 1, ,714 2,366 1,923 1,521 Total crop acres owned Total crop acres cash rented 1, ,211 1,624 1, Total crop acres share rented
27 Financial Summary (Farms Sorted By Farm Type) Crop and All Farms Crop Beef Beef Other Number of farms Income Statement Gross cash farm income 457, , , , ,908 Total cash farm expense 373, , , , ,397 Net cash farm income 84, ,168 32,467 37,152 49,511 Inventory change 133, ,994 27, ,683 34,177 Depreciation and capital adjust -25,769-28,883-17,968-22,108-19,801 Average net farm income 192, ,280 41, ,726 63,886 Median net farm income 130, ,135 19,317 83,035 39,247 Profitability (cost) Labor and management earnings 159, ,879 21, ,804 41,897 Rate of return on assets 18.2 % 22.0 % 5.6 % 12.6 % 8.6 % Rate of return on equity 27.7 % 33.1 % 4.8 % 19.6 % 10.4 % Operating profit margin 32.5 % 34.1 % 21.9 % 30.3 % 22.9 % Asset turnover rate 56.0 % 64.5 % 25.7 % 41.6 % 37.5 % Liquidity Ending current ratio Ending working capital 162, ,314 53, ,108 66,852 End working capital to gross inc 35.5 % 39.0 % 21.7 % 27.2 % 25.8 % Term debt coverage ratio % % % % % Expense as a percent of income 62.2 % 59.5 % 78.5 % 67.5 % 71.6 % Interest as a percent of income 4.9 % 4.3 % 8.6 % 6.5 % 7.5 % Solvency (cost) Number of sole proprietors Ending farm assets 1,018,731 1,119, , , ,499 Ending farm liabilities 454, , , , ,314 Ending total assets 1,148,713 1,266, ,125 1,091, ,377 Ending total liabilities 481, , , , ,097 Ending net worth 667, , , , ,280 Net worth change 150, ,676 31,772 86,884 53,580 Ending farm debt to asset ratio 45 % 41 % 55 % 54 % 48 % Beg total debt to asset ratio 46 % 44 % 51 % 53 % 44 % End total debt to asset ratio 42 % 39 % 53 % 50 % 44 % Nonfarm Information Net nonfarm income 23,861 24,963 23,295 21,532 24,262 Farms reporting living expenses Total family living expense 47,231 53,224 36,869 38,999 38,998 Total living, invest, & capital 63,344 74,338 45,351 45,346 51,074 Crop Acres Total acres owned ,163 1,180 1,070 Total crop acres 1,841 2, ,793 1,034 Total crop acres owned Total crop acres cash rented 1,186 1, , Total crop acres share rented
28 EXPLANATORY NOTES FOR CROPS TABLES The "" tables show the average physical production, gross return, direct costs, overhead costs, and net returns per acre. The "Net Return per Acre" is the "Gross Return per Acre" minus the direct and overhead costs. "Net Return" represents the return to the operator's and family's unpaid labor, management, and equity. It represents the return to all of the resources which are owned by the farm family and hence, not purchased or paid a wage. Net returns are also calculated after a charge for unpaid operator labor and management and after an allocation of direct government payments. The last section of each crop table contains breakeven yield measures which provide useful standards or goals for the individual managers. There are potentially three tables for each crop depending on the farmer's tenure on the land. The crop tables may be for (1) owned land, (2) cash rented land, and (3) share rented land. Individual farms may have data in all three tables if all three land tenure categories are represented in that farm business. When there are less than five farms with a particular crop and tenure, that table is not included in the report. Farms are classified into low 20%, middle 20%, or high 20% on the basis of net return per acre. The classification is done separately for each table, i.e., an individual farm may be in the low 20% for one crop and the high 20% for a second. When there are less than 25 total farms with any particular crop and farmer's tenure, only overall averages are presented. Value per unit is the market price received plus any loan deficiency payment. Miscellaneous income includes crop insurance and disaster payments for the crop. Several cost items, such as "utilities," "hired labor," and "interest paid," are listed under both "direct" and "overhead" costs because some of these costs are specific to that crop whereas others are general overhead costs of the farm. For example, "Direct Lease Payments" refers to non-land inputs or resources leased and used only in that crop enterprise and not listed elsewhere under direct costs; the most common example is the lease of equipment that is crop specific. However, cost of leasing machinery that is used for the entire farm operation is listed as an overhead cost. Interest payments are likewise divided into those incurred directly for a specific crop and those that are not. "Land Rent" is listed as a separate category and is assigned as a direct cost for each crop enterprise because it is identifiable with the specific crop. In the case of double cropping, one-half of the rent is charged to each crop. "Total direct expense per unit" and "Total dir & ovhd exp per unit" are calculated by dividing "Total direct expense per acre" and "Total dir & ovhd expenses per acre," respectively, by "Yield per acre." With labor & management is the breakeven yield after direct, overhead and a labor and management charge are considered. Total exp less govt & oth income is the breakeven yield after all costs (including a labor and management charge) are reduced by government payments and miscellaneous income. In the last section of the crop table, machinery cost per acre is the sum of fuel, repairs, all custom hire and machinery leases, machinery depreciation and interest on intermediate debt. Rounding of individual items for the report may have caused minor discrepancies with the calculated totals. 23
North Dakota Farm Bureau North Dakota Farmers Union
 North Dakota Department of Career and Technical Education Mr. Wayne Kutzer, State Director Board Members Mr. Darrel Remington, Chairperson Mr. Jeffrey Lind, Vice Chairperson Ms. Maren Daley Mr. Brian Duchscherer
North Dakota Farm Bureau North Dakota Farmers Union Monsanto 1 Star in Star Partner Program
 North Dakota Department of Career and Technical Education Mr. Wayne Kutzer, State Director Board Members Mr. Darrel Remington, Chairperson Mr. Jeffrey Lind, Vice Chairperson Ms. Maren Daley Mr. Brian Duchscherer
FARM BUSINESS MANAGEMENT
 FARM BUSINESS MANAGEMENT 2009 Annual Report Central and West Central Minnesota April, 2010 A Management Education Program Minnesota State Colleges and Universities Ridgewater College VISIT OUR WEBSITE
2012 ANNUAL REPORT State Averages
 2012 ANNUAL REPORT State Averages North Dakota Farm and Ranch Business Management Education Regional Reporting Areas www.ndfarmmanagement.com North Dakota Department of Career and Technical Education Mr.
2013 ANNUAL REPORT Region 2
 2013 ANNUAL REPORT Region 2 North Dakota Farm and Ranch Business Management Education Regional Reporting Areas www.ndfarmmanagement.com North Dakota Department of Career and Technical Education Mr. Wayne
2014 ANNUAL REPORT South Central North Dakota
 2014 ANNUAL REPORT South Central North Dakota North Dakota Farm and Ranch Business Management Education www.ndfarmmanagement.com North Dakota Department of Career and Technical Education Mr. Wayne Kutzer,
2016 ANNUAL REPORT Western North Dakota
 2016 ANNUAL REPORT Western North Dakota North Dakota Farm and Ranch Business Management Education www.ndfarmmanagement.com Cover photo courtesy of Lynsey Aberle, Norwich, ND North Dakota Department of
2014 ANNUAL REPORT North Central North Dakota
 2014 ANNUAL REPORT North Central North Dakota North Dakota Farm and Ranch Business Management Education www.ndfarmmanagement.com North Dakota Department of Career and Technical Education Mr. Wayne Kutzer,
2016 ANNUAL REPORT South Central North Dakota
 2016 ANNUAL REPORT South Central North Dakota North Dakota Farm and Ranch Business Management Education www.ndfarmmanagement.com North Dakota Department of Career and Technical Education Mr. Wayne Kutzer,
2007 Michigan Cash Grain Farm Business Analysis Summary. Eric Wittenberg And Stephen Harsh. Staff Paper December, 2008
 2007 Michigan Cash Grain Farm Business Analysis Summary Eric Wittenberg And Stephen Harsh Staff Paper 2008-07 December, 2008 Department of Agricultural, Food, and Resource Economics MICHIGAN STATE UNIVERSITY
2014 ANNUAL REPORT State Averages
 2014 ANNUAL REPORT State Averages North Dakota Farm and Ranch Business Management Education www.ndfarmmanagement.com North Dakota Department of Career and Technical Education Mr. Wayne Kutzer, State Director
2017 ANNUAL REPORT South Central North Dakota
 2017 ANNUAL REPORT South Central North Dakota North Dakota Farm and Ranch Business Management Education www.ndfarmmanagement.com North Dakota Department of Career and Technical Education Mr. Wayde Sick,
2016 ANNUAL REPORT State Averages North Dakota Farm and Ranch Business Management Education
 2016 ANNUAL REPORT State Averages North Dakota Farm and Ranch Business Management Education www.ndfarmmanagement.com North Dakota Department of Career and Technical Education Mr. Wayne Kutzer, State Director
2007 Michigan Dairy Farm Business Analysis Summary. Eric Wittenberg And Christopher Wolf. Staff Paper December, 2008
 2007 Michigan Dairy Farm Business Analysis Summary Eric Wittenberg And Christopher Wolf Staff Paper 2008-04 December, 2008 Department of Agricultural, Food, and Resource Economics MICHIGAN STATE UNIVERSITY
2011 Michigan Cash Grain Farm Business Analysis Summary. Eric Wittenberg And Christopher A. Wolf. Staff Paper October, 2012
 2011 Michigan Cash Grain Farm Business Analysis Summary Eric Wittenberg And Christopher A. Wolf Staff Paper 2012-09 October, 2012 Department of Agricultural, Food, and Resource Economics MICHIGAN STATE
2015 Michigan Dairy Farm Business Analysis Summary. Eric Wittenberg And Christopher Wolf. Staff Paper November, 2016
 2015 Michigan Dairy Farm Business Analysis Summary Eric Wittenberg And Christopher Wolf Staff Paper 2016-01 November, 2016 Department of Agricultural, Food, and Resource Economics MICHIGAN STATE UNIVERSITY
2004 Michigan Dairy Farm Business Analysis Summary. Eric Wittenberg Christopher Wolf. Staff Paper September 2005
 Staff Paper 2004 Michigan Dairy Farm Business Analysis Summary Eric Wittenberg Christopher Wolf Staff Paper 2005-10 September 2005 Department of Agricultural Economics MICHIGAN STATE UNIVERSITY East Lansing,
2008 Michigan Cash Grain Farm Business Analysis Summary. Eric Wittenberg And Stephen Harsh. Staff Paper November, 2009
 2008 Michigan Cash Grain Farm Business Analysis Summary Eric Wittenberg And Stephen Harsh Staff Paper 2009-11 November, 2009 Department of Agricultural, Food, and Resource Economics MICHIGAN STATE UNIVERSITY
2015 Michigan Cash Grain Farm Business Analysis Summary. Eric Wittenberg And Christopher A. Wolf. Staff Paper November, 2016
 2015 Michigan Cash Grain Farm Business Analysis Summary Eric Wittenberg And Christopher A. Wolf Staff Paper 2016-02 November, 2016 Department of Agricultural, Food, and Resource Economics MICHIGAN STATE
2014 Michigan Cash Grain Farm Business Analysis Summary. Eric Wittenberg And Christopher A. Wolf. Staff Paper December, 2015
 2014 Michigan Cash Grain Farm Business Analysis Summary Eric Wittenberg And Christopher A. Wolf Staff Paper 2015-07 December, 2015 Department of Agricultural, Food, and Resource Economics MICHIGAN STATE
2014 Michigan Dairy Farm Business Analysis Summary. Eric Wittenberg And Christopher Wolf. Staff Paper December, 2015
 2014 Michigan Dairy Farm Business Analysis Summary Eric Wittenberg And Christopher Wolf Staff Paper 2015-08 December, 2015 Department of Agricultural, Food, and Resource Economics MICHIGAN STATE UNIVERSITY
2009 Michigan Dairy Farm Business Analysis Summary. Eric Wittenberg And Christopher Wolf. Staff Paper December, 2010
 2009 Michigan Dairy Farm Business Analysis Summary Eric Wittenberg And Christopher Wolf Staff Paper 2010-04 December, 2010 Department of Agricultural, Food, and Resource Economics MICHIGAN STATE UNIVERSITY
2006 Michigan Dairy Grazing Farm Business Analysis Summary. Eric Wittenberg And Christopher Wolf. Staff Paper November, 2007
 2006 Michigan Dairy Grazing Farm Business Analysis Summary Eric Wittenberg And Christopher Wolf Staff Paper 2007-09 November, 2007 Department of Agricultural Economics MICHIGAN STATE UNIVERSITY East Lansing,
Appendix I Whole Farm Analysis Procedures and Measures
 Appendix I Whole Farm Analysis Procedures and Measures The whole-farm reports (except for the balance sheets) include the same number of farms, which were all of the farms whose records were judged to
2007 Michigan Dairy Grazing Farm Business Analysis Summary. Eric Wittenberg And Christopher Wolf. Staff Paper December, 2008
 2007 Michigan Dairy Grazing Farm Business Analysis Summary Eric Wittenberg And Christopher Wolf Staff Paper 2008-5 December, 2008 Department of Agricultural, Food, and Resource Economics MICHIGAN STATE
The entire report is available at:
 2005 Annual Report Staff Paper P06-5 Department of Applied Economics University of Minnesota St. Paul, MN 55108 March 2006 The University of Minnesota is committed to the policy that all persons shall
The entire report is available at:
 The University of Minnesota is committed to the policy that all persons shall have equal access to its programs, facilities, and employment without regard to race, color, creed, religion, national origin,
North Dakota State Beef Average Summary
 North Dakota State Beef Average Summary Historical Data: Average Beef Net Returns from Farm & Ranch Management Programs for the last 15 years. $250.00 $200.00 $150.00 $100.00 $50.00 $- $(50.00) Average
The entire report is available at:
 The University of Minnesota is committed to the policy that all persons shall have equal access to its programs, facilities, and employment without regard to race, color, creed, religion, national origin,
The entire report is available at:
 The University of Minnesota is committed to the policy that all persons shall have equal access to its programs, facilities, and employment without regard to race, color, creed, religion, national origin,
2017 Farm/Ranch Business Management Instructors
 2017 Farm/Ranch Business Management Instructors Bismarck Kyle Olson kyle.olson3@bismarckstate.edu Bismarck State College 1500 Edwards Avenue Bismarck, ND 58506-5587 701-224-5417 701-323-4345 Fax Bottineau
Financial Characteristics of North Dakota Farms
 Agribusiness & Applied Economics Report No. 744 September 2015 Financial Characteristics of North Dakota Farms 2005- Andrew L. Swenson Department of Agribusiness and Applied Economics Agricultural Experiment
2006 Iowa Farm Costs. and Returns File C1-10. Ag Decision Maker. Definition of Terms Used
 2006 Iowa Farm Costs Ag Decision Maker and Returns File C1-10 The farm record data utilized in this report were obtained from the Iowa Farm Business Associations. The average of all farms in each table
Financial Characteristics of North Dakota Farms
 Agribusiness & Applied Economics Report No. 756 September 2016 Financial Characteristics of North Dakota Farms 2006- Andrew L. Swenson Department of Agribusiness and Applied Economics Agricultural Experiment
Financial Characteristics of North Dakota Farms
 Agribusiness & Applied Economics Report No. 778 August 2017 Financial Characteristics of North Dakota Farms 2007- Andrew L. Swenson Department of Agribusiness and Applied Economics Agricultural Experiment
2012 STATE FFA FARM BUSINESS MANAGEMENT TEST PART 2. Financial Statements (FINPACK Balance Sheets found in the resource information)
") 2012 STATE FFA FARM BUSINESS MANAGEMENT TEST PART 2 Financial Statements (FINPACK Balance Sheets found in the resource information) Please use the Market Value when making the calculations for the Zimmerman
2012 STATE FFA FARM BUSINESS MANAGEMENT TEST PART 2 Financial Statements (FINPACK Balance Sheets found in the resource information) Please use the Market Value when making the calculations for the Zimmerman
1995 Annual Report. Southeastern Minnesota Farm Business \ Management Association COOPERATING AGENCIES:
 1995 Annual Report Southeastern Minnesota Farm Business \ Management Association COOPERATING AGENCIES: University of Minnesota, Institute of Agriculture, Forestry, and Home Economics County Extension Services
Cash Flow and Enterprise Information - step two for your 2016 farm analysis
 1 of 24 Name Address County Phone Email Year Born Year Started Farming Cash Flow and Enterprise Information - step two for your 2016 farm analysis Now that you have a beginning and an ending balance sheet,
The sales price for Pasture equivalents is zero. Check the feed prices on the last section of the Budgets.
 File: M&m FINFLO 2006 Warning The sales price for Pasture equivalents is zero. Check the feed prices on the last section of the Budgets. Max and Marlene Profit FINLRB: Succession example Anyplace, Eastern
Financial Characteristics of North Dakota Farms
 g Agricultural Economics Report No. 379 August 1997 Financial Characteristics of North Dakota Farms 1994-1996 Andrew L. Swenson Cole R. Gustafson Department of Agricultural Economics North Dakota State
2009 Organic Farm Performance
 This document is made available electronically by the Minnesota Legislative Reference Library as part of an ongoing digital archiving project. http://www.leg.state.mn.us/lrl/lrl.asp 2009 Organic Farm Performance
Financial Characteristics of North Dakota Farms
 Agricultural Economics Report No. 358 August 1996 Financial Characteristics of North Dakota Farms 1993-1995 Andrew L. Swenson Cole R. Gustafson Department of Agricultural Economics North Dakota State University
Revenue Components. Yield Government Programs Crop Insurance
 Farm Financial Conditions 25th Annual Crop Insurance Conference January 22, 2018 Fargo, ND Andrew Swenson Extension Farm Management Specialist Department of Agribusiness and Applied Economics North Dakota
Agricultural Economics
 Ag Econ 341 Agricultural Economics Financial Characteristics of North Dakota Farms 1992-1994 Andrew Swenson and Cole Gustafson DEPARTMENT OF AGRICULTURAL ECONOMICS AGRICULTURAL EXPERIMENT STATION NORTH
Agriculture & Business Management Notes...
 Agriculture & Business Management Notes... SPA Standardized Performance Analysis For Cow/Calf Producers -- A Worksheet Approach -- Cow/calf producers have been challenged to be lower cost producers, to
Highlights from the 2007 North Dakota Region 4 Averages
 Highlights from the 2007 North Dakota Region 4 Averages Overview for Region 4 The western part of North Dakota had a good year for crop production with an overall increase in yields and increases in prices.
SOUTHWESTERN MINNESOTA FARM BUSINESS MANAGEMENT ASSOCIATION ANNUAL REPORT
 SOUTHWESTERN MINNESOTA FARM BUSINESS MANAGEMENT ASSOCIATION 2012 ANNUAL REPORT Staff Paper P13-2 Department of Applied Economics University of Minnesota Saint Paul, MN 55108 March 2013 In Cooperation with:
MILK PRODUCTION COSTS in 1998 on Selected WISCONSIN DAIRY FARMS
 MILK PRODUCTION COSTS in 1998 on Selected WISCONSIN DAIRY FARMS by Gary Frank and Jenny Vanderlin 1 July 23, 1999 Introduction Total cost of production per hundredweight equivalent of milk ($14.90) was
Managing For Today s Cattle Market And Beyond: A Comparative Analysis Of ND - Demo Cow Herd To North Dakota Database
 Managing For Today s Cattle Market And Beyond: A Comparative Analysis Of ND - Demo - 160 Cow Herd To North Dakota Database By Harlan Hughes Extension Livestock Economist Dept of Agricultural Economics
State Farm Business Management Program Database. Crop Farm Sort
 Minnesota State Colleges and Universities State Farm Business Management Program Database - 2015 Financial Summary by Gross Farm Income Financial Summary by Crop Acres Financial Standards Measures by Gross
Managing For Today s Cattle Market And Beyond A Comparative Analysis Of Demo Herd 1997 Herd To McKenzie County Database
 Managing For Today s Cattle Market And Beyond A Comparative Analysis Of Demo Herd 1997 Herd To McKenzie County Database By Harlan Hughes Extension Livestock Economist Dept of Agricultural Economics North
Economics 330 Fall 2005 Exam 1. Strategic Planning and Budgeting
 Economics 330 Fall 2005 Exam 1 K E Y Strategic Planning and Budgeting Circle the letter of the best answer. You may put a square around the letter of your second choice. If your second choice is right,
2013 Ohio Farm Business Analysis
 2013 Ohio Farm Business Analysis Dairy Enterprise Analysis Summary Including Benchmark Reports For information on participating in the Ohio Farm Business Analysis program analyzing your farm s 2014 performance,
MILK PRODUCTION COSTS and SELECTED FINANCIAL BENCHMARKS FROM 978 WISCONSIN DAIRY FARMS
 1996 1 MILK PRODUCTION COSTS and SELECTED FINANCIAL BENCHMARKS FROM 978 WISCONSIN DAIRY FARMS by Gary Frank and Jenny Vanderlin 2 August 27, 1997 Introduction In this study of 1996 records, 978 dairy farms
2017 Ohio Farm Business Summary
 OHIO STATE UNIVERSITY EXTENSION 2017 Ohio Farm Business Summary Crop Enterprise Analysis with Benchmark Reports farmprofitability.osu.edu Our Thanks To: The professionals who worked with farms and completed
L Kansas State University (I. Department of Agricultural Economi<ii} FARM MANAGEMENT DATA BANK DOCUMENTATION LARRY N. LANGEMEIER--
 FARM MANAGEMENT DATA BANK DOCUMENTATION LARRY N. LANGEMEIER-- April 1990 No. 90-10 Department of Agricultural Economi
BUSINESS SUMMARY DAIRY FARM NEW YORK SMALL HERD FARMS, 140 COWS OR FEWER, 2013 JULY 2014 E.B
 DAIRY FARM BUSINESS SUMMARY JULY 2014 E.B. 2014-07 NEW YORK SMALL HERD FARMS, 140 COWS OR FEWER, 2013 Wayne A. Knoblauch Cathryn Dymond Jason Karszes Mariane Kiraly Charles H. Dyson School of Applied Economics
BUSINESS SUMMARY DAIRY FARM NEW YORK SMALL HERD FARMS, 140 COWS OR FEWER, 2014 JUNE 2015 E.B
 DAIRY FARM BUSINESS SUMMARY JUNE 2015 E.B. 2015-09 NEW YORK SMALL HERD FARMS, 140 COWS OR FEWER, 2014 Wayne A. Knoblauch Cathryn Dymond Jason Karszes Richard Kimmich Charles H. Dyson School of Applied
BUSINESS SUMMARY DAIRY FARM NEW YORK SMALL HERD FARMS, 120 COWS OR FEWER, 2011 JULY 2012 E.B
 DAIRY FARM BUSINESS SUMMARY JULY 2012 E.B. 2012-04 NEW YORK SMALL HERD FARMS, 120 COWS OR FEWER, 2011 Wayne A. Knoblauch Linda D. Putnam Jason Karszes Mariane Kiraly Cathryn Dymond Charles H. Dyson School
Farm Record Analysis. Closeout. Procedures
 2017 Farm Record Analysis Closeout Procedures Dec. 14, 2017 ii Introduction This manual was developed to assist in the standardization of data collection and entry for Farm Business Management Annual Analysis
BUSINESS SUMMARY DAIRY FARM NEW YORK SMALL HERD FARMS, 80 COWS OR FEWER 2002 PARTICIPANT COPY OCTOBER 2003 E.B
 OCTOBER 2003 E.B. 2003-18 DAIRY FARM BUSINESS SUMMARY NEW YORK SMALL HERD FARMS, 80 COWS OR FEWER 2002 Wayne A. Knoblauch Linda D. Putnam Mariane Kiraly Jason Karszes PARTICIPANT COPY Department of Applied
Crop Farm Sort
 Farm Business Management Program Database - 2017 Financial Summary by Gross Farm Income & Crop Acres Corn & Soybean Enterprise Data Selected Precision Technology and Tillage Data April, 2018 Average Dollars
The data for this report were collected by Iowa Farm Business Association consultants and compiled by Iowa State University Extension and Outreach.
 2016 Cash Iowa Rental Farm Rates Costs for Iowa Ag Decision Maker Returns 2015 Survey File C1-10 The farm record data utilized in this report were obtained from the Iowa Farm Business Association. The
Farm Record Analysis. Closeout. Procedures
 2016 Farm Record Analysis Closeout Procedures January 4, 2017 ii Introduction This manual was developed to assist in the standardization of data collection and entry for Farm Business Management Annual
THE BENEFITS OF FINANCIAL BENCHMARKING TO FARMERS IN THE UNITED STATES
 THE BENEFITS OF FINANCIAL BENCHMARKING TO FARMERS IN THE UNITED STATES Robert Craven, Dale Nordquist and Kevin Klair Center for Farm Financial Management, University of Minnesota Abstract Benchmarking
~il~~:~~ii~!. ~...~: {(.~i. !!.~I~ji!': i~i( l:;i;!i:i;i;i:::-: :: C: ..::::)~::m~:l::::t:m:;::;;%::;:!;:;:;:j;.:;:;::::;::j::j:j\:;..
~::m~:l::::t:m:;::;;%::;:!;:;:;:j;.:;:;::::;::j::j:j\:;..") May 1983 A.E. Ext. 83-10 ~il~~:~~ii~!. ~...~:..::::)~::m~:l::::t:m:;::;;::;:!;:;:;:j;.:;:;::::;::j::j:j\:;.. ;/::@H::;j'::;{:: ::::;:;:;:;:::;:::::::::::::;: ::::::;:::::;:;:::;:::::;::::: ~ ~::: ~: ~:
May 1983 A.E. Ext. 83-10 ~il~~:~~ii~!. ~...~:..::::)~::m~:l::::t:m:;::;;::;:!;:;:;:j;.:;:;::::;::j::j:j\:;.. ;/::@H::;j'::;{:: ::::;:;:;:;:::;:::::::::::::;: ::::::;:::::;:;:::;:::::;::::: ~ ~::: ~: ~:
~_~~. oradillla) ~SdeIaee.. New York sw..coiejeefapicuiture aad ljfesdeaees.. :A$tatlitoryColiepof the State Uaivenity CoraeD Ullivenity, Ithaca, New
 ~SdeIaee.. New York sw..coiejeefapicuiture aad ljfesdeaees.. :A$tatlitoryColiepof the State Uaivenity CoraeD Ullivenity, Ithaca, New") I i ~_~~. oradillla) ~SdeIaee.. New York sw..coiejeefapicuiture aad ljfesdeaees.. :A$tatlitoryColiepof the State Uaivenity CoraeD Ullivenity, Ithaca, New York 14153 OVERVIEW NORTHEAST BEEF FARM BUSINESS
I i ~_~~. oradillla) ~SdeIaee.. New York sw..coiejeefapicuiture aad ljfesdeaees.. :A$tatlitoryColiepof the State Uaivenity CoraeD Ullivenity, Ithaca, New York 14153 OVERVIEW NORTHEAST BEEF FARM BUSINESS
2011 Missouri FBMA Farm Record Analysis Closeout Procedures
 2011 Missouri FBMA Farm Record Analysis Closeout Procedures Dr. Norman Rohrbach Farm Business Management Specialist University of Missouri 116 Gentry Hall Columbia, MO 65211-7040 573-882-7379 INTRODUCTION
Economic, Productive & Financial Performance Of Alberta Cow/Calf Operations
 Benchmarks for Cattlemen Economics & Competitiveness Economic, Productive & Financial Performance Of Cow/Calf Operations Southern Fescue land, Mixed land & Moist Mixed land Production Year - 2002 Jan.
Report on Minnesota Farm Finances. April, 2010
 2009 Report on Minnesota Farm Finances April, 2010 Acknowledgements: Contributing Minnesota producers Minnesota State Colleges and Universities Farm Business Management Education Program Southwestern Minnesota
BUSINESS SUMMARY DAIRY FARM NEW YORK SMALL HERD FARMS, 70 COWS OR FEWER 2000 AUGUST 2001 E.B
 AUGUST 2001 E.B. 2001-10 DAIRY FARM BUSINESS SUMMARY NEW YORK SMALL HERD FARMS, 70 COWS OR FEWER 2000 Wayne A. Knoblauch Linda D. Putnam Mariane Kiraly Jason Karszes Department of Applied Economics and
2011 STATE FFA FARM BUSINESS MANAGEMENT TEST PART 2. Financial Statements (FINPACK Balance Sheets found in the resource information)
") 2011 STATE FFA FARM BUSINESS MANAGEMENT TEST PART 2 Financial Statements (FINPACK Balance Sheets found in the resource information) Please use the Market Value when making the calculations for the Zimmerman
2011 STATE FFA FARM BUSINESS MANAGEMENT TEST PART 2 Financial Statements (FINPACK Balance Sheets found in the resource information) Please use the Market Value when making the calculations for the Zimmerman
2015 Missouri FBMA Farm Record Analysis Closeout Procedures
 2015 Missouri FBMA Farm Record Analysis Closeout Procedures Bruce Fowler Farm Business Management Specialist University of Missouri 116 Gentry Hall Columbia, MO 65211-7040 573-882-7379 1 INTRODUCTION This
2016 Ohio Farm Business Summary
 OHIO STATE UNIVERSITY EXTENSION 2016 Ohio Farm Business Summary Dairy Enterprise Analysis with Benchmark Reports Our Thanks To: The professionals who worked with farms and completed the analyses included
Our Thanks To: The professionals who worked with farms and completed the analyses included in this summary:
 Our Thanks To: The professionals who worked with farms and completed the analyses included in this summary: Christina Benton, Program Assistant, Ohio State University Extension Haley Drake, Program Coordinator,
BUSINESS SUMMARY DAIRY FARM NEW YORK SMALL HERD FARMS, 80 COWS OR FEWER 2007 JULY 2008 E.B
 DAIRY FARM BUSINESS SUMMARY JULY 2008 E.B. 2008-12 NEW YORK SMALL HERD FARMS, 80 COWS OR FEWER 2007 Wayne A. Knoblauch Linda D. Putnam Mariane Kiraly Jason Karszes Department of Applied Economics and Management
Contribution of Federal Lands to Wyoming Range Livestock Production, 1992
 B-993 February 1994 0 Contribution of Federal Lands to Wyoming Range Livestock Production, 1992 Brett R. Moline Robert R. Fletcher David T. Taylor Gerald Fink Frank Henderson University of Wyoming, Cooperative
MILK PRODUCTION COSTS in 2000 on Selected WISCONSIN DAIRY FARMS
 MILK PRODUCTION COSTS in 2000 on Selected WISCONSIN DAIRY FARMS By Gary Frank 1 July 27, 2001 Introduction In 2000, the U.S. Average Milk Price ($12.33) was less than the study farms' total economic cost
Annual Summary Data Kentucky Beef Farms 2013
 Cooperative Extension Service, University of Kentucky College of Agriculture, Food and Environment. Agricultural Economics - Extension No. 2014-04 Kentucky Farm Business Management Program Annual Summary
Report on Minnesota Farm Finances. August, 2009
 2008 Report on Minnesota Farm Finances August, 2009 Acknowledgements: Contributing Minnesota producers Minnesota State Colleges and Universities Farm Business Management Education Program Southwestern
2007 ORGANIC FARM PERFORMANCE IN MINNESOTA
 2007 ORGANIC FARM PERFORMANCE IN MINNESOTA PROJECT PARTNERS www.mda.state.mn.us 651-201-6012 www.cffm.umn.edu 800-234-1111 Organic Crop Improvement Association Minnesota Chapter #1 www.mnocia.org 218-253-4907
MILK PRODUCTION COSTS in 2001 on Selected WISCONSIN DAIRY FARMS
 MILK PRODUCTION COSTS in 2001 on Selected WISCONSIN DAIRY FARMS By Gary Frank and Jenny Vanderlin 1 July 22, 2002 Introduction The good news is that higher milk prices in 2001 caused an increased of almost
Annual Summary Data Kentucky Beef Farms
 Cooperative Extension Service, University of Kentucky College of Agriculture, Food and Environment. Agricultural Economics - Extension No. 2013-13 Kentucky Farm Business Management Program Annual Summary
DAIRY FARM BUSINESS SUMMARY CENTRAL VALLEYS REGION 2007 SEPTEMBER 2008 E.B
 DAIRY FARM BUSINESS SUMMARY SEPTEMBER 2008 E.B. 2008-17 CENTRAL VALLEYS REGION 2007 Wayne A. Knoblauch Linda D. Putnam Jason Karszes Daniel Murray Charles Z. Radick Cathy S. Wickswat James P. Manning Bonnie
3. Dairy Production Data: 3.1. Year-end milk check showing total pounds of milk sold for the year DHIA Herdcode
 Dairy Cash Flow Plan extension.psu.edu Annual Cash Flow Checklist: 1. Historical Financial Data: 1.1. 2015 Income & Expenses Bring print out from computer or paper record book if possible 1.2. 2015 Schedule
A. Circle the best answer. Put a square around your second choice, if you want. If your second choice is correct you get half credit.
 Economics 330 Exam 1 Fall 2007 Farm Budgeting and Planning K E Y A. Circle the best answer. Put a square around your second choice, if you want. If your second choice is correct you get half credit. (4
Major Cost Items on Wisconsin Organic, Grazing, and Confinement (Average of All Sizes) Dairy Farms
 Dairy Farms") Major Cost Items on Wisconsin Organic, Grazing, and Confinement (Average of All Sizes) Dairy Farms By Tom Kriegl 1 February 19, 2008 Cost management should receive regular attention on any farm. Focusing
Major Cost Items on Wisconsin Organic, Grazing, and Confinement (Average of All Sizes) Dairy Farms By Tom Kriegl 1 February 19, 2008 Cost management should receive regular attention on any farm. Focusing
PROJECTED COSTS AND RETURNS FOR BEEF CATTLE, DAIRY PRODUCTION, SWINE PRODUCTION AND FORAGE CROPS IN LOUISIANA, 1997
 January 1997 A.E.A. Information Series No. 150 PROJECTED COSTS AND RETURNS FOR BEEF CATTLE, DAIRY PRODUCTION, SWINE PRODUCTION AND FORAGE CROPS IN LOUISIANA, 1997 by Robert W. Boucher Jeffrey M. Gillespie
NEBRASKA FFA FARM MANAGEMENT CAREER DEVELOPMENT CONTEST 2016 Farm Business Management Practice Contest Examination
 NEBRASKA FFA FARM MANAGEMENT CAREER DEVELOPMENT CONTEST 2016 Farm Business Management Practice Contest Examination 1. A farm business operation which is highly financially leveraged is best described as
BUSINESS SUMMARY DAIRY FARM NEW YORK SMALL HERD FARMS, 80 COWS OR FEWER 2003 DECEMBER 2004 E.B
 DECEMBER 2004 E.B. 2004-21 DAIRY FARM BUSINESS SUMMARY NEW YORK SMALL HERD FARMS, 80 COWS OR FEWER 2003 Wayne A. Knoblauch Linda D. Putnam Mariane Kiraly Jason Karszes Department of Applied Economics and
Benchmarking Your Herd s Economic Facts
 Managing for Today s Cattle Market and Beyond March 2002 Benchmarking s Economic Facts By Harlan Hughes, North Dakota State University Dwight Aakre, North Dakota State University Introduction Benchmarking
Cow-Calf Enterprise Standardized Performance Analysis
 Cow-Calf Enterprise Standardized Performance Analysis Overview Cattlemen are challenged to reduce production costs, be more competitive, and increase market share and profits. The first step to lowering
2007 PLANNING BUDGETS FOR DAIRY PRODUCTION IN MISSISSIPPI COSTS AND RETURNS. 112 and 250 COW DAIRY ENTERPRISES LARGE BREED CATTLE MISSISSIPPI, 2007
 2007 PLANNING BUDGETS FOR DAIRY PRODUCTION IN MISSISSIPPI COSTS AND RETURNS 112 and 250 COW DAIRY ENTERPRISES LARGE BREED CATTLE MISSISSIPPI, 2007 MISSISSIPPI STATE UNIVERSITY EXTENSION SERVICE MISSISSIPPI
STATEMENT OF FARMING INCOME AND EXPENSES
 STATEMENT OF FARMING INCOME AND EXPENSES - 2012 NAME: Business #: AgriStability #: Commodity Sales and Program Payments Code Amount Other Farming Income Line Amount GRAINS & FORAGES: Program payouts -
April 1983 A.E. Ext
 April 1983 A.E. Ext. 83-16 - Deportment of Agricultural Economics New York State Co ll ege of Agriculture and life Sciences A Sial uto r r C o1i ~ge 01 the Sial. University Corne ll University, Ith aca,
BUSINESS SUMMARY DAIRY FARM WESTERN NEW YORK REGION 2011 JUNE 2012 E.B
 DAIRY FARM BUSINESS SUMMARY JUNE 2012 E.B. 2012-03 WESTERN NEW YORK REGION 2011 You can t manage what you can t measure. But if you measure it, you can improve it! Wayne A. Knoblauch Linda D. Putnam Jason
STATEMENT OF FARMING INCOME AND EXPENSES
 STATEMENT OF FARMING INCOME AND EXPENSES - 2015 NAME: Business #: AgriStability #: Commodity Sales and Program Payments Code Amount Other Farming Income Line Amount GRAINS & FORAGES: Program payouts -
Economics 230 Lab 4 Section 1 2 Due September 24 Fall 2010 WHOLE FARM BUDGET
 Economics 230 Name Lab 4 Section 1 2 Due September 24 Fall 2010 WHOLE FARM BUDGET The purpose of this lab is to (a) learn how to prepare a whole farm budget for a hypothetical farming situation, and use
International Benchmarks for Wheat Production
 September, 2016 International Benchmarks for Wheat Production Michael Langemeier, Associate Director, Center for Commercial Agriculture Elizabeth Yeager, Department of Agricultural Economics, Kansas State