Marketing Options to Improve Income. Ken Kelley Auburn University
|
|
|
- Claire Barnett
- 5 years ago
- Views:
Transcription

1 Marketing Options to Improve Income Ken Kelley Auburn University
2 Jan-10 May-10 Sep-10 Jan-11 May-11 Sep-11 Jan-12 May-12 Sep-12 Jan-13 May-13 Sep-13 Jan-14 May-14 Sep-14 Jan-15 May-15 Sep-15 Jan-16 May-16 Sep-16 Jan-17 May-17 Sep-17 Jan-18 May-18 Sep-18 Jan-19 Recognizing where we are at $ $ $ $ $ $ $ $ $ $ $85.00 Alabama & Georgia M&L # 1&2 Feeder Steers Alabama Alabama Georgia Georgia Average
3 Mil. Head 140 JANUARY 1 TOTAL CATTLE INVENTORY U.S., Annual = 94.4 Million Head +0.7 Percent Data Source: USDA-NASS Livestock Marketing Information Center C-N-01 09/18/18
4 Mil. Head 140 JANUARY 1 TOTAL CATTLE INVENTORY U.S., Annual Data Source: USDA-NASS Livestock Marketing Information Center C-N-01A 09/18/18
5 PERCENT CHANGE IN CATTLE INVENTORY U.S., January Data Source: USDA-NASS, Analysis by LMIC Livestock Marketing Information Center C-N-48 09/18/18
6 Mil. Head CALF PRICES AND CATTLE INVENTORY Western Kansas Lb. Steers, Annual $ Per Cwt Cattle Inventory Calf Price Data Source: USDA-AMS & USDA-NASS Compiled by LMIC Livestock Marketing Information Center C-N-41 09/18/18
7 Market timing dictates profitability opportunities Replacement Heifers Feeding Cattle Board Sales/Grouping Cattle Price Protection Tools
8 Herdbuilder Receipts
9 Development Costs
10 Calculated Returns Over Calculated Cost
11 2017 Calculated Profit (Average Price Over Calculated Costs) $1, Profit by Producer $1, $1, $1, $ $ $ Profit Average
12 Calculated Heifer Receipts Over Calculated Total Cost Compared to Steer Prices adjusted for time value of Money $1,600 Steer VS. Heifer $1,400 $1,200 $1,000 $800 $600 $400 $200 $ Heifer Profit Over Calculated Total Cost Steer Future Value Linear (Steer Future Value)
13 Statistical Analysis of Herd Builder Data Breed Effects Registration Effects Calving Dates/Ranges Effects Conventional/AI Effects Color Effects Penning Effects
14 Breed Effects Angus Brahman Simmental Angus-Brahman Angus- Simmental Hereford- Brahman Other (Constant) -Single Breed = 50% or greater of that breed with no other significant breed percentages -Mixes =50% of each of the Breeds - Other (Constant) = Everything else
15 Breed Effects on Pen Prices Herdbuilder $ $ Brahman-Hereford, $ $ $ $ $ $50.00 $- $(50.00) $(100.00) $(150.00) Angus, $(79.62) Brahman, $(135.80) Simmental, $49.30 Simm-Angus, $(2.60) Brahman-Angus, $53.11 Other (Constant), $- $(200.00) Series1
16 Registration Effects In Pens of Registered Cattle vs. Pens of Non- Registered Cattle, Registered Pens are worth $ more than Non- Registered. ***Caveat Only registered were angus, which means registered vs. non-registered was limited to angus vs. non-angus. The registered dollars may be overstated and more of a measure of registered angus vs non.
17 Calving Ranges Length For every day of decrease in length of advertised calving range There is a subsequent Increase in Pen Price 2.10 Per Day Per Pen

18 Calving Range - Months For every increase in initial month of calving range, There is a subsequent decrease in price of : Per Heifer Per month

19 There is likely a correlation between birth months and first month of calving rangeand subsequently price..


20 Conventional or AI? AI Pens of AI bred heifers bring $ more per heifer than pens of only bull service. This included guaranteed AI and AI exposed.
21 Color Same pen color (no mixes of colors, i.e. blacks and b.w.f. in same pen) has a positive relationship with price. It is more significant across totals than within years, with the impact ranging from $ $ per pen, dependent upon variables and regressions used.
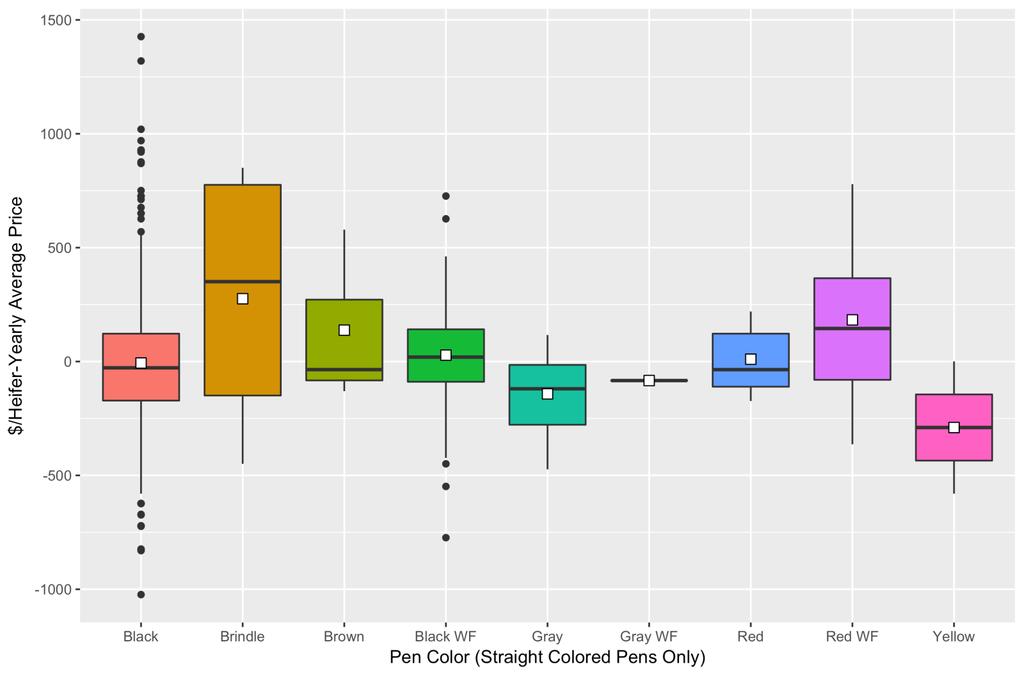
22 Monochromatic Pens $216.90
23 Top 15 % average + $ Bottom 15 % average -$ Herdbuilder Averages with Tops and Bottoms $4,000 $3,500 $3,000 $2,500 $2,000 $1,500 $1,000 $500 $ Sale Price Top 15% Bottom 15% Total Cost
24 Thoughts on developing replacement heifers Ask yourself if now is the time in the market cycle to be selling replacements? It can add value to your heifer calves You have to know your sale - *****not all sales value the same traits that buyers at the Herdbuilder sale value In the end, you are paid for quality
25 Net Return Prospects for Cattle Finishing in 2019 Michael Langemeier html?utm_source=farmdoc+daily+and+Farm+Policy+News+Updates&utm_campaign=798ce79c37-FDD_RSS_ _CAMPAIGN&utm_medium= &utm_term=0_2caf2f ce79c
26 $ Per Cwt BOXED BEEF CUTOUT VALUE Choice Lbs., Carcass, Negotiated, Weekly JAN APR JUL OCT Avg Data Source: USDA-AMS Livestock Marketing Information Center C-P-62 02/04/19
27 Thou. Head CATTLE SLAUGHTER Federally Inspected, Weekly JAN APR JUL OCT Avg Data Source: USDA-AMS & USDA-NASS Livestock Marketing Information Center C-S-08 02/08/19
28 $/cwt 105 KANSAS FEEDLOT CLOSEOUTS Feeding Costs per Cwt, Steers Jan Feb Mar Apr May Jun Jul Aug Sep Oct Nov Dec Avg. 2012/ Data Source: KSU Focus on Feedlots, Compiled by LMIC Livestock Marketing Information Center 02/01/19
29 Bil. Pounds COMMERCIAL BEEF PRODUCTION US, Quarterly JAN-MAR APR-JUN JUL-SEP OCT-DEC Avg. 2013/ Data Source: USDA-NASS, Forecasts by LMIC Livestock Marketing Information Center M-S-01 02/06/19
30
31 Thoughts on feeding cattle Ask yourself if now is time in the cattle cycle to be feeding your cattle? Know your market Record protein production Robust beef demand Uncertainty in trade Consider alternatives for testing the water like Pasture to Rail In the end, you are paid for quality
32 Board Sales/Branded Board Sales Stricter requirements for branded board sales Predetermined weaning and preconditioning expectations Predetermined health protocols Predetermined shipping requirements Health usually a requirement for premiums
33 Price per cwt at a 2018 Alabama Branded Board Sale $ Sale Results from a 2018 Alabama Board Sale $ $ $ $ $ $ $ $ $ $ Price at Delivery Alabama weighted Average Week of August 10th
34 Difference in price highly variable $25.00 Difference between estimated price and weighted average per cwt. $20.00 $15.00 $10.00 $5.00 $ Difference between estimated price and weighted average/cwt Average Difference
35 Thoughts on board sales/ branded board sales Ask yourself if now in the cattle cycle is a good time to consider board sales? There is a definite chance at added value Increased prices Reduced shrink There are definitely more requirements Health and handling Lot size You are paid based on quality (somewhat recurring theme)
36 A recurring trend paid based on quality What does the market look for? It depends.. Is there any one animal/marketing scheme that gets the most for your money? Probably not but it depends.


37 Price Determinants of Replacement Cattle at Mississippi Auctions Brian R. Williams Josh Maples Mississippi State University
38 Results: General Characteristics Variable Estimate Standard Error P-Value Age <.0001 Cow (Relative to Pairs) <.0001 Replacement <.0001 Bred < 0.01 Weight < 0.01 Weight Squared < 0.01 Black < 0.01 Horns Month <.0001
39 Results: Breed (Angus is Base) Variable Estimate Standard Error P-Value Angus Cross BeefMaster Brangus Brangus Cross Brahman Brahman Cross <.0001 Charlais Charlais Cross Gelbveigh <.0001 Hereford Hereford Cross Longhorn <.0001 Red Angus Simmental Dairy <.0001 Other


40 Feeder Cattle Muscle score % % % % Muscle score Effect on Price, $/lb 1 +$ $ $ Base n = 20,647
41 Thoughts on quality Breed isn t as important as quality Feeders need something that will grow and produce a desirable carcass They use general characteristics (sometimes even breed stereotypes) to help them increase their chances at a desirable end product
42 PRF Pasture, Rangeland, and Forage Covers perennial pasture, rangeland, or forage used to feed livestock Meant to be a risk management tool to cover the precipitation needed to produce forage
43 What is it? Program of Risk Management Agency (RMA - USDA) Started in 2007 Sold by private insurance agents Significant premium subsidy: 51 59% paid by USDA Can insure grazing land or perennial forages Area based: uses a grid system Single peril: only insures precipitation
44 What is it? Guarantee from 70% to 90% of normal rainfall Coverage per acre Policy runs January to December Pick time periods you want to insure - at least two 2 month intervals - maximum of 60% of $ coverage for any interval
45 What is it? Rainfall index used to determine payoffs If rainfall is lower than historical average, a payoff is possible
46 Well.Does it work? Depends on definition of work Research suggests that it does insure against low rainfall periods Research also suggests that the index may or may not correlate with low forage yield periods BUT, overall, PRF is expected to increase returns.
47 LRP Livestock Risk Protection Provides for a decline in the CME feeder cattle Price Index while you own cattle CME Feeder cattle index is a 7 day weighted average of cash feeder cattle prices across U.S.
48 Who can use LRP? Cattle must weight less than 900lbs. at end of insurance period Can insure steers and heifers Coverage available for 13, 17, 21, 26, 30, 34, 39, 43, 47, or 52 week periods Price on cattle weighing less than 600 lbs. at end will be adjusted by 10%
49 How does it work? Want to insure against a price decline - purchase LRP for number of head and ending weight - choose coverage price (~strike price) - end date of coverage For this, you pay a premium
50 Market Alternatives All can work AND they all can cost you money Ken Kelley