From boom to bust: Short-term swings and long-term trends in global agriculture. Bled, Slovenia, 6 June 2017
|
|
|
- Erick Jones
- 5 years ago
- Views:
Transcription
1 From boom to bust: Short-term swings and long-term trends in global agriculture Bled, Slovenia, 6 June 2017 Josef Schmidhuber Food and Agriculture Organization of the United Nations (FAO)
2 The current market situation


3 Current world market prices: -2.8% in March 2017, but +13.4% above
4 But prices are way down from their peak levels Food Prices Indices Peak values March 2017 Change: March 2017 over peak values % FAO Food Price Index Feb Cereals June Oils Feb Sugar Jan Meat Aug Dairy Feb Quelle: FAO 4
5 Back to the long-term decline in real prices 140,00 120,00 World oil and food crisis fert prices 4 fold great grain robbery and depleted stocks export restrictions and bans Wheat: US price, CPI deflated 100,00 US$/t 80,00 60,00 40,00 Low stocks EU export tax Dec 95 Reduction of set'aside in 96/ /2008 Export taxes Arg, India, Nepal Pakistan Import subsidies Egypt, Algeria 2010 Export ban by Russia 20,00 0,00
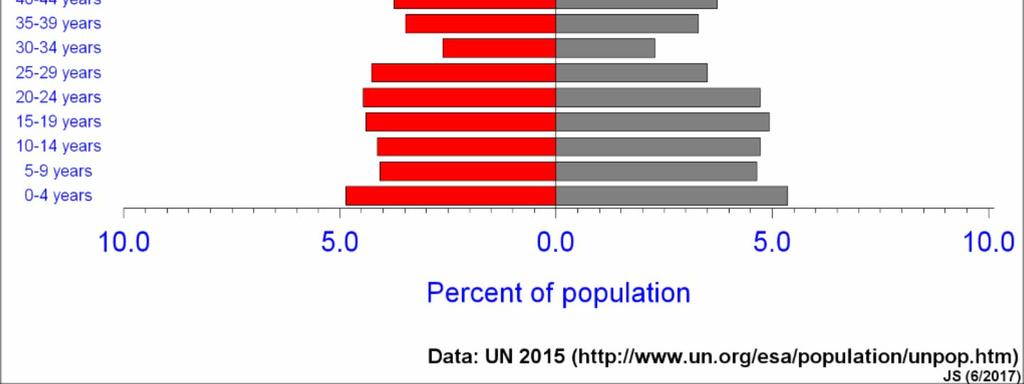
6 Long-term driver 1 Population growth, urbanization, ageing
7 Population (bn) 12,0 Global population growth to continue, but at a slower pace Increments over 10 years 0,9 10,0 8,0 6,0 4,0 2,0 0, ,8 0,7 0,6 0,5 0,4 0,3 0,2 0,1 0,0 Source: UNPD, 2016
8 Urbanization to accelerate 7 6 billion people Rural Urban
9
10
11 Long-term driver 2 Income growth
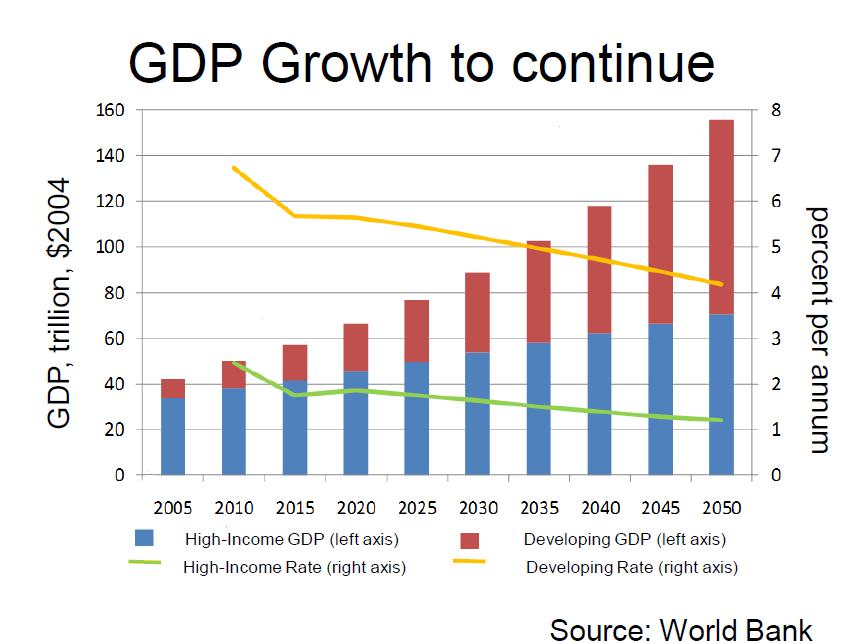
12
13 Consumption(kcal/pc) and GDP p.c. (62 Developing Countries)
14 The outlook in brief Demand to 2050
15
16 P End of the treadmill? End of falling real prices? D1 D2 D3 D4 D5 D*5 T 1 T 2 S1 T 3 T 4 S2 S3 S4 S5 S6 Q
17 From trends to swings (1): The impact of the energy sector
18 How big is the energy market? 1. Energy market (TPES): nearly 500 EJ 2. Biomass: 50 EJ (80% in developing countries) 3. Biofuels: 3.3 EJ, on ca. 33 million ha 4. Transport energy needs: ca. 95 EJ 5. Crop area to cover transport energy needs: >1000 million ha, i.e. 2/3 of global crop area. =>Energy market is large, creates perfectly elastic demand for agricultural produce up to break-even points (parity prices). =>Bio-energy subsidies have a price supporting impact, not price depressing as the traditional coupled agricultural subsidies. No WTO pressure to reduce/eliminate them
19 350,00 Corn and Crude oil prices 140,00 300,00 120,00 250,00 100,00 Corn in US$/t 200,00 150,00 100,00 80,00 60,00 40,00 Crude in US$/barrel 50,00 20,00 0,00 0,00 Corn (maize) Crude oil
20 From trends to swings (2) Back to ample stocks

21 Replenished stocks for cereals

22 replenished stocks particularly for wheat
23 Stocks to use ratio v maize prices , , , ,0 25,0 20,0 15, ,0 20 5,0 0 0,0 Maize price in USD/t 1986/ / / / / / / / / / / / / / / / / / / / / / / / / / / / / /162/ % Stocks to Use Real maize price Stocks2Use
24 From trends to swings (3) Investment (GFCF) overhang and hangover?
25 Global investment overhang? Just trend growth, after all Gross Fixed Capital Formation in Agriculture (million USD, CONSTANT 2005 prices) MILLION USD GFCF GFCF Linearna (GFCF )

26 Eastern Europe: Considerable growth in fixed capital in 2007/08, but only trend growth afterwards Eastern Europe - GFCF in Agriculture, forestry and fishery, million USD constant prices MILLIONS USD GFCF GFCF Linearna (GFCF )

27 CIS grain exporters: Considerable growth in fixed capital in 2007/08, but only trend growth afterwards Kazakhstan, Russia, Ukraine - GFCF in Agriculture, forestry and fishery, million USD constant prices MILLIONS USD GFCF GFCF Linearna (GFCF )
28 From trends to swings (4) What will China do?
29 What can we expect from China? 1. Slower overall economic growth, slower population growth, cont. urbanisation 2. Strong focus on food security and basic foodstuffs in the past 3. Ever more urgent resourceproblems, water scarcity, land erosion, etc. 4. Extremely high stock levels, particularly for maize. WTO dispute settlement panel, ethonol production and exports 5. Still high procurement prices, but sharply lower for maize 6. Pig industry goes through a period of structural change, higher feeding intensities, but also improved feeding efficiencies. 7. Lower stocks for maize, lower barley imports from the EU, lower sorghum imports from the US, more domestic soybean production, lower soybean and coarse grain imports?

30 China and the world 100 China's Soybean imports Million Tonnes
31 Wrapping it up Trends 1. Declining population growth and growing saturation of food demand limit long-term potential 2. Price incentives of have attracted private flows into agriculture, but no major investment overhang globally. 3. Enough investment in technology? 4. Medium term: no significant revovery, flat real prices. Swings 1. Low fertilizer/energy prices, ample grain stocks, and saturated biofuelmandates keep potential for short term price up-swing limited. 2. What will happen to China? Faster reforms? Lower prodcurement prices? Soybean, coarse grain imports? 3. Eastern Europe faces domestic demand constraints, shrinking and ageing populations, limited purchasing power from abroad (NENA) 4. We may have seen the bottom, milk, meat and sugar prices slightly higher
32 THANKS