CGMS-Maroc: National System for Agrometeorological monitoring
|
|
|
- Aileen Phelps
- 5 years ago
- Views:
Transcription


1 CGMS-Maroc: National System for Agrometeorological monitoring Mouanis LAHLOU Hassan II Institute of Agronomy and Veterinary Medicine On behalf : Balagui R., Arrach R., El Hairech T., Ajerame M.M.,
2 Content Part1: CGMS-Maroc Objectives of the system Presentation of the system Part 2: Operational cereal yield forecasting in Morocco. Material and methods Results and discussion
3 CGMS-Maroc ( National System for Crop Monitoring
4 Objectives of the system Monitoring the agricultural season Support for political decision-making: Anticipating quantities to import Index insurance : anticipating farmers repayments Area of interest : the hole country
5 Presentation of the system Inputs Reference grid and crop mask Weather data Satellites products Crop statistics CGMS-MAROC System Outputs Mapping Yield forecasting Report generator Export data
6 CGMS-Maroc Data storage


7 Data grid and agricultural mask Each grid will contain the history of all the: meteorological, satellite and crop yields data In agricultural area In non agricultural area


8 Meteorological Data: Daily Interpolated Data. 50 Synoptics stations 150 Vigiobs stations Weather station network Ex: Grid for 09/02/2014
 : NDVI")
9 Satellite decadal data Vegetation indices derived from satellite images available for free in Copernicus Global Land Service (1 km Grid) : NDVI FAPAR LAI
 : LST (MOD11A2: Land Surface Temperature) PET (MOD16A2: Potential")
 All data are automatically download and processed using")
10 Satellite data Estimated agro-climatic data derived from MODIS available for free in USGS Land Processes Distributed Active Archive Center (1 km Grid) : LST (MOD11A2: Land Surface Temperature) PET (MOD16A2: Potential Evapotranspiration) RET (MOD16A2: Real Evapotranspiration) RFE : Satellite-based rainfall: Climate Hazards Group InfraRed Precipitation with Stations (CHIRPS) All data are automatically download and processed using Python Script


11 Temperature comparison The following figures show a comparison between the average maximum temperature taken between the beginning of September 2017 and late April. Stations terrestres Satellite r= 0.66 in the hole country r= 0.62 in he agricultural area


12 Rainfall comparison The following figures show a comparison between the total rainfall taken between the beginning of September 2017 and late April. Stations terrestres Satellite r= 0.61 in the hole country r= 0.52 in he agricultural area


13 Spatial yield interpolation from sample frames Yield classes (10-1 ton/ha) Aggregation at district level Area Frame Sampling districts Yield maps (500m GRID) for each cereal and seasons Geostatistical model


14 Data storage Data grid Data by grid District division Aggregated data by district Agricultural mask Aggregated data by district within agricultural mask
15 CGMS-Maroc System operation


16 Apache/ PHP / WMS Web browser / JavaScript Databases System architecture (Only open Source tools were used) Server side Internet Client side Linux Server Meteorological data Satellite images HTTP protocole Mapping Browsing results Yield forecasting Similarity analysis Processed automatically M. LAHLOU 16
17 CGMS-Maroc Interface
 Report")
18 Main interface CGMS-Maroc Friendly interface with: (1) toolbar navigation, (2) query selector, (3) legend frame, (4) the map frame & 4 Applications Mapping Daly yield forecasting Similarity analysis Agro-climatic indicators evolution (data/graph) Report generator


19 Mapping Grid view Pastoral view District view National view Cumulative rainfall NDVI Cumulative rainfall anomaly with a long term average Provincial view Regional view NDVI anomaly with last 10 years average

20 CGMS-MAROC: Yield forecasting Performed automatically each day from the beginning of February at provincial level with Python script


21 Similarity analysis Rapid characteristics of the cropping season, by comparing the similarity of the past seasons to the current one, from an agroclimatic point of view.
 This feature allows")

22 Agro-climatic indicators evolution (data/graph) This feature allows displaying in tables and graphs the evolution of agrometeorological indicators.


23 Reporting feature Automatic generation of reports at different levels: National Regional And Provincial Including rainfall, temperature and NDVI evolution and anomalies
24 Operational cereal yield forecasting in Morocco
25 Purpose of the study 1. Compare the two approaches of Machines Learning: Statistic: Multiple linear regression Learning: Random Forest and Boosted Tree 2. Quantify the contribution of satellite data in crop yield prediction by comparing models based on the use of: Agro-climatic data from Earth observation Vegetation indices from Copernicus Global Land Service Estimated agro-climatic data derived from MODIS
26 Data characterization 1 dependent variable : yield 140 predictors 4 geographical information 58 meteorological 42 vegetation indices 69 Estimated agro-climatic lines (14 years observation, 3 cereals and 900 districts)
27 Simulation Automation scripts have been developed for the three forecasting techniques selected for this study: Multiple linear regression Random Forest Boosted Tree To perform calculations we For each available growing season, The data was separated into three different subsets to ensure model accuracy: 1. Testing data that correspond to the growing season been analyzed, 2. Validation data (fraction of 20%) 3. Training data (remaining data). The training data was used to build model. Once both the training and validation prediction results are similar to the observed, we use the model to predict the yield for the test data subset.


28 Average observed yield Linear Model Absolute error: Comparison between prevision models Random Forest RMSE = 5.18 qx/ha Boosted Tree RMSE = 6.79 qx/ha RMSE = 5.48 qx/ha


29 Vegetation indices (Satellite) Weather data Absolute error: Comparison between data sources RMSE = 5.76 RMSE = 5.18 Weather & Satellite RMSE = 5.92 RMSE = 4.97 Satellite & Weather estimated from Sat


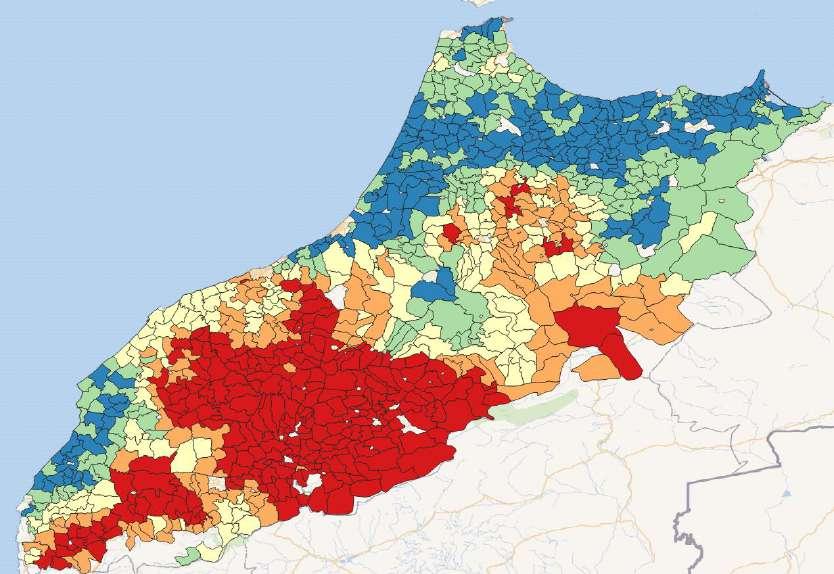
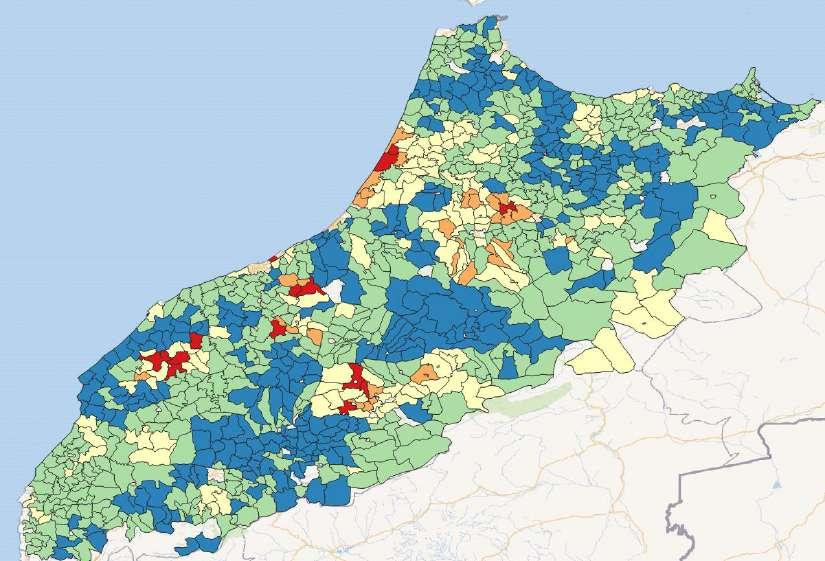

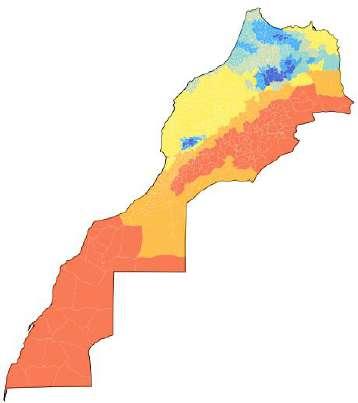
30 Case study 2009 year High production 2014 year Average production RMSE = 3.58 RMSE = 7.65
31 Future Improvement Land cover form last census (irrigated / rainfed) Land cover from Copernicus Move from 1 km to 300 m or 100 m with more accurate land cover Use phenology information derived from satellite images Use multi-model approach (like use AquaCrop output as predicator)
 and dynamics (Satellite & meteorological) maps.")
32 Producing Forest Fire Risk Maps at (day-1 and day-2) By combining statics (Land & Forest) and dynamics (Satellite & meteorological) maps. Ignition risk map Propagation risk map


33 Estimation of Phytomass production in Rangelands.


34