An appraisal of the Indus river basin: a case study under GEF portfolio
|
|
|
- Camilla Thornton
- 5 years ago
- Views:
Transcription
1 An appraisal of the Indus river basin: a case study under GEF portfolio Asif Khan

2 Academics: PhD in Water and Climate PGS in GIS and RS EMBA Project Management BSc Civil Engineering


3 Current Research:
 water supply, ii) food production, iii) energy production/supply, iv) flood and drought mitigation, v) urbanization, and v) industrial")
4 Global challenges o Population growth o Global warming and climate change Source: UN: facts and trends (2006) Increased population will need more: i) water supply, ii) food production, iii) energy production/supply, iv) flood and drought mitigation, v) urbanization, and v) industrial development
 Global warming is causing glacier retreat, Severity in floods and droughts, Increasing water scarcity, Increasing slope instability and landslides,")
5 Global challenges o o Population growth Global warming and climate change Global mean surface temperature increased by / C during , while projected expected increase is 1.4 to 5.8 C during 1990 to 2100 (IPCC 2007, 2013) Global warming is causing glacier retreat, Severity in floods and droughts, Increasing water scarcity, Increasing slope instability and landslides, Increasing Glacier Lake Outburst Floods (GLOFs) Reservoir sedimentation, Forest fires, and Increasing water losses/evapotranspiration Source: (Inman 2010) Adverse impact on Eco-system

6 1
7 Potential mitigation measures Decline in Green House Gas (GHG) emissions, Construction of new irrigation, hydro-power groundwater recharge dams, Renewable energy exploitation (hydropower, Bio fuel, solar and wind energy) Adaptation of improved irrigation practices, Adaptation of sustainable agricultural practices, Precise and accurate policy making against floods and droughts, Afforestation, and Preparation of climate change adaptation strategies and policies
8 Case study areas The Indus Basin
 region, and runs from the north to")
9 The Indus Basin The Indus Basin originates from the Hindukush- Karakoram- Himalaya and Tibetan Plateau (HKH-TP) region, and runs from the north to south.

10 The Indus Basin
11 The Indus Basin The Indus Basin Irrigation System (IBIS) is one of the largest in the world Fulfills ~ 90% of the irrigation needs Cater for > 33% of energy needs (mostly in Pakistan) More than 56-70% of Pakistan and India s population is dependent on agriculture Agriculture contribute ~24% in annual GDP of Pakistan 90% Agriculture is dependent on irrigation

12 Population distribution
13 Water: Population growth and food demand S.No Description Year Units Afghanistan China India Disputed Area Pakistan Total 1 Area. km % Million Population 2050 Million Million Source: Yu et al. (2013) 2010 people/km Population Density 2050 people/km people/km Note: Areas are as per delineation procedure explained in Khan et al. (2014). Population data is as per Jones and O'Neil (2013) SSP2 scenario. Population increase till 2050s based on SSP1-SSP5 is ranging between million people to million people.
14 Water: Population growth and food demand Source: Yu et al. (2013) Description Units Population million * Water requirement Irrigation 1000m Non-irrigation 1000m Total requirement 1000m * Water availability** Total surface and ground water 1000m Shortfall 1000m * Projected estimates, ** Available at watercourse head Source: Afzal (1996)

15 Water: water scarcity

16 Water: water stress in 2040
 Current shortfall in Pakistan is > 4000 MW (Javaid et al.")
17 Energy Demand: Current and Future Source: Hussain et al. (2011) Current shortfall in Pakistan is > 4000 MW (Javaid et al., 2011)


18 Sources of Energy Production Sources of energy production in Pakistan (Awan and Khan, 2014)

19 Sources of Energy Production
20 Hydro-power potential in the Indus Basin The potential hydropower in the Indus Basin (within Pakistan) is 60,158 MW The potential hydropower in the Indus Basin (within India) is about 111,210 MW The potential hydropower in the Indus Basin (within Afghanistan) is about 2,200 MW
 References 1 Afghanistan 13 ~2200 FAO Aquastat (2011) 2 Pakistan 57 ~42500 PPIB (2011) 3 India 355* ~111380 IR (2008) * Overall dams in the Himalayas")
21 Hydro-power potential in the Indus Basin There are 6 Dams underconstruction, while 51 planned in the Indus Basin, within Pakistan (~42,500MW) S.No Country No of Dams Hydro-power potential (MW) References 1 Afghanistan 13 ~2200 FAO Aquastat (2011) 2 Pakistan 57 ~42500 PPIB (2011) 3 India 355* ~ IR (2008) * Overall dams in the Himalayas (Dams in the Indus Basin boundary to be identified). Under-construction/planned dam sites in the Basin (within Pakistan and Afghanistan) are shown in Figure. Total available natural potential is greater than above mentioned hydro-power potential, however above mentioned is either under-construction or planned potential.
 May reduce water supply in Pakistan by 16-17% There is no water-treaty between Pak-Afghan Lead and UN are working on water-treaty since")
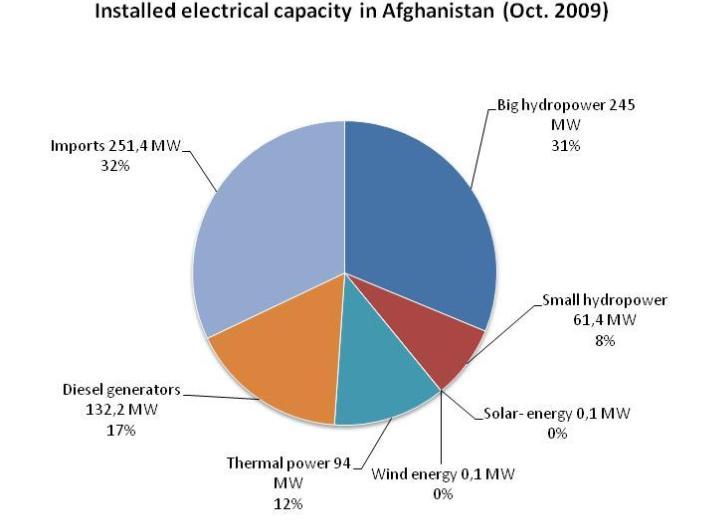
22 Hydro-power potential in the Indus Basin Currently 10-15% population has access to electricity Afghanistan has planned 13 Dams in the Indus Basin (~2,200 MW) May reduce water supply in Pakistan by 16-17% There is no water-treaty between Pak-Afghan Lead and UN are working on water-treaty since long

23 Hydro-power potential in the Indus Basin India planned 355 Dams in the Himalayas with a total potential capacity of ~ 111,380 MW Note: Sites within the Indus Basin to be confirmed
24 Problem: Sedimentation Sedimentation at Tarbela Dam (Ali and Deboer, 2007) Tarbela Dam lost ~31% of storage capacity during , Mangla Dam lost ~ 18% ( ), Chashma barrage lost 51% during Sedimentation will rise with increase in snow and glacier melt
25 Problem: GLOFS Threat

26 Problem: Biodiversity and Eco-system (source: Foley/World Bank, 2009)
27 Issues/Problems Asian temperature rise is greater than world s average temperature rise (IPCC 2007, 2013) According to CMIP 5, under the RCP 4.5, the expected temperature rise is about 2 o C (relative to ) in the whole HKH during , The HKH-TP region has a glacier area of about 33,000 Km 2 (ICIMOD, 2009) and contains about 12,000 Km 3 of freshwater (IPCC, 2007b) Glaciers in the western Himalayas, Hindukush, and eastern Karakoram are losing mass at a high rate (Kaab et al., 2012, 2015, Gardelle et al., 2012, 2013) Glaciers in the western Karakoram are advancing and bear slightly negative mass balance during the last decade (Kaab et al., 2012, 2015; Gardelle et al., 2012, 2013) Monsoon precipitation became more intense and frequent in the last four decades, and is responsible for floods in the region (Wang et al., 2011)

28 Shrinking glaciers

29 Issues/Problems Snow- and glacier-melt contributes more than 80% in stream flows in various subbasins of the Indus Basin Any change in temperature or snow-fall or snow-/glacier-melt will cause significant ramification on downstream water resources Land sliding and floods may affect existing and ongoing projects, such as Pak-China economic corridor Historic civilization in the northern Indus basin under threat due to floods, and proposed reservoirs There are more than 1800 glacial lakes, of which >50 are potentially dangerous (Campbell, 2005) However Available studies cannot be used for precise and accurate policy making and sustainable water-energy-food supply and production, due to:

30 Uncertainty in existing studies
31 Uncertainty in existing studies

32 Constraints: FAO water scarcity results are questionable?

33 Constraints: ISI-MIP results are questionable?

34 Uncertainty in existing studies

 Astore")
35 Constraints: variability in flow components Hunza basin (Karakoram) Astore basin (Himalayas)

36 Uncertainty in existing data Source: Palazzi et al. (2013)
37 Needs and Objectives Therefore, there is intense need to study hydro-climatology of the Indus Basin, and to precisely and accurately plan energy-water-land use to cater for future demands under changing climate Potential Objectives To rectify basin boundaries, To identify best available input datasets for hydrological modelling in the Indus basin, To provide best estimates for various flow components in various sub-basins, To project future changes in water resources, and its implications on energy and agriculture, To identify most vulnerable districts (for floods) in Pakistan, and to provide precise flood mitigation/resilience plans,
38 Needs and Objectives To identify GLOFs vulnerable projects, civilization and population, To predict socio-economic growth and to evaluate and predict expected changes in living standards, urbanization, food intake habits, industrialization and environmental impact To provide climate change adaptation plan, and best agricultural practices under various scenarios
39 The Nexus Challenge Underlying socioeconomic trends Increasing resource demands Solutions for human welfare Avoiding Environmental Degradation Population growth Water Clean Water Aquatic Ecosystems Rising middle class Energy Reliable Energy Climate Change Urbanization Land Food, Feed, and Fiber Terrestrial Ecosystems


40 Water Regional priorities and response options Facilitate data collection Translation of insights to action Increase visibility and utility of Multi-dimensional tools IIASA YSSP and Post-doc Dynamic Regional research groups Solution-specific Stakeholder meetings Local solution portfolios Nexus Decision Framework Modular design Full sectorial representation Consistent platform Nexus Integration-ready Solutions Scalable and transferable Land Energy Stakeholder-informed Place-specific solutions Investment and policy strategies Robust decision-making Elucidate uncertainty Sustainable scenarios

41 Nexus approach
42 IIASA GEF Project Exemplary regional case studies Indus (Asia) Area: km 2 Countries: Pakistan, India, China, Afghanistan Population: Mio. people Projection 2050 (SSP1-5): Mio. people Main land cover: [%] Cropland: 30 Irrigated cropland: 24 Forest: 0.4 GDP per cap. [US$]: 700 (Afghanistan) (China) Main challenges: Climate Change glacier melting flood & drought risk Water security water scarcity agricultural pollution Energy security potential of hydropower energy access Food security irrigation groundwater exploitation Socioeconomic population growth urbanization economic growth Ecosystems loss of biodiversity Zambezi (Africa) Area: km 2 Countries: Zambia, Angola, Zimbabwe, Mozambique, Malawi, Tanzania, Botswana, Namibia Population: 38 Mio. people Projection 2050 (SSP1-5): Mio. people Main land cover: [%] Cropland: 20 Irrigated cropland: 0.1 Forest: 4 GDP per cap. [US$]: 300 (Burundi) (Angola) Main challenges: Climate Change flood & drought risk Water security water infrastructure water scarcity urban, industrial pollution Energy security potential of hydropower energy access Food security potential of irrigation soil degradation Socioeconomic population growth urbanization economic growth Ecosystems loss of biodiversity

43 Animation source:


44 Any Animation source:
45 Back Up Slides
46 Data availability: WAPDA and CWC PMD and IMD AEDB PCRET Soil Survey of Pakistan and India FAO, GLC Landcover Pakistan Forest Institute Bureau of statistics in Pakistan and India
47 Main Stakeholders: Ministries and Government Ministry of water and power Ministry of Climate Change Ministry of Agriculture and Food Ministry of Culture and Heritage Ministry of Planning and Development Ministry of Science and Technology Donors/Sponsoring Agencies World Bank ADB UN: UNDP, UNEP, FAO USAID IIASA ICIMOD IWMI JICA

48 Solar potential in Pakistan