Vulnerability to Drought in Europe
|
|
|
- Bruce Hunter
- 5 years ago
- Views:
Transcription
1 11 de Waterforum: Waterschaarste en droogte, de nieuwe realiteit Friday, 26 September 2014 Vulnerability to Drought in Europe Wouter Vanneuville project manager Water & Vulnerability, EEA

2 The EEA eea.europa.eu is An independent EU agency Analysing, assessing and providing information An interface between science and policy Dependent upon strong networks to carry out its work Is not Formulating or proposing new legislation An executive body implementing environmental measures A funding body We are about 200 EEA staff members including national experts

3 EEA Mission statement The European Environment Agency aims to support sustainable development and to help achieve significant and measurable improvement in Europe s environment through the provision of timely, targeted, relevant and reliable information to policy-makers, public institutions and the public.


4 Water quality is mostly improving Concentration levels of many water pollutants are falling Concentrations of pollutants in water , source: EEA

5 But what about water quantity?


6 Global demand for water Charting our water future, 2009, 2030 Water Resource Group


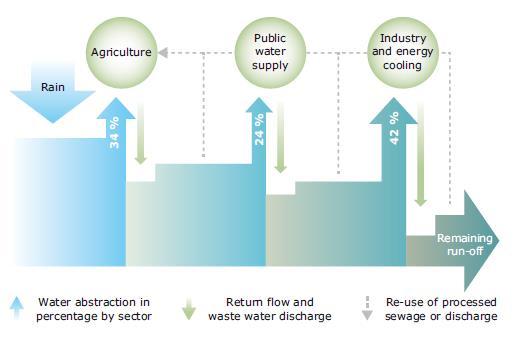
7 EEA reports support the Commission s Blueprint Status assessment Water efficiency Synthesis on water policies Water vulnerability

8 Drought is natural Many ecosystems have developed in harmony with seasonal drought

9 Droughts are not only Mediterranean 37% of EU territory and +/- 20% of EU population affected by severe drought over last 25 years Main drought events in Europe, source: EEA

10 Occurrence of droughts and water scarcity in RBMPs Note: 'Other' also includes the cases where there is no clear information about these issues in the RBMPs. Schmidt and Benítez, 2012.

 Based on")

11 Mapping of drought conditions for Europe European Drought Observatory (JRC) Based on SPI, soil moisture and vegetation productivity anomaly

12 Land use change makes drought worse Land use change is primarily caused by economic development and urbanisation
13 Land use change makes drought worse Land use change is primarily caused by economic development and urbanisation Predominant net land conversions in Europe ( ) Based on Corine Land Cover Analysis, source: EEA


14 Water abstraction and return flows Environmental indicator report 2012, EEA


15 Over-abstraction increases water scarcity Agriculture accounts for 33 % of fresh water use in Europe. In some regions of southern Europe, it uses up 80 % of all available freshwater. Low prices for agricultural water amount to a subsidy for overabstraction

16 The additional pressure of climate change

17 Overcoming water vulnerability Agricultural practices can be modified to conserve water Green infrastructure and Natural Water Retention Measures must be encouraged

18 Technology & infrastructure play a role Technology in the home can save water. Drip-irrigation systems are more efficient than conventional irrigation.

19 But efficiency is not enough. We must beware of the danger of the rebound effect, which can negate gains in efficiency Economic instruments such as taxes and subsidies are a vital addition to regulation and legislation

20 Water use within sustainable boundaries Transport Agriculture Energy Public supply Industries Leisure Modified after S. Postel / Natural Resources Forum 27 (2003); Towards efficient use of water resources in Europe, 2012


21 Water accounts are essential exchange of information
22 Water exploitation index Cyprus Malta Italy Belgium Spain Germany Romania Poland France Turkey Czech Republic Lithuania Greece Netherlands Portugal Bulgaria United Kingdom Hungary Switzerland Denmark Austria Luxembourg Finland Slovenia Serbia Ireland Slovakia Sweden Latvia Croatia Iceland WEI EUROSTAT Water Exploitation Index National, yearly averaged values LTAA
")
23 WEI towards a regionalised approach RBDs instead of administrative (national) boundaries

24 The EEA water accounting methodology The EEA is working on a methodology for water accounts in partnership with the Commission and Member States. European overview Comparable methodologies to compare results
25 The EEA water accounting methodology River Basin Districts as units for visualisation, sub-catchments for calculations Monthly data for evolution within a year
.")
26 The need for local and regional water balances Compiled by the ETC/ICM based on data provided in the Drought and Water Scarcity Management Plan of GR07 (Hellenic Ministry of Environment, Energy and Climate Change and NAMA S.A., 2012).

27 The need for local and regional water balances
28 Thank you! Wouter Vanneuville