Food Security Sector Working Group Meeting. MoA Bir Hassan 13/06/2017
|
|
|
- Mae Gardner
- 5 years ago
- Views:
Transcription

1 Food Security Sector Working Group Meeting MoA Bir Hassan 13/06/2017

2 Agenda 1. Regional Food Security Analysis Network presentation 2. WFP Food Security Outcomes Monitoring FSOM April report presentation 3. Presentation of WFP Initiative for Ramadan Share the meal 4. Ramadan distributions overview 5. Feedback from the first sub-technical group meeting on agriculture education 6. AOB: Inter-agency Contingency Planning and M&E framework
3 Regional Food Security Analysis Network

4 The Regional Food Security Analysis Network 13 June 2017
 of")
 and is funded by USAID Food for")
5 The Regional Food Security Analysis Network (RFSAN) is a partnership between the Food and Agriculture Organization (FAO) of the United Nations (UN) and immap (an International Non- Governmental Organisation (NGO) and is funded by USAID Food for Peace (FFP) and FAO.

6 RFSAN: Purpose, Mission and Vision Purpose: Lack of technical capacity to produce accurate and timely food security information needed to aid humanitarian and development interventions. Gaziantep-Syria Iraq Mission: Improve the quality of food security information to support better decision-making in humanitarian and development interventions in the sub-region affected by the Syria and Iraq crisis. Lebanon Jordan.
7 How we achieve our mission? Provide timely and evidence-based food security and livelihood information and analysis, with a focus on vulnerable population groups; Identify programming needs of the affected population that can be used as strong evidence for the design of livelihoods support programmes; Provide technical support in areas such as survey design, sampling techniques and information management (data collection, data management, analysis and dissemination); Reinforce existing coordination structures such as the global Food Security (FS) Sector/Cluster system and provide technical support to implementing partners. Expand the capabilities of partners engaged in food security and livelihood analysis and programming through institutional support and individual training; Raise awareness on the food security situation and information needs.


8 RFSAN Products (Situation analysis, Early Warning and Needs) Food Security and Livelihoods Assessment reports and brochures; Quarterly Food Security Updates for Syria and Iraq; Situation updates in hot spots, with a focus on Food Security; Agrometeorological Bulletins to monitor progress of the agricultural growing season (rainfall, and FAO s Agricultural Stress Index (ASI); Southern Syria Bakery Assessment (ongoing); Market analysis and agricultural commodity value chain analysis; Price Monitoring data collation and harmonization reports and maps; Information baseline on climate, soils, agriculture, water resources; Detailed Town maps for responding partners
9 Support to the Food Security Sector Other Activities in the Sub-Region Inputs to the Humanitarian Programme Cycle in Iraq, Jordan, Lebanon and Syria: Humanitarian Needs Overview (HNO), Mid-year review and Humanitarian Response Plans (HRP) and Regional Refugee and Resilience Plan (3RP) Support Food Security Cluster Secretariats (Syria/ Iraq hubs): Assist FAO in providing co-coordinators (Lebanon and Jordan); Chairing Technical Working Groups (Agriculture Gaziantep and Amman - IM) Capacity Development Capacity assessments & multi-stakeholder workshops, FSIS priorities in Iraq, Jordan and Lebanon. Training 240 participants from various NGOs, government institutions, and UN agencies Training curriculum (introduction) : Food Security Concepts and indicators Geographic Information Systems and Data Visualization
10 Summary of RFSAN s Activities in Lebanon ( ) 2015: Food Security and Livelihoods Assessment of Lebanese Host Communities (done in collaboration with FAO, MoA and REACH) : Funding of the Food Security Cluster Co-coordinator position for Lebanon. Main achievements: o Inputs to Regional Refugee and Resilience Plan (3RP) document and Lebanon Crisis Response Plan (LCRP) o Training of FSS partners in the field on introduction to food security and FS indicators and decent work in agriculture targeting FS sector and child protection working partners 2016: Capacity Assessment of national stakeholders involved in Food Security Information Systems (government, UN, NGOs) covering various sub-sectors including (crops, livestock, market, nutrition, socio-economic, agrometeorology : Training Course on Introduction to Food Security Concepts and Indicators, Data Visualization and GIS (Beirut, Bekaa and Akkar) with participation from a total of 25 different agencies, including Government institutions, UN agencies and NGOs
11 Way forward Support FAO-Lebanon in the recruitment of the new food security sector (FSS) cocoordinator Identify potential areas of research/ studies in Lebanon (based on FSS partner needs) that RFSAN could support till the end of this year : o e.g. FSLA 2017: to update information that was collected on the FS and livelihoods situation of Lebanese host communities and focus on all Lebanese households regardless of their livelihoods source o Child labour in agriculture Bekaa: the study is joint with ILO and UNICEF and implemented by AUB. o Dairy sector value chain
12 WFP Food Security Outcomes Monitoring (FSOM) April
13 FSOM: Introduction HH survey conducted to measure the outcome results of food assistance between beneficiaries and non-beneficiaries over time and the impacts of cuts in assistance (if they happen) Includes sections on: - General demographics -Food security - Monthly HH expenditure patterns - protection and safety - Intra-household dynamics - Other assistance
14 Methodology - 6 TH round of FSOM conducted in April A representative sample Random sampling approach for assisted and non-assisted households. Data is collected at the households level on a quarterly basis Total of 575 HH 325 assisted HH 250 nonassisted HH
15 RESULTS

16 Food consumption trends for assisted households Food consumption for assisted households improved significantly in 2016 and remained stable until April 2017 with 64 percent of households having an acceptable food consumption. The percentage of households with poor food consumption reached the lowest level (4 percent) since the beginning of the FSOM

17 Food Consumption Score WFP assisted households showed better food security indicators compared to non assisted households
18 Reduced Coping Strategy Index Assisted households adopted less coping strategies than non-assisted ones. Compared to April 2016 assisted households are adopting less food related coping strategies while for non-assisted households the rcsi rose to 16.6 points during the past 3 months.
19 Adopted livelihood coping strategies The most common coping strategies adopted by households remained unchanged compared to previous FSOM

20 Expenditure and Income On average, the total household expenditure for assisted and nonassisted households decreased compared to January Households with acceptable food consumption spent on average USD 274 more per month to cover for all expenses than households with poor food consumption. Assisted households decreased their debts in April 2017 reaching on average of USD 857 per household

21 Perception of food security as compared to last year More than half of the interviewed displaced Syrians perceived that food security among their community improved compared to last year, around 32 percent considered that it remained the same and 13 percent thought it had worsened


22 Satisfaction and protection Overall satisfaction about WFP assistance continued to increase. The satisfaction on how assistance was provided reached the highest value since January 2016 showing programme quality improvements in addressing beneficiaries needs. The WFP operating environment remains safe for those receiving food assistance with only two incidents reported in April 2017.
23 Thank you
24 WFP Initiative Share the meal -Ramadan
25 ShareTheMeal The first app against global hunger 13 June 2017
26 Hunger & smartphones Smartphones (billion) 2013 Underweight children (billion)


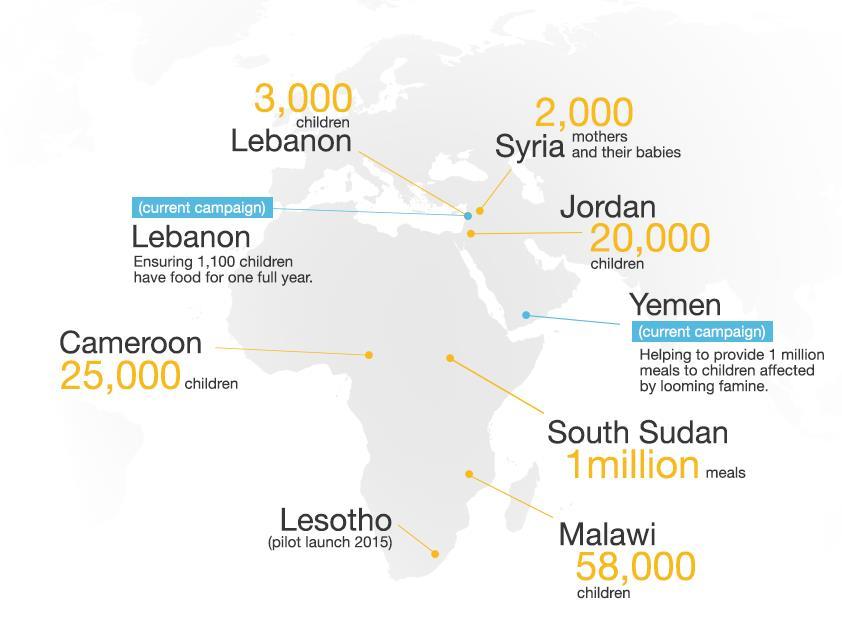
27 Tap to share the meal US$ 0.50 feed 1 child for 1 day United Nations World Food Programme distributes the food We show you where the children are and what our progress is
28

29
30 World Food Programme
31 Ramadan distributions overview
 1,000 1,000 DAF 1,000 1,000 North")
32 Governorate Partners HHs Food Parcel Food Voucher Hot meal Grand Total DAF 4,422 4,422 Akkar Mercy-USA 4,200 4,200 The Coalition of Charity Associations for Syrian Refugees Relief 1,650 10,000 11,650 Baalbek-El Hermel CCP JAPAN Bekaa ISWA 20,055 20,055 El Nabatieh ISWA 3,000 2,250 5,250 Mount Lebanon ISWA 2,690 4,710 7,400 Secours Islamique France (SIF) 1,000 1,000 DAF 1,000 1,000 North Mercy-USA The Coalition of Charity Associations for Syrian Refugees Relief 10,000 10,000 South ISWA 17,125 29,602 46,727 Grand Total 55,036 1,000 57, ,400 6 organizations reported 7 governorates covered 113,000 HHs to received assistance Assistance provided to both Displaced Syrians and vulnerable Lebanese
33 Agro-TVET Sub technical meeting (agriculture and food related education activities
34 30% of the activity info indicators in the Food Security sector is about training
35 Strengths (why do you think training is important) : Respond to donor demand Allow Syrian youth to participate in training Introduce best agriculture practices Create income generating activity by acquiring the skills Employment creation and economic empowerment Better livelihood through better income opportunity Responding to rural demand Increasing food production Contributing to the 4 pillars of food security Increase sustainability of agricultural sector Improving quality of production through improved practices and thereby increasing export Create link with the private sector
36 Weaknesses (difficulties encountered): Certification of the training and different line ministries involvement. Might not respond to the need of people or to the sector Lack of trainers/specializations Lack of involvement of the private sector throughout the process Lacking life skills training including entrepreneurship skills among the training activities Quality of the training Qualifications of organizations providing the training Demotivation of the youth to the agricultural sector as it is linked with poverty Sustainability of training activities Short project duration Low capacity of the training facilities
37 Opportunities: Growing donor interest Synergies among actors MOA is showing interest in TVET Introduction of knowledge from foreign countries( e.g. twining programs) Training private sector including farmers towards changing negative behaviors Targeting the most vulnerable/marginalized population
38 Threats: Offer might exceed the demand for training Lack of demand studies in the agricultural business Market saturation Lack of coordination between actors providing training Lack of quality training Need for M&E and impact assessment Results of training not achieved because of no follow up or coaching Lack of overall policy strategy within the MOA
39 Name of organization: Mohafazat: CAZA: VILLAGE: Type of education vocational extension age group Duration Month of the year 2017 Formal: BT, TS, BP, LT Non Formal: accelerate learning Relations with the agriculture TVET schools (e.g. using premises, recruiting teacher, etc.) Comments: YES / NO
40 Entities reported doing Agro-Food Agriculture food processing postharvest food safety and quality SCI X IRC X AL-Majmouaa X X DRC X LEDA X X UNDP X ILO X X AVSI X X LOST X UNIDO X X X Mercy Corps X X ACTED X X YMCA X Mouawad foundation X X X NEF X WARD X PARCIC X
41 AOB Inter-agency Contingency Planning M&E framework GBV roll out
42 Thank you