Title: Land-Use Change Affects Water Recycling in Brazil s Last Agricultural Frontier
|
|
|
- Griselda Richard
- 5 years ago
- Views:
Transcription
1 Received Date : 07-Oct-2015 Accepted Date : 29-Feb-2016 Article type : Primary Research Articles Title: Land-Use Change Affects Water Recycling in Brazil s Last Agricultural Frontier Running Head: Land-Use Change and ET in Brazil Authors: Stephanie A. Spera 1,2, Gillian L. Galford 3, Michael T. Coe 4, Marcia N. Macedo 4, John F. Mustard 1,2 Affiliations: 1 Department of Earth, Environmental, and Planetary Sciences, 324 Brook Street, Brown University, Providence, RI Institute at Brown for Environment and Society, 85 Waterman Street, Brown University, Providence, RI Gund Institute for Ecological Economics, Rubenstein School of Environmental and Natural Resources, 617 Main Street, University of Vermont, Burlington, VT Woods Hole Research Center, 149 Woods Hole Road, Falmouth, MA Corresponding Author: Stephanie A. Spera Department of Earth, Environmental, and Planetary Sciences, Brown University This article has been accepted for publication and undergone full peer review but has not been through the copyediting, typesetting, pagination and proofreading process, which may lead to differences between this version and the Version of Record. Please cite this article as doi: /gcb.13298
2 Providence, RI , Keywords: Cerrado, evapotranspiration, land-use change, deforestation, Matopiba, agriculture, remote sensing ABSTRACT Historically, conservation-oriented research and policy in Brazil have focused on Amazon deforestation, but a majority of Brazil s deforestation and agricultural expansion has occurred in the neighboring Cerrado biome, a biodiversity hotspot comprised of dry forests, woodland savannas, and grasslands. Resilience of rainfed agriculture in both biomes likely depends on water recycling in undisturbed Cerrado vegetation; yet little is known about how changes in land-use and land-cover affect regional climate feedbacks in the Cerrado. We used remote sensing techniques to map landuse change across the Cerrado from During this period, cropland agriculture more than doubled in area from 1.2 to 2.5 million ha, with 74% of new croplands sourced from previously intact Cerrado vegetation. We find that these changes have decreased the amount of water recycled to the atmosphere via evapotranspiration (ET) each year. In 2013 alone, cropland areas recycled 14 km 3 less (-3%) water than if the land cover had been native Cerrado vegetation. ET from singlecropping systems (e.g., soybeans) is less than from natural vegetation in all years, except in the months of January and February, the height of the growing season. In double-cropping systems (e.g., soybeans followed by corn), ET is similar to or greater than natural vegetation throughout a majority of the wet season (December May). As intensification and extensification of agricultural production continue in the region, the impacts on the water cycle and opportunities for mitigation warrant consideration. For example, if an environmental goal is to minimize impacts on the water
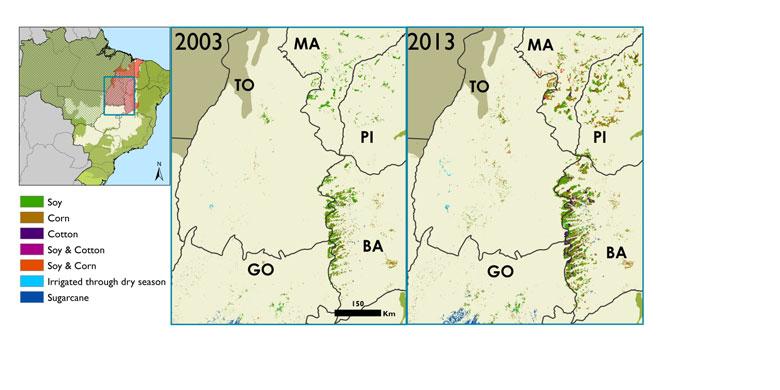
3 cycle, double-cropping (intensification) might be emphasized over extensification to maintain a landscape that behaves more akin to the natural system. INTRODUCTION Over the past four decades, the Cerrado has undergone a transition from a sparsely inhabited region with native dry forests, shrublands, and grasslands to an agricultural powerhouse. Increased deforestation governance in the Brazilian Amazon s tropical forest and land scarcity in older frontier regions have led both farmers, states, and the federal government to seek out new areas for development (Branstromm et al. 2008, Barretto et al. 2013, MAPA 2015a, Embrapa 2016). The northeast Cerrado has been developing as an agricultural frontier since the early 2000s, and on May 6, 2015, Brazilian Decree no officially committed government support to developing the Matopiba region. Matopiba, Brazil s newest and potentially final agricultural frontier, is so named because its 337 municipalities span the states of Maranhão (MA), Tocantins (TO), southern Piauí (PI), and western Bahia (BA). Over 90% of Matopiba lies within the Cerrado biome, and the states of Tocantins and Maranhão also reside within Brazil s Legal Amazon, a political designation of the Amazon watershed (Fig. 1). Unlike most of the Cerrado, Matopiba does not have a history of large-scale cattle ranching. As a result, cropland expansion in Matopiba is advancing primarily through clearing native vegetation rather than by using previously cleared pasturelands. Compared to the better-known Amazon, the Cerrado has less stringent environmental regulations that govern forested areas on private properties. The Brazilian Forest Code specifies conservation regulations according to vegetation types and location within legal boundaries. Landowners in the Amazon biome must set aside 80% of their property as a forested legal reserve. Landowners in the Cerrado biome, however, must set aside a minimum of only 20% of their property as a legal reserve, unless their
4 property falls within the Legal Amazon (Fig. 1), where the required legal reserve increases to 35%. Moreover, only 3% of the biome is legally sheltered by strictly protected areas (Françoso et al. 2015). Of the Cerrado s native vegetation, 40-55% has already been cleared (Klink & Machado 2005, Sano et al. 2010). Nearly half of Brazil s agro-pastoral land is cultivated in the Cerrado (IBGE 2015) with high rates of clearing in recent years, mostly in Matopiba (Fig. 2) (LAPIG 2015). As Cerrado vegetation is cleared, fragmented, and replaced with croplands, the water balance is modified as water leaves the system through runoff and ground water rather than being recycled as evapotranspiration (ET). The Cerrado is characterized by distinct wet and dry seasons; nearly 90% of mean annual precipitation falls between October and April (Klink and Machado, 2005). Air masses moving westward over the Cerrado transport evapotranspired water over the Amazon Basin, where it contributes to rainfall (Spracklen et al. 2012). Large-scale deforestation of the Cerrado has the potential to reduce the amount of rainwater that reaches the Amazon (Malhado et al. 2011). Models suggest that deforestation of the Amazon and Cerrado may increase Cerrado dry season length by up to a month (Costa & Pires 2010, Yin et al. 2014). Moreover, climate modeling experiments have shown that preserving remnant Cerrado is essential to climate stability in this region and in the Amazon downwind (Biggs et al. 2006, Malhado et al, 2010, Pires & Costa 2013, Coe et al. 2013). Feedbacks between land-cover changes and climate have the potential to reduce precipitation, increase precipitation variability, and ultimately threaten the sustainability of agricultural production in both the Cerrado and the Amazon (Nobre et al. 1991, Wang et al. 2008, Malhado et al. 2010, Butt et al. 2011, Spraklen et al. 2012, Lee et al. 2012, Oliveira et al. 2013, Knox et al. 2015). Given the importance of land-cover changes to regional rainfall and future agricultural production, there is a need for accurate information about the spatial distribution of agropastoral lands, historic land-use transitions, and the different pools of land potentially available for further
5 expansion and intensification (Lambin et al. 2000). In this study, we use remotely sensed datasets to map annual land-use and land-cover changes across the Cerrado from Our results include the first documentation of the spatiotemporal distribution of row-crop agriculture across the Cerrado, including soy, corn, cotton, and sugarcane. We determine the impacts of agricultural conversion in Matopiba on regional ET, including the impacts of crop management choices, and discuss policy implications. MATERIALS AND METHODS Mapping Land-cover Change Baseline Cerrado land cover was defined by the 2002 Project for the Conservation and Sustainable Use of Brazilian Biological Diversity (PROBIO) (MMA 2007; Sano et al. 2010), derived from 30 m resolution Landsat data. Its 15 land cover categories were condensed into five: Cerrado, pasture, agriculture, water, and other (urban and mining). We used satellite remote sensing data to map annual land cover across Matopiba. The Moderate Resolution Imaging Spectroradiometer (MODIS) aboard the Terra satellite produces image composites at a high temporal frequency, allowing us to exploit phenological thresholds to discriminate among land covers. All MODIS (MOD13Q1) Enhanced Vegetation Index (EVI), day of year (DOY), and VI Quality 16-day, 250 m resolution data composited between August 2002 and July 2013 were used. We define a growing season as beginning in August and ending in July: the data used to analyze the 2003 growing season span August 1, 2002 July 31, A published decisiontree algorithm (Spera et al. 2014) was modified to incorporate crop cycles and calendars for the states of Tocantins, Goiás, Maranhão, western Bahia, and southern Piauí (MAPA 2015b). The modified Spera et al. (2014) algorithm adds single-cropped corn as a crop class, as it is common in Matopiba. We identified expansion of agriculture and intensification by differentiating among (a) single-
6 cropping (a single rotation of soy, corn, or cotton within one growing season); (b) double-cropping (a soy-corn or soy-cotton rotation within one growing season); and (c) irrigated agriculture. This algorithm uses metrics that include growing season EVI standard deviation, minima and maxima; it derives green-up and harvest dates to differentiate natural vegetation from croplands. Due to the 250 m spatial resolution of the data, we mapped only agricultural fields greater than 25 ha. Because 25 ha is below the average farm size of row crops in the region (Rally da Safra 2015), we consider our cropland estimates to be relatively conservative. We mapped annual croplands across 45 million ha of Matopiba (Fig 1). Although our study region comprises only 65% of the legal Matopiba region, these 45 million ha account for 80% of the planted area of annual crops during our study period and 88% of the planted areas of soy, corn, and cotton in 2013 (IBGE, 2015). The results of our algorithm were validated using 883 validation points collected across the Cerrado over the study period using the Landsat data repository within Google Earth Engine. Compositing false-color Landsat 5 and 7 images (NIR Band 4 as red, SWIR1 Band 5 as green, red Band 3 as blue) from the growing season permitted visual identification and separation of corn, soy, cotton, pasture, and natural vegetation land covers (Spera et al. 2014). Across the study region, annual agriculture was distinguished from natural vegetation and pasture with 95% accuracy (STable 1), and crop types were separated with 87% accuracy (STable 2 and SFig. 2). Because pasture and sugarcane are difficult to separate using the phenological signal from a single growing season, we integrated previously published (spatially explicit) sugarcane data (Canasat: Rudorff et al. 2010) into our land-cover maps. Finally, we used annual spatial data of Cerrado deforestation from the Integrated Deforestation Warning System (SIAD) to determine the total area of natural vegetation cleared in the biome after 2002 (LAPIG 2015). See Supplementary Materials for additional details.
7 Evapotranspiration Analysis The MODIS MOD16A2 data product (Mu et al. 2011) provided estimates of ET. Our analysis relied on the monthly one km resolution ET time series for the period covering August 2001 to July 2013, available from the University of Montana s Numerical Terradynamic Simulation Group ( The MODIS ET data product is an estimate of total plant transpiration, wet canopy evaporation, and soil evaporation derived from application of the Penman-Monteith equation (Mu et al. 2013). The derived product relies on NASA s Global Modeling and Assimilation Office daily meteorological reanalysis data, as well as the MODIS albedo leaf area index (LAI), the fraction of absorbed photosynthetically active radiation (fpar), and land cover datasets (Mu et al. 2013). Comparative analyses were performed using ArcGIS To compare ET over different land covers for each month in each year, we calculated the average ET over areas classified as croplands (by our algorithm) and Cerrado (by the 2002 PROBIO map), excluding areas that were cleared during out study period (as identified by SIAD). We also tested the statistical significance of the relationship between crop management regime and monthly ET. We performed multivariate linear regressions at the degree grid cell resolution. Tropical Rainfall Measuring Mission data (TRMM 3B42 V7) were downloaded from the Goddard Distributed Active Archive Center and resampled to degrees. Climatic Research Unit monthly average temperature data (New et al. 2002), gridded at 0.5 degrees, were downloaded from and then resampled to degrees. We tested and accounted for spatial autocorrelation following the methods of Cohn et al. (2016). Every variable exhibited spatial autocorrelation. Thus we determined the radius of correlation for each variable using semivariograms (SFig 10), and generated a neighborhood variable for each original variable. Monthly ET was regressed against precipitation, temperature, a precipitation-temperature
8 interaction term, the fraction of single-cropping and double-cropping, and the ET, precipitation, temperature, and agriculture neighborhood variables in each degree grid cell. This was done for every month of our study period, using robust standard errors to account for heteroscedasticity. StataCorp s Stata Statistical Software 13 was used to perform these multivariate statistical analyses. To determine the effects of land-use change on the regional water cycle, we estimated ET as if there had been no land-use changes since We compared the MODIS monthly composite ET values (ET LUC ) to hypothetical ET surfaces (ET NOLUC ). To obtain monthly ET NOLUC surfaces, 50,000 points were randomly distributed across the study region using the Create Random Points tool of ArcGIS 10.2 to perform regularized spline interpolation with a weight of 10 and minimum of five neighbors. These 50,000 points were distributed across natural vegetation that had neither been converted to agriculture (as identified by our algorithm) nor cleared (as identified by SIAD). Each was required to be at least one km from any area that had undergone a land-change transition or from another interpolation point. We then interpolated those ET values across a one km raster grid for every month of each year. By using month-year values to create monthly ET NOLUC surfaces, we controlled for interannual variability in weather, thus capturing the changes in ET due to land-use change alone. To calculate the monthly ET due to all land-use change that occurred before August 2002, we subtracted the ET NOLUC surface from the ET LUC surface for each month between August 2001 and July Uncertainty The MODIS data show an increasing trend in ET through the region during our study period, whereas precipitation, temperature, and water storage level exhibited no such trend (SFig11). To rule out the possibility that this increasing trend was an artifact of the derived data product, we
9 performed non-parametric Pettitt tests to determine if a significant change-point existed in the dataset (Pettitt 1980) (See SI). We also analyzed historical streamflow data downloaded from the Brazilian National Water Agency for rivers in our study region. Of the 18 rivers in our study region with daily streamflow data available during our study period, 14 showed decreasing trends in discharge (SFig 13). Decreasing river discharge would be consistent with increasing ET rates assuming no change in precipitation or water storage. Moreover, the eight-day ET data product has been validated using ET estimates from eddy flux towers at 232 watersheds worldwide (Mu et al. 2013). The MODIS land cover input has been cited as the largest source of error (Ruhoff et al. 2013); and the eight-day ET data consistently provide underestimates of ET (Ruhoff et al. 2013). However, the data show good agreement with measured ET when aggregated at monthly time scales (Ruhoff et al. 2013), lending confidence that the monthly MODIS ET data are robust enough for analysis of the ET dynamics from land-use change. To test for the robustness of our interpolated surfaces, we compared the average ET between both surfaces in areas that had not experienced any land-use change over our study period. The resulting interpolated ET fields were in good agreement for locations that had not experienced change. The mean monthly ET of areas that experienced no land-use change in the original dataset was 714 mm. The mean reconstructed ET in areas of no land-use change differed from the original dataset by only mm (less than 1%), with a standard deviation of mm and a maximum difference of 0.24 mm (less than 1%) occurring in September of We have excluded pasturelands from our analysis. Pasturelands are difficult to distinguish from Cerrado vegetation using moderate resolution satellite data because the two land covers exhibit similar phenologies. Moreover, pasture condition (e.g. degree of degradation) varies widely within the study area, which likely affects evapotranspiration. Spatially explicit pasture data that include pasture condition would enable a more detailed analysis.
10 RESULTS Large-scale Land-use Change In 2003, land cover in Matopiba was largely Cerrado (82%); less than 20% was cultivated (12% pasture, 5% cropland), while water, urban, and mining areas comprised 1% of the region. Between 2003 and 2013, aggregate cropland area almost doubled from 1.3 ha to 2.5 million ha (Table 1), and an additional one million ha had been converted and later left fallow or used for other purposes over the decade. During this period, row-crop agriculture was predominantly singlecropped (91%), with 61% of all agricultural land cultivated with single-cropped soybean rotation. Seventy-four percent of the 2.3 million ha converted to cropland during the study period was drawn from indigenous Cerrado vegetation, while the remaining areas were converted from previously cleared pasturelands (SFig 6). Within our study region, Piauí experienced the most rapid rate of expansion: total area in cropland almost quadrupled from 120,000 ha to nearly 450,000 ha. Maranhão s cropland area nearly doubled to 450,000 ha. Tocantins increased its area nearly threefold to 270,000 ha. And in western Bahia, the oldest established agricultural region among the four states, croplands expanded from 820,000 ha to 1.4 million ha. By 2013, nearly 375,000 ha of Matopiba were cultivated with an intensive double-cropping rotation (planting two crops in the same growing season), which represented an increase in this cultivation regime greater than eightfold (Table 1). Less than two percent of the cropland in Matopiba was irrigated and these areas were concentrated in Bahia and Tocantins (Table 1). Evapotranspiration in Matopiba Our analysis of the TRMM rainfall product shows that annual precipitation for the Matopiba region averaged 1460 mm yr -1 during our study period, and ranged from 1000 mm yr 1 in western Bahia and Piauí to 2000 mm yr -1 in western Tocantins (SFig. 7). MODIS ET estimated annual ET
11 rates that ranged from ~570 to ~1025 mm yr -1 and averaged ~790 mm yr -1. These results fall within previously reported ranges of annual Cerrado ET and precipitation (Oliveira et al. 2014). ET over all lands that remained as intact Cerrado vegetation for the entirety of the study period averaged 904 mm yr -1, while ET over single-cropping rotations averaged 661 mm yr -1, and over double-cropping rotations the average was 805 mm yr -1. There was a general annual increase in ET from both Cerrado and row-crop land covers over the period of study (Fig. 3), which agrees with increasing trends over the region previously published (Zeng et al. 2012, Oliveira et al. 2014). During 2003, native vegetation transpired 800 mm of water per unit area, while croplands transpired approximately 510 mm (64% that of Cerrado). By 2013, native Cerrado ET was about 950 mm per unit area, while cropland ET rates were about 83% of that (800 mm). Although ET rates increased over both land covers, the annual increase in ET rate over cropland (38.6 mm yr -1 ) was 11 mm yr -1 greater than that over natural vegetation (27.5 mm yr -1 ) (Fig 3). The percentage difference in average ET between cropland and native Cerrado decreased over time, from -57% in 2003 to -18% in 2013 (Fig. 3). ET differences between cropland and Cerrado were not evenly distributed throughout the year. ET rates over cropland during the dry season (May September) were strongly negative (average ~60% lower than those over natural vegetation), with the biggest difference between these two land covers (-77%) occurring in September (Fig 4a). During the peak growing season in January and February when crops grow vigorously, ET occurred at similar (~100%) or slightly higher rates (~107%) over croplands (Fig. 4a). Consistent with previous research on soy fields in eastern Mato Grosso, our results demonstrate ET rates between row-crop agriculture are greatest (and negative) during the dry season, while there exist minimal differences during the wet season, (Lathuilliere et al. 2012, Oliveira et al. 2014, Panday et al. 2015).
12 Single-cropping and double-cropping rotations also have unique seasonal ET signals. Singlecropping rotations had ET rates similar to that of Cerrado only in January and February. Doublecropping rotations, however, had higher ET rates than single-cropping rotations for all months of the growing season (average 128%), and similar to higher ET rates than natural vegetation from January through May (Fig 4b), as a second crop extends transpiration. The relationships between cropping regime and ET rate are statistically significant across the growing season (Table 2, STables 3-14). Differences in ET between cropland and Cerrado can be quantified volumetrically. Expansion of row-crop agriculture in Matopiba between 2003 and 2013 accounted for a loss of 3 km 3 of water. Comparison of ET LUC and ET NOLUC shows that in 2003, 11 km 3 more water would have been recycled into the atmosphere had no land-use change occurred (SFig. 8). By 2013, this figure increased to 14 km 3 (SFig. 8). The regions converted directly from Cerrado to cropland accounted for a 1.53 km 3 decrease in ET between 2003 and This equates to more than a seventh of the total change in ET due to pre-2003 land-use changes (Fig. 5). DISCUSSION AND CONLCUDING REMARKS Cropland area has expanded rapidly and continues to do so in Matopiba. Between 2003 and 2013, over 2.3 million ha of land were newly cultivated, and a majority were cleared from natural Cerrado. Among other environmental consequences, these large-scale land-cover changes have affected the water balance in the region. Our results indicate significantly different seasonal trends in ET between natural vegetation and row-crop agriculture. We found that cropland ET (regardless of management regime) is similar to or greater during the growing season (January and February) when compared to the Cerrado s vegetation. This is contrary to the result found when ET over soy fields in the southern Amazon
13 was compared to forest vegetation (Panday et al. 2015), and is consistent with the higher LAI and photosynthetic and transpiration rates of native Amazon forests compared to Cerrado land-cover types. Both single- and double-cropping rotations, however, show decreased ET during the dry season and the transition to rainy season when compared to native vegetation. There is little to no rainfall during the dry months, and soil evaporation over fallow cropland is limited. The deep roots of Cerrado vegetation can acquire water below 10 m soil depth and permit continued deep-water access and transpiration throughout the dry season over this land cover (Oliveira et al. 2005, Garcia- Monteil et al., 2008; Costa and Pires 2010). Moreover, changes in the amount of water recycled back to the atmosphere are linearly related to changes in natural land cover (R 2 = 0.81); for every 1,000,000 ha of Cerrado converted to croplands, dry season ET is reduced by 1.7 km 3 (Fig 6). With the present climate, if cultivated area expanded by 2.7 million ha, as projected by the government (MAPA 2015a), we estimate an additional annual reduction of 4.59 km 3 (-13%) of water each year during the three dry season months alone. Modeling exercises have shown that limiting transpiration can lead to increased precipitation variability (Lee et al. 2012), and that less evapotranspiration during the dry season can delay the onset of the rainy season (Costa and Pires 2010, Lee et al. 2012), thus shortening the long, stable wet season needed to double crop. Further, although deforested areas are prone to more active shallow atmospheric convection than intact forests, intact forests have greater overall convective available potential energy, and are the source for deeper clouds and rainfall (Wang et al. 2009). In the Amazon, between 24% and 56% of ET is recycled into precipitation (Elathir & Bras 1994, Costa & Foley 1999). For lack of Cerrado-specific estimates, and assuming the recycling rate is similar, our estimated 14 km 3 decrease in ET due to land-use changes could result in an annual rainfall reduction on the order of 8-16 mm m 2 (-3%) in Matopiba. It should be noted that it remains unclear how the
14 obvious seasonal differences in ET between cropland and Cerrado (-150% during the dry season), compared to the decreasing annual differences in ET over the two land covers (only -18% in 2013) will affect the onset or stability of the rainy season in the region. Coupling the high-resolution annual land-cover data used in this study with climate modeling can provide a better understanding of the physical mechanisms and causal relationships that result in these environmental changes, and presents an avenue for future work. Our results also indicate important interannual differences in land-cover and evapotranspiration dynamics in the Cerrado. The difference in the annual average ET between rowcrop agriculture and natural vegetation decreased over the decade of observation from a difference of 57% (291 mm yr -1 ) between crops and native vegetation in 2003 to a 18% difference (144 mm yr -1 ) in 2013 (Fig. 3). This 39% decrease in ET between crops and native vegetation is in part due to an increase in double-cropping in the region. Double-cropping extends the growing season by three to four months compared to single cropping, and prolongs the period of high ET. If the 455 km 2 of land (3% of total cropland) that was double-cropped in 2003 had remained single-cropped, the difference between cropland and natural vegetation would have increased from -57% to -58% (296 mm yr -1 ). Double-cropping rotations were accountable for a 2% increase in By 2013, doublecropping area had increased to 3723 km 2 (26.5% of total cropland). If these croplands had remained in a single-cropping rotation, the percent difference between cropland and natural vegetation would have increased from 18% to 24% (186 mm yr -1 ). Thus, by 2013, double-cropping rotations reduced the percent difference between cropland and natural vegetation by 25%. Double-cropping, then, accounted for over half of the total decrease in ET differences between cropland and Cerrado between 2003 and If we assume that the remainder of this decreased difference is due to climate variability, these results indicate that management decisions are of the same order of magnitude as natural variability.
15 Our results demonstrate that widespread adoption of double cropping may be a way to minimize the impacts of deforestation on the hydrologic cycle. Again, using the mean annual ET rates as estimates, if the 2.5 million ha of cropland in Matopiba were all double cropped, annual ET over the region would decrease by only 11% compared to native Cerrado (from 22.5 km 3 if all areas were natural Cerrado to 20 km 3 with double cropping), whereas ET would decrease by 26% if all agricultural areas were single-cropped (to 16.5 km 3 ). Embrapa (the Brazilian Agricultural Research Corporation) has already developed a Matopiba-adapted soybean cultivar that matures in only 110 days, thereby helping facilitate the widespread cultivation of two crops (often soy followed by corn) in one growing season. The Cerrado has been the focus of intensive agricultural expansion over the last four decades. This has resulted in extensive land-cover transformations and significant changes to the water cycle. Furthermore, only 7% of the Cerrado is legally protected and there are at least 40 million hectares of land available for legal deforestation (Soares-Filho et al. 2014), making continued exploitation of this region, rather than the much more protected Amazon, likely in the coming decades. Understanding how land-use changes affect the regional water balance and how management strategies such as intensification may mitigate some of those changes could prove crucial in developing policies that ensure sustainable agricultural development. ACKNOWLEDGEMENTS We thank Dr. Leah VanWey and William C. Daniels for their helpful comments. This work was funded by the NASA Land-Cover / Land-Use Change Program grants no. NNX11AH91G and NNX11AE56G, NASA Terrestrial Ecology grant no. NNX12AK11G, and the Gordon and Betty Moore Foundation.
16 REFERENCES Biggs TW, Dunne T, Muroaka, T (2006) Transport of water, solutes, and nutrients from a pasture hillslope, southwestern Brazilian Amazon. Hydrological Processes, 20, Branstromm C, et al. (2008) Land change in the Brazilian Savanna (Cerrado), : Comparative analysis and implications for land-use. Land Use Policy, 25, Butt N, De Oliveira PA, Costa MH (2011) Evidence that deforestation affects the onset of the rainy season in Rondonia, Brazil. Journal of Geophysical Research: Atmospheres, 116, D11. Coe MT, Costa MH, Soares-Filho BS (2009) The influence of historical and potential future deforestation on the stream flow of the Amazon River Land surface processes and atmospheric feedbacks. Journal of Hydrology, 369, Coe MT, Latrubesse EM, Ferreira ME, Amsler ML (2011) The effects of deforestation and climate variability on the streamflow of the Araguaia River, Brazil. Biogeochemistry, 105, Coe MT, et al. (2013) Deforestation and climate feedbacks threaten the ecological integrity of south southeastern Amazonia. Philosophical Transactions of the Royal Society of London B: Biological Sciences, 368, Cohn A, Gil JDB, Toledo C, Berger T (minor revisions requested) Patterns and processes of pasture to crop conversion in Brazil: Evidence from Mato Grosso State. Land Use Policy. Costa MH, Foley JA (1999) Trends in the hydrologic cycle of the Amazon Basin. Journal of Geophysical Research, 104, Costa MH, Botta A, Cardille JA (2003) Effects of large-scale changes in land cover on the discharge of the Tocantins River, Southeastern Amazonia. Journal of Hydrology, 283, Costa MH, Pires GF (2010) Effects of Amazon and Central Brazil deforestation scenarios on the duration of the dry season in the arc of deforestation. International Journal of Climatology, 30,
17 Davidson E.A. et al. (2012) The Amazon Basin in Transition. Nature, 481, Dias LCP, Macedo MN, Costa MT, Coe MT, Neill C (2015) Effects of land cover change on evapotranspiration and streamflow of small catchment in Upper Xingu River Basin, Central Brazil. Journal of Hydrology: Regional Studies 4, Part B, Eltahir E a. B, Bras RL (1994) Precipitation recycling in the Amazon basin. Quarterly Journal of the Royal Meteorological Soceity, 120, Embrapa (Brazilian Agricultural Research Corporation) (2015) MATOPIBA: Delimitacao, Caracterizacao, Desafios e Oportunidades para o Desenvolvimento BAHIA Embrapa (Brazilian Agricultural Research Corporation) (2016) Matopiba Françoso RD, et al. (2015) Habitat loss and the effectiveness of protected areas in the Cerrado Biodiversity Hotspot. Natureza & Conservação, 13, Garcia-Montiel, DC, et al. (2008) Estimating seasonal changes in volumetric soil water content at landscape scales in a savanna ecosystem using two-dimensional resistivity profiling. Earth Interactions, 12, Hayhoe SJ, et al. (2011) Conversion to soy on the Amazonian agricultural frontier increases streamflow without affecting stormflow dynamics. Global Change Biology, 17, Hecht SB (2005) Soybeans, Development and Conservation on the Amazon Frontier. Development and Change, 36, Hoffmann WA, Jackson RB (2000) Vegetation Climate Feedbacks in the Conversion of Tropical Savanna to Grassland. Journal of Climate 13, IBGE (Brazilian Institute of Geography and Statistics) (2015) Area Plantada/Colhida,
18 Klink CA, Machado RB (2005) Conservation of the Brazilian Cerrado. Conservation Biology, 19, Lambin E., Rounsevell MD., Geist H. (2000) Are agricultural land-use models able to predict changes in land-use intensity? Agriculture, Ecosystems & Environment, 82, LAPIG (Laboratóorio de Processamento de Imagens e Geoprocessamento) (2015) SIAD-Cerrado. Lathuillière MJ, Johnson MS, Donner SD (2012) Water use by terrestrial ecosystems: temporal variability in rainforest and agricultural contributions to evapotranspiration in Mato Grosso, Brazil. Environmental Research Letters, 2, Lee J.E., et al. (2012) Reduction of tropical land region precipitation variability via transpiration. Geophysical Research Letters, 39, L MAPA (Ministério da Agricultura, Pecuária e Abastecimento) (2015a) Projeções do Agronegócio: Brasil 2014/15 a 2024/25 Projeçoes de Longo Prazo. MAPA (Ministério da Agricultura, Pecuária e Abastecimento) (2015b) Calendario de Plantio Malhado ACM, Pires GF, Costa MH (2010) Cerrado Conservation is Essential to Protect the Amazon Rainforest. AMBIO, 39, MMA (Minesterio do Meio Ambiente) (2007) Projecto de Conservacao e Utilizacao Sustenavel da Diversidade Biologica Mu Q, Zhao M, Running S (2011) Improvements to a MODIS global terrestrial evapotranspiration algorithm. Remote Sensing of Environment, 2011, Mu Q, Zhao M, Running S (2013) Algorithm Theoretical Basis Document: MODIS Terrestrial Evapotranspiration (ET) Product (NASA MOD16A2/A3) Collection 5. Nasa Headquarters. New M, Lister D, Hulme M, Makin I (2002) A high-resolution data set of surface climate over global land areas. Climate Research, 21, 1-25.
19 Nobre CA, Sellers PJ, Shukla J (1991) Amazonia deforestation and regional climate Change. Journal of Climate, 4, Oliveira RS, Bezerra L, Davidson EA, Pinto F, Klink CA, Nepstad DC, Moreira A (2005) Deep root function in soil water dynamics in cerrado savannas of central Brazil. Functionary Ecology, 19, , Oliveira LJC, Costa MH, Soares-Filho BS, Coe MT (2013) Large-scale expansion of agriculture in Amazonia may be a no-win scenario. Environmental Research Letters, 8, Oliveira PTS, et al. (2014) Trends in water balance components across the Brazilian Cerrado. Water Resources Research, 50, Panday PK, Coe MT, Macedo MN, Lefebvre P, Castanho AD de A (2015) Deforestation offsets water balance changes due to climate variability in the Xingu River in eastern Amazonia. Journal of Hydrology, 523, Pires GF, Costa MH (2013) Deforestation causes different subregional effects on the Amazon bioclimatic equilibrium. Geophysical Research Letterrs, 40, Pongratz J, et al. (2006) The Impact of Land Cover Change on Surface Energy and Water Balance in Mato Grosso, Brazil. Earth Interactions, 10, Rally da Safra (2015) Resultados Rally da Safra Richards P (2015) Richards P, Pellegrina H, VanWey L, Spera S (2015) Soybean Development: The Impact of a Decade of Agricultural Change on Urban and Economic Growth in Mato Grosso, Brazil. PLoS ONE, 10, e Rudorff, B. F. T., et al. (2010) Studies on the Rapid Expansion of Sugarcane for Ethanol Production in Sao Paulo State (Brazil) Using Landsat Data. Remote Sensing; 2,
20 Ruhoff AL, Paz AR, Aragao LEOC, Mu Q, Malhi Y, Collischonn W, Rocha HR, Running W (2013) Assessment of the MODIS global evapotranspiration algorithm using eddy covariance measurements and hydrological modeling in the Rio Grande basin. Hydrological Sciences Journal, 58, Sano EE, Rosa R, Brito JLS, Ferreira LG (2010) Land cover mapping of the tropical savanna region in Brazil. Environmental Monitoring Assessement, 166, Soares-Filho B.S. et al. (2006) Modeling Conservation in the Amazon Basin. Nature 440, Spera SA, et al. (2014) Recent cropping frequency, expansion, and abandonment in Mato Grosso, Brazil had selective land characteristics. Environmental Research Letters, 9, Spracklen DV, Arnold SR, Taylor CM (2012) Observations of increased tropical rainfall preceded by air passage over forests. Nature, 489, VanWey LK, Spera S, Sa R de, Mahr D, Mustard JF (2013) Socioeconomic development and agricultural intensification in Mato Grosso. Philosophical Transanctions of the Royal Society B, 368, Wang J, et al. (2009), Impact of deforestation in the Amazon basin on cloud climatology. PNAS 106, Yin D, Roderick ML, Leech G, Sun F, Huang Y (2014) The contribution of reduction in evaporative cooling to higher surface air temperatures during drought. Geophysical Research Letters, 44, 2014GL Zeng Z, et al. (2012) Global evapotranspiration over the past three decades: Estimation based on the water balance equation combined with empirical models. Environmental Research Letters, 7,
21 TABLES Matopiba Total row-crop agriculture (ha) Total row-crop agriculture (ha) 1,284,850 2,534,963 Single Double Single Double Cropping cropping Irrigated Cropping Cropping Irrigated 1,223,984 45,588 15,278 2,126, ,325 36,621 Table 1. Area (ha) of croplands in Matopiba. Aug Sept Oct Nov Dec Jan Feb Mar Apr May June July Single * * * * * + +* * * * Cropping Double +* + + +* +* + Cropping Table 2. Relationships between cropping frequency and monthly ET. Pluses or minuses with asterisks indicate significant (p < 0.05) positive or negative correlations between ET and cropping frequency across all years during the study period. Pluses or minuses without asterisks indicate significant (p < 0.05) positive or negative correlations across most but not all years. Blank cells indicate cases where both negative and positive correlations were observed across the study period. Regression results for all months and all years are presented in the Supplementary Material.


22
23
24
25