Pacific, 4-6 th March , India Bangkok, Thailand
|
|
|
- Janel Wheeler
- 5 years ago
- Views:
Transcription
1 Parallel Event ( 9 th Regional Plastic 3R Consumption Forum per capita in Asia ( ) & the Countries 1. PRC Pacific, 4-6 th March , India Bangkok, Thailand 3. Bangladesh 4. Pakistan 5. Indonesia PRC 6. The Philippines 7. Vietnam 8. Thailand Government Consultation on Draft State of Plastic Waste 9. Sri Lanka 10. Malaysia in Asia and the Pacific 11. Myanmar Issues, Challenges and Circular Economy Opportunities Presented By: Amit Jain Managing Director, IRG Systems South Asia Pvt. Ltd.

2 Draft Report State of Plastics Waste in Asia and the- Pacific - Issues, Challenges and Circular Economic Opportunities
3 Contents 1. Executive Summary 2. Chapter 1 Introduction 3. Chapter 2 - Material Cycle of Plastic 4. Chapter 3 Status of Plastic Waste 5. Chapter 4 Plastic Pollution and its Impact 6. Chapter 5- Major Policy Initiative & Responses 7. Chapter 6 Way Forward
4 Chapter 1: Introduction 1.0: Introduction 1.1: Economic Profile 1.2: Environmental Profile 1.3: Plastic Waste Management 1.4: Relevance of 3R Practices & connectivity to SDGs & Targets 1.5: Scope of the Report
5 Major Drivers(Asia Pacific) Countries 1. PRC 2. India 3. Bangladesh 4. Pakistan 5. Indonesia 6. The PRC 2. Urbanization (Urban Philippines population from 48% of the region s 7. Vietnam 8. Thailand 9. Sri Lanka 10. Malaysia 11. Myanmar Plastic Consumption per capita ( ) 1. Population about 4 billion (2017) to 5.08 billion by 2050 (60% of the world s total population) population in 2017 to 63% of the total by 2050) 3. Economic growth GDP of the major countries in the region was above 25 trillion ranging from US$ 583 to US$ 73,187 per capita. - About two thirds of the regional economies, accounting for 80% of the region s GDP, achieved faster economic growth in Developing Asia-Pacific economies grew by an estimated 5.8% in 2017 (projected to grow by 5.5% by 2019) - Growing purchasing power and the domestic private consumption are the major economic growth drivers
6 Key Take Away Countries 1. PRC 2. India 3. Bangladesh 4. Pakistan 5. Indonesia 6. The PRC (60% of the world s total Philippines population), Urbanization (Urban 7. Vietnam 8. Thailand 9. Sri Lanka 10. Malaysia 11. Myanmar Plastic Consumption per capita ( ) Population about (4 billion (2017) to 5.08 billion by 2050 population from 48% of the region s population in 2017 to 63% of the total by 2050), Economic growth & Growing purchasing power and the domestic private consumption are the major drivers for Plastic Consumption in Asia & the Pacific
7 Chapter 2: Material Cycle of Plastic 2.0: Introduction 2.1: Material Cycle of Plastic 2.3: Material Inputs, Plastic Production, Consumption 2.4: Demographic Change, Material Distribution, Recycling Rates and Technology 2.5: 3R Efforts for Circular Economy & Environmental Implications in Asia and the Pacific


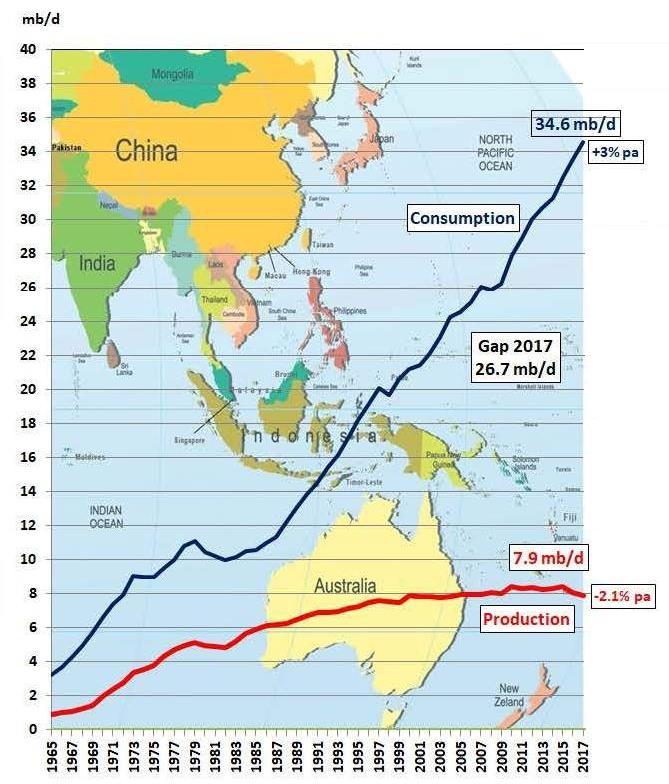
8 Journey of Plastics: Where? How Much? Broad Estimates PRC Countries 1. PRC 2. India 3. Bangladesh 4. Pakistan 5. Indonesia 6. The Philippines 7. Vietnam 8. Thailand 9. Sri Lanka 10. Malaysia 11. Myanmar Rivers 1. Yangtze 2. Ganges 3. Huangpu 4. Brantas 5. Pasig 6. Irrawady 7. Solo 8. Mekong 9. Dong 10. Serayu 11. ZuZhujiang 12. Hajiang 13. Progo
9
10
11 Resource Intensity (Asia Pacific) contd. Plastic Consumption per capita ( ) Countries 1. PRC 1. Material consumption 2. India has increased sharply over the past four 3. Bangladesh decades, accounting 4. for Pakistan more than 50% of world consumption 5. Indonesia while material productivity 6. The has not improved PRC Philippines 2. Materials use (biomass, 7. Vietnam fossil fuels, metal ores and nonmetallic minerals) increased 9. Sri Lanka from 26.3 billion tonnes in Thailand 10. Malaysia to 46.4 billion tonnes11. in Myanmar 2015, an annual growth rate of 6.1%, which is higher than the economic and population growth rates 3. Domestic material consumption per person increased from 2.9 tonnes in 1970 to 11.9 tonnes in 2015, with a high growth rate at 5.2% per annum, and has now surpassed the global average of 11.2 tonnes. 4. Energy generation continues to rely on fossil fuels 5. The region accounts for more than 50% of the world s water use where water intensity is more than double of the world average.
12 Plastic Consumption (kg/capita) kg/capita Trends in Plastic Consumption PRC 1. Plastic consumption ranges from 0.13% to 0.75% of material consumption 2. Importer of fossil fuel, the feedstock for manufacturing plastics 3. Positive correlation exist between GDP growth rate and plastic consumption in the region 4. Increasing trends of plastic consumption (Packaging %) Note: Refer China as PRC Countries PRC 2. India Bangladesh Pakistan 5. Indonesia The 60.0 Philippines 7. Vietnam Thailand 9. Sri Lanka Malaysia Myanmar Plastic Consumption per capita ( ) E 2017 E 2018 E 2019 E 2020 E Plastic Consumption per capita vs income per capita Vietnam China Indonesia India Myanmar Sri Lanka Pakistan The Philippines Bangladesh Year Thailand Malaysia Korea Republic Japan Australia GDP (US $/Capita) Australia China India Indonesia Japan Korea Republic Malaysia Pakistan Thailand Vietnam
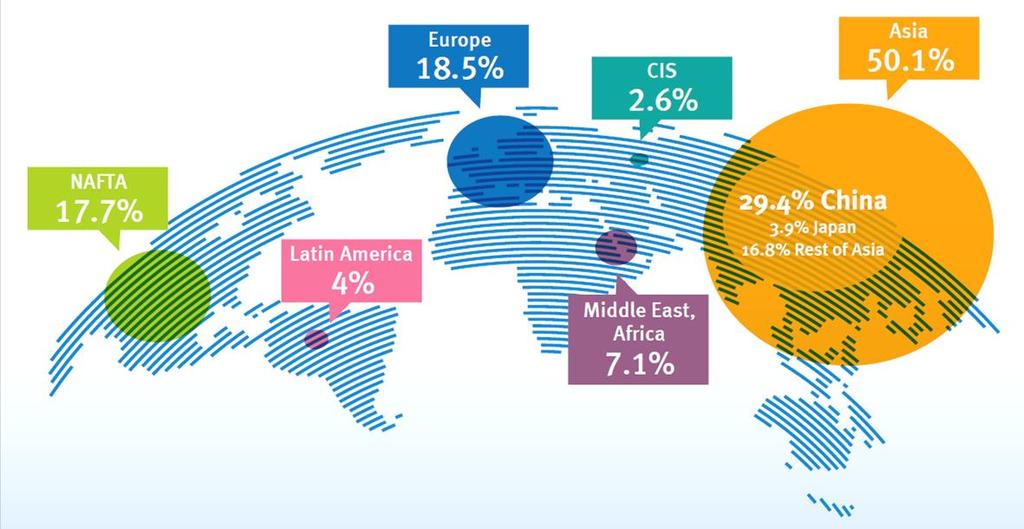
13 Key Take Away Plastic Consumption per capita ( ) Countries 1. Major drivers like population growth, increasing urbanization, 1. PRC 2. India 3. Bangladesh 4. Pakistan 5. Indonesia strong economy & growing purchasing power is leading to higher resource intensity & plastic consumption which is 6. The putting PRC pressure (changes in land use, Emissions & Climate Philippines 7. Vietnam 8. Thailand 9. Sri Lanka 10. Malaysia 11. Myanmar Change) on existing finite natural resource base (material resources, fuel consumption) with major plastic production (50% of the world) happening in China, Japan & rest of Asia. 2. Further, countries in the region with eleven major countries, the major generators of plastics waste with poor recycling rates (< 15 %), lack of waste treatment & disposal infrastructure (open dumping) are putting pressure on climate (open burning GHG emissions) & marine ecosystem in the region. 3. 3R efforts & circular economy offers potential to address the plastic value chain and pressures in the region. 4. Examples of Singapore, China, Japan & India
14 Chapter 3: Status of Plastic Waste 3.0: Introduction 3.1: Plastic Waste in Asia & the Pacific 3.2: Institutional Stakeholders 3.3: 3R Approach & Achievement in Asia & the Pacific 3.4: Implications in Asia & the Pacific Region & Regional Challenges to Achieve 3R Goals
15 Plastic Waste Management (Asia Pacific) Countries 1. PRC 2. India 3. Bangladesh 4. Pakistan 5. Indonesia 6. The Philippines 7. Vietnam 8. Thailand 9. Sri Lanka 10. Malaysia 11. Myanmar Plastic Consumption per capita ( ) 1. (MSW) for Asia and the Pacific was estimated at around 870 million tonnes in 2014 to 1.4 billion tonnes a year by An average generation rate of 1.4 kilograms per person per day, PRC accounting for 43% of the world total (2014) to 1.6 kilograms per person per day (2030) 3. The proportion of plastic, is around 8 12% across all the countries 4. Average plastic waste generation in the region is expected to reach 140 million tonnes by Majority of plastic waste, which comes mixed with solid waste ranges from 0.02 to 0.04 tonnes per capita per year 6. Strong correlation, which exists between per capita waste generation and the income level of a country 7. The higher the per capita GNI (gross national income), the higher is the per capita MSW generation
16 Plastic Waste Management (Asia Pacific) Contd. PRC Countries 1. PRC 2. India 3. Bangladesh 4. Pakistan 5. Indonesia 6. The Philippines 7. Vietnam 8. Thailand 9. Sri Lanka 10. Malaysia 11. Myanmar Plastic Consumption per capita ( ) 8. Waste collection rates are moderate (40 80%) in developing countries, 100% in more developed economies ( Japan, Australia, Republic of Korea and Singapore) 9. Waste separation at source is a common practice in more developed countries while in low- and middle-income countries (informal waste separation) 10. About 55 to 74% of the municipal solid waste is disposed off at disposal sites with zero to 26% being incinerated and 1 to 5% composted 11. Recycling rates in high-income countries have increased progressively over the past 30 years, while in lower-income countries the informal sector often only achieves recycling rates of 20 30% for municipal solid waste 12. Globally, around 14%-18% of waste plastics generation is collected for recycling, 24% is thermally treated (e.g. by incineration, gasification or pyrolysis), remainder is disposed off in controlled, landfill, uncontrolled landfill, or the natural environment. Plastic recycling rate (all types) in the region is low, majority packaging waste (PET, PP, PE)

17 3 Rs Approach to Achieve Plastic Consumption Circularity per capita ( ) Countries PRC 1. PRC 2. India 3. Bangladesh 4. Pakistan 5. Indonesia 6. The Philippines 7. Vietnam 8. Thailand 9. Sri Lanka 10. Malaysia 11. Myanmar Ha Noi 3R Declaration which proposed 33 goals and their indicators to monitor the progress of implementat ion of each goal in Asia and the Pacific region For Source: IGES/ MoEJ, Japan
18 Key Take Away Countries 1. PRC Plastic Consumption per capita ( ) 1. Further, countries in2. India the region with eleven major countries, 3. Bangladesh the major generators 4. Pakistan of plastics waste with poor recycling 5. Indonesia rates 6. The PRC (< 15 %), lack of waste treatment & disposal Philippines infrastructure (open7. dumping) Vietnam are putting pressure on climate 8. Thailand (open burning GHG 9. Sri emissions) Lanka & marine ecosystem in the 10. Malaysia region. 11. Myanmar 2. Progress achieved in implementing 3R efforts (Policy, Regulation, Treatment & Disposal Options) in Asia & the Pacific region is addressing the pollution due to plastic waste in the region. ( Need updates on baseline data on MSW & plastic waste specifically in reference to point number 2)
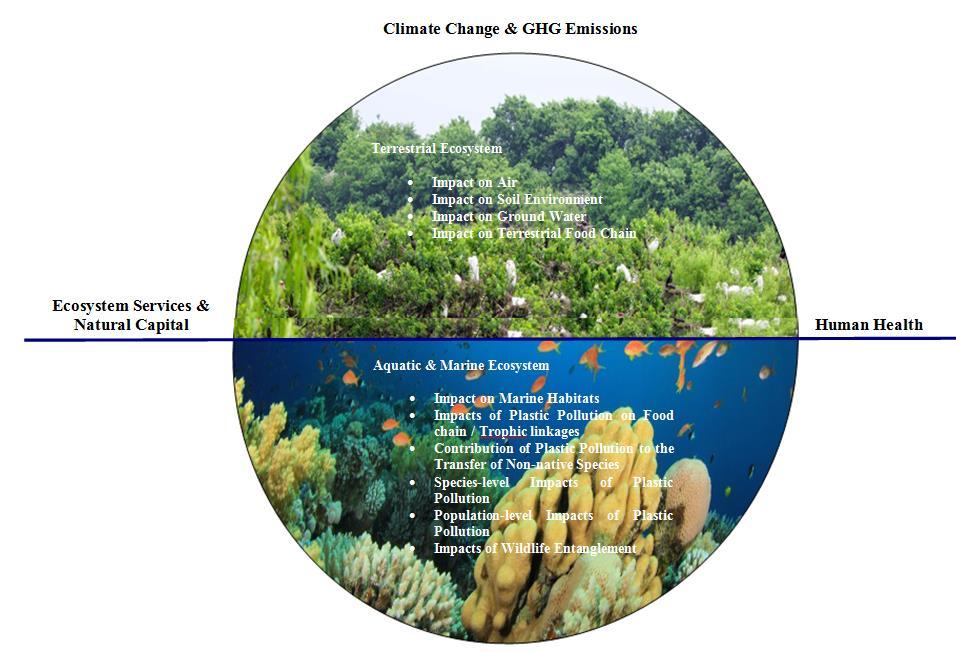
19 Chapter 4: Plastic Pollution and Its Impact 4.0: Introduction 4.1: Composition of Plastics & their Application 4.2: Key Pressures of Plastic Waste 4.2.1Impacts on Terrestrial Ecosystem 4.2.2Impacts on Aquatic & Marine Ecosystem 4.2.3Impacts on Human Health 4.2.4Other Health Impacts 4.3: Impacts on Climate Change, Energy Production & Consumption and Ecosystem Services & Natural Capital 4.3.1Energy Production & Consumption & GHG Emissions 4.3.2Impacts on Ecosystem services and natural capital 4.4: Overall Implications for Asia & the Pacific Region
 Journey of Plastics Marine Ecosystem 242,000 km of")
20 Impacts on Terrestrial Ecosystem Terrestrial Ecosystem (Air, soil, land, Ground/Surface Water, Aquatic, Flora, Fauna) Journey of Plastics Marine Ecosystem 242,000 km of coastline


21 Impacts on Aquatic & Marine Ecosystem
22 Impacts Plastic Consumption per capita ( ) 1. Impacts on Terrestrial PRC Ecosystem 2. Impacts on Aquatic & Marine Ecosystem 3. Health Impacts 4. Climate Change 5. Socio economic impacts
; Country Cluster Plastics Resin Production and Consumption in 63 Countries Worldwide (2009-2020) / IRPC Public Company Limited (18 th November 2016);")
23 Estimated GHG Emissions & Energy Consumption during Plastic Production, Relative Energy Intensity of Virgin and Recycled Plastics Production & Climate Change Impacts of Different End-of-Life Options vs Recycling for Plastics Source: EUROMAP (2016); Country Cluster Plastics Resin Production and Consumption in 63 Countries Worldwide ( ) / IRPC Public Company Limited (18 th November 2016); Presentation, 3Q/2016 Opportunity Day/ Michaud, Farrant and Jan (2010[19]), Environmental benefits of recycling, WRAP,
24 Key Environmental Impacts
25 Key Take Away Countries 1. PRC 2. India 3. Bangladesh 4. Pakistan 5. Indonesia 6. The Philippines 7. Vietnam 8. Thailand 9. Sri Lanka 10. Malaysia 11. Myanmar Plastic Consumption per capita ( ) 1. Though impact of plastic pollution on air, water, soil, freshwater, health, aquatic & marine ecosystem & climate PRC change is well recognized in the region, its quantification with respect to baseline is required at city, national and regional level to identify interventions related to technologies & mitigation and management strategies. 2. Further, in view of the significant income differences (coastal Vs. mainland) population, socio-economic impacts need to be assessed and addressed in the region. e.g. Coastal tourism a subset of cultural services in the natural capital is also affected as tourists seek to avoid beaches known to have high concentrations of plastics litter. Asia-Pacific Economic Cooperation (APEC) forum estimates that the cost of ocean plastics to the tourism, fishing and shipping industries is US$ 1.3 billion in the region alone.
26 Chapter 5: Major Policy Initiative & Responses 5.0 Introduction 5.1 Environmental Laws & Regulations 5.2 Bans & Restriction for Regulatory Plastic Bags 5.3 Market Based Instruments for Regulating Plastic Bags 5.3.1Return, Collection, Recycling and Disposal of plastic 5.4 Bans and Restrictions for Single Use Plastics 5.5 Market Based Instruments (MBI) for Single Use Plastics 5.5.1Market Based Instruments Upstream of Consumption 5.5.2Market Based Instruments Downstream of Consumption 5.6 Microbeads 5.7 Multilateral Environmental Agreements 5.8 Technological Interventions 5.9 Institutional Roles & Actions
27 Summary of Regulations 1. Regulations on SWM in the region 2. Ban & restrictions on plastic bags & single use plastic 3. Market Based Instruments for Regulating Plastic Bags & single use plastic 4. Market based instruments on return, collection, recycling and disposal of plastic bags & single use plastic 5. Ban & restrictions on microbeads 6. Voluntary initiatives on microbeads
28 Key Take Away Countries 1. PRC 2. India 3. Bangladesh 4. Pakistan 5. Indonesia 6. The PRC plastic waste across Philippines all the countries in the 7. Vietnam 8. Thailand 9. Sri Lanka 10. Malaysia 11. Myanmar Plastic Consumption per capita ( ) 1. Formulation of regulations to address region is the priority 2. Implementation of regulation with close coordination of institutions and major stakeholders including private sector will address the major issue of plastic waste
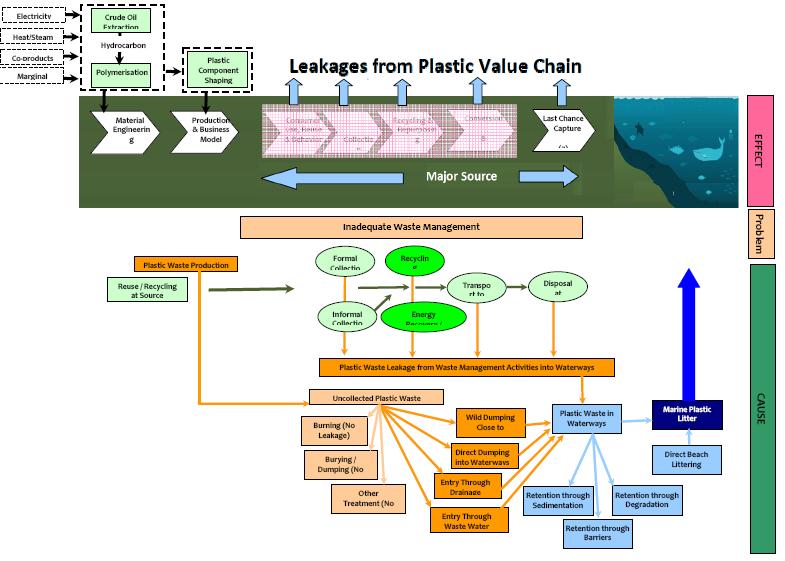
29 Chapter 6: Way Forward 6.0 Introduction 6.1 Summary of Results under DPSIR Framework 6.2 Barriers & Gaps and Potential Interventions 6.3 Plastic Economy Vs. Circular Economy
30 Asia and the Pacific, summary of drivers, pressures, state and trends, and impacts
31 Major Challenges/ Enablers / Way Countries 1. PRC 2. India 3. Bangladesh 4. Pakistan 5. Indonesia 6. The Forward 1. Policy & Regulatory ( Linear Vs. Circularity, 3Rs, Coverage, Type of PRC intervention e.g. ban on Philippines items such as single use, ban from 7. Vietnam 8. Thailand 9. Sri Lanka 10. Malaysia 11. Myanmar landfill, statutory targets for recycling rate, EPR etc.) 2. Economic instrument e.g. resource tax, 3. Technology ( Recycling Vs. WtE, Waste plastic sorting, technology for recycling mixed plastics, Thermosets, Alternate materials ) 4. Knowledgebase, Data & Information ( Baseline data across region; Impacts assessments across terrestrial, aquatic, marine ecosystem, health & socio economics; Human resources/ experts; Indicator monitoring; Capacity building; Sharing of best practices 5. Voluntary measures ( Industry led market transforming interventions/ projects, better labeling and declarations on packaging, sustainability reporting SDG 12, 14)

32 lastic Economy to Circular Economy & SDGs PRC From Current Plastic Economy Circular Economy Five SDGs (SDG 6, 11, 12, 14 and 15) are relevant to reducing the inputs and impacts of waste plastic on terrestrial & marine ecosystem. Coverage: sustainable management of water and sanitation; sustainable consumption and production; inclusive, safe, resilient and sustainable use of terrestrial & marine ecosystem while ensuring their protection, restoration & conservation.
33 Plastic Economy to Circular Economy Plastic Consumption per capita ( ) Countries 1. PRC 2. India 3. Bangladesh 4. Pakistan 5. Indonesia 6. The Philippines 7. Vietnam 8. Thailand 9. Sri Lanka 10. Malaysia & SDGs (12 & 14) contd.. 1. SDG target 12.4 clearly states that By 2020, achieve the PRC environmentally sound management of chemicals and all wastes throughout their life cycle, in accordance with agreed international frameworks, and significantly reduce their release to air, water and soil 11. Myanmar in order to minimize their adverse impacts on human health and the environment 2. SDG target 12.5 clearly aims at, By 2030, substantially reduce waste generation through prevention, reduction, recycling and reuse. 3. SDG Target14.1 is one of the most important and aims By 2025, prevent and significantly reduce marine pollution of all kinds, in particular from land-based activities, including marine debris and nutrient pollution.
34 THANK YOU / amit@irgssa.com