Measuring and Monitoring a Lack of Resilience, and Informing Resilience Operations
|
|
|
- Roger Griffin
- 5 years ago
- Views:
Transcription
1 Measuring and Monitoring a Lack of Resilience, and Informing Resilience Operations Using existing, often emergency-oriented tools and data, in a slightly different manner, to measure long-standing, underlying, conditions, problems and opportunities FEWS NET and USGS
2 Focus on: products already identified for Rise and Water, Agriculture, Markets, Climate Change
3 Some of the indicators and types of information available for resilience monitoring, measurement, impact evaluation, etc. Acute food insecurity Agricultural areas Agric. drought impacts Agric. production Climate changes at local level Crop condition and yield Evapo-transpiration (actual) Food price drivers Food prices Humanitarian needs Livelihood zones Malnutrition causes Market and trade flows Pastoral areas Pastoral water points Population distribution Rainfall Rainfall drought Seasonal livelihood calendars Vegetation cover Water availability (1 km) Water table assessment Water use patterns Weather patterns
4 What do you want to know? What do you want to measure? Acute food insecurity Agricultural areas Agric. drought impacts Agric. production Climate changes at local level Crop condition and yield Drought detection Evapo-transpiration (actual) Food price drivers Food prices Amount of it at period X Where is it found? Comparison between places Difference over time Trend over time Use them to construct questions and provide answers Variability over time Per capita

5 GIS FOR MONITORING AND EVALUATION: Mapping landscapes and conservation practices for the Sahel Resilience Program Niamey, March 19th, 2014 Gray Tappan U.S. Department of the Interior U.S. Geological Survey

6 Mapping and Tracking Land Uses and Management Practices to support the Sahel Resilience Program Provide the Sahel Resilience Program with new maps in unprecedented detail Help USAID and partners geographically target aid investments Monitor and evaluate the effectiveness and impacts of the Program 6
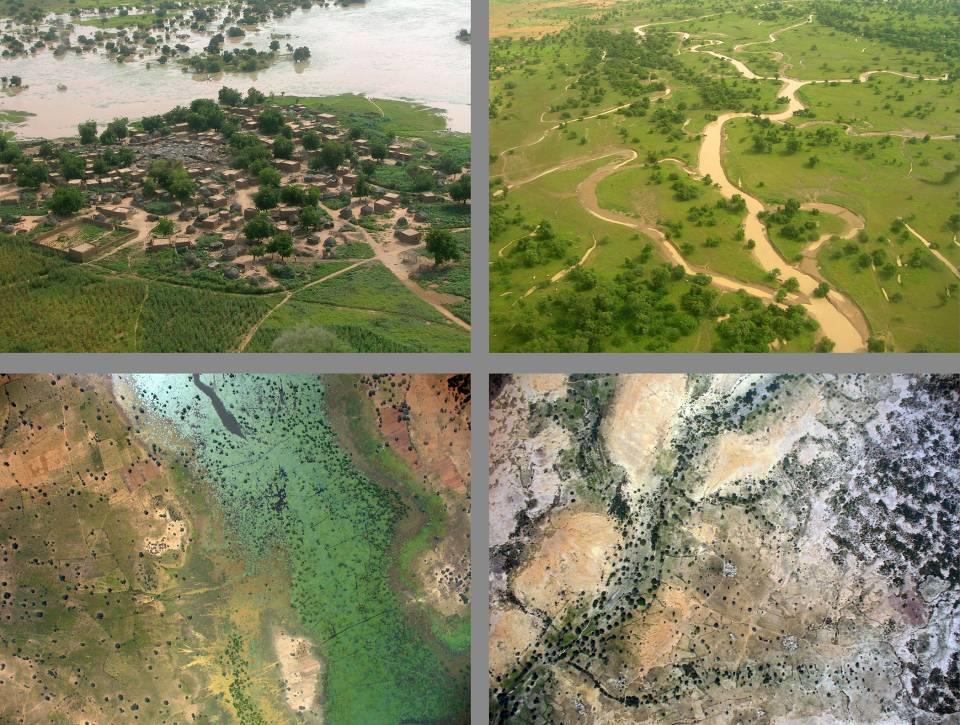
7 7


8 Capturing local perspectives on practices and the environment through focus group discussions and social science tools 8


9 Soil, Water, and Vegetation Conservation Produce maps of various conservation practices Examples of practices used by farmers include: zaï rock lines filtration dikes

10 Natural regeneration along rock lines, near Gourcy,


11 1955 Time-series images for monitoring increases in on-farm trees: southwest of Zinder

12 Regreening: Increased agricultural productivity and resilience through better management of soils, water and vegetation On-Farm Forestry 5,000,000 ha in Niger Over 450,000 ha in Mali Rainfall capture technologies: Burkina Faso 150,000 ha Niger 200,000 ha Mali 100,000 ha Better management turned low-potential land into high-potential land 12


13 Maps at the commune level for land use planning, targeting interventions and Conventions locales Administrative Boundaries and Roads Main roads of Tondikande High resolution imagery 13


14 Generalized example of output map Suitability to Zaï based on soil and land cover Map from F. Landsberg (WRI) in collaboration with USGS/EROS. 14
15 And at the commune level Potential risk of erosion in the commune of Tondikande 15

16 Mapping and Tracking Land Uses and Management Practices Provide the Sahel Resilience Program with new maps in unprecedented detail 3 MONTH DELIVERABLES SMALL SCALE 1 YEAR DELIVERABLES LARGER SCALE Landsat Image-map Digital Elevation Map Small scale analysis based on medium resolution satellite images Land Cover Map Soils Map Soil, Water, Vegetation Conservation Practices map Land Productivity Map (NDVI) Commune maps for targeting and planning, Conventions locales Land Cover Map more detailed Soil, Water, Vegetation Conservation Practices map more detailed Human Settlements Map Commune maps for targeting and planning, Conventions locales Larger scale analysis based on medium and high resolution images, and field work Report with resource assessments, target areas, recommendations Report with resource assessments, target areas, recommendations 16


17 Analyze & monitor water availability in Africa 100 m Eta, Vaalwarts, So. Africa Land-Surface Models Noah, VIC, WRSI MODIS Land Cover MODIS LAI FEWS NET Crops GDAS/MERRA + CHIRPS

18 18


 averaged over the region.")
19 Utilize GRACE Terrestrial Water Storage to characterize nonmodeled changes in water availability (e.g., groundwater) following methods described in Rodell et al., Nature, GRACE is unique among Earth observing missions in its ability to monitor variations in all water stored on land, down to the deepest aquifers. The water table is declining at an average rate of 33 cm/yr Trends in groundwater storage during , with increases in blue and decreases in red. The study region is outlined. Time series of total water from GRACE, simulated soil water, and estimated groundwater, as equivalent layers of water (cm) averaged over the region. The mean rate of groundwater depletion is 4 cm/yr. Inset: Seasonal cycle. During the study period, , 109 km 3 of groundwater was lost from the states of Rajasthan, Punjab, and Haryana; triple the capacity of Lake Mead Figure from: Matthew.Rodell@nasa.gov

20 Operational Waterhole Monitoring activity for the greater Sahel
 the impact of agricultural")


21 Quantifying (and mitigating?) the impact of agricultural droughts 2013 Vs 2012 To understand resilience activity results, it may be necessary to quantify, normalize and compare the severity of successive droughts

.")
22 Results Summary Below: Removing national results oneby-one using high correlation factors (FAS, ETa15th, %YieldChange), showed that Lesotho results substantially weakened the relationship between yield change and all of the drought imagery. Above: the highest correlations were found using FAS-based change in yield from average yield, with ETa 30 th percentile expressed in terms of % of total ag hectarage affected by drought (-.536). The weakest used FAO stats, WRSI and number of hectares affected by drought (.027).
23 International market and global food prices: what impact in the hungry world? A global index?
24 < Number of cases 6 Sahel w/nga: Average Monthly Price Change Percentage What are normal food market price patterns in the Sahel? ,500 3,000 2,500 2,000 1,500 1, Jan Feb Mar Apr May Jun Jul Aug Sep Oct Nov Dec Percentage Change Sahel w/nga: Distribution of Monthly Price Changes (Grain markets, , in %) n = 20,903 0 Month-on-Month Price Change Percentage Number of cases for each price change class
25 Jan-02 May-02 Sep-02 Jan-03 May-03 Sep-03 Jan-04 May-04 Sep-04 Jan-05 May-05 Sep-05 Jan-06 May-06 Sep-06 Jan-07 May-07 Sep-07 Jan-08 May-08 Sep-08 Jan-09 May-09 Sep-09 Jan-10 May-10 Sep-10 Jan-11 May-11 Sep-11 Jan-12 May-12 Sep-12 Percentage pf Mkts w/ > +2SD increase What is an unusual market price increase? 10 Sahel w/nga: Severe Acute Mo. Price Increases (cereals only, increase > +2SD of reg'l SD) Month-on-Month Increase > +2SD
 or global drivers?")
26 Are food market prices in specific markets being driven by local (e.g. drought) or global drivers?

27 New understandings of what is driving global dryness and specific-area droughts More rain is produced over warmer oceans; less over land A steep temperature gradient in this location appears to lead to droughts in specific areas Adapted from Hoell, 2013

28 Projected climate changes based on trends between

29 Long-term climate trends:

30 A per capita denominator


31 2004 Extreme Flooding: Niger River at Niamey 2012