Indiana Beef Evaluation and Economics Feeding Program
|
|
|
- Marsha Cannon
- 5 years ago
- Views:
Transcription
1 Indiana Beef Evaluation and Economics Feeding Program
2 IBEEF Description IBEEF is a steer and heifer feedout program that provides Indiana producers with a way to place cattle on feed and gather performance, carcass, and economic information to make genetic and management improvements in their herd. Cooperators receive individual and group feedlot performance, feedlot costs, individual and group carcass information, including quality and yield grade, ribeye area, fat thickness, carcass weight, etc. IBEEF also allows producers to compare sires, as well as evaluate alternative marketing strategies and their impact upon profitability. The program also helps to improve the reputation of producer cattle by establishing a database of feedlot performance and carcass merit on their calves.
3 IBEEF Overview 36 Cooperators 503 Steers and 113 Heifers 5-81 head/cooperator Weaned at least 30 days before delivery Delivered October, 20, November 13, and December 4, 2000
4 Vaccination Requirements At weaning or 2 weeks prior: Four-way respiratory virus (IBR, BVD, PI3, and BRSV) preferably killed vaccine Seven-way clostridial vaccine Haemophilus somnus vaccine Pasturella vaccine Two weeks before delivery: Repeat four-way respiratory virus vaccine (MLV) Repeat Haemophilus somnus vaccine

5 Smoker Farms, Wanatah, IN 163 Steers
 Lewis,")
6 Tri-County Steer Carcass Futurity (TCSCF) Lewis, Iowa

7 Silver Creek Feeders Council Bluffs, Iowa 142 Steers

8 Todd Bentley, Oakland, Iowa 198 Steers

9 Brent Lorimor, Farragut, Iowa 113 Heifers
10 IBEEF Participation Sires represented: Angus, Beefmaster, Brangus, Charolais, Chiangus, Gelbvieh, Hereford, Limousin, Maine Anjou, Red Angus, Salers, Shorthorn, Simmental, Cross Color: Black/BWF 75%, Red/RWF 12%, White 2%, Smoke 4%, Gray 2%, Brown 4% 46% sired by IBEP Test Station Bulls
11 IBEEF Steer Summary Feedlot Performance Delivery Point Weight, lbs. 621 Feedlot in Weight, lbs. 601 Harvest Weight, lbs ADG 2.99 Days on Feed 185 Age at Harvest 441
12 Comparison of IBEEF Steer Carcasses and 2000 Beef Quality Audit (9396 head) IBEEF Hot Carcass Weight, lbs. 718 Rib Eye Area 12.3 Back Fat 0.40 Yield Grade 2.7 % YG 1 and % YG % Choice and Prime 63.0 BQA
13 Out Cattle (%) Reason IBEEF BQA Light Carcass (<550 lbs.) 0.7 N/A Heavy Carcass (>950 lbs.) 0.0 N/A YG 4 (Calculated) None Plant Called Standard Grade Dark Cutter Total Out Cattle
14 Yield Grade vs. Quality Grade IBEEF vs. Purdue Steers (112 Angus and Simmental Sired) IBEEF Purdue Days on Feed Hot Carcass Weight, lbs Rib Eye Area Back Fat Yield Grade % YG 1 and % YG % Choice and Prime % CAB
15 Calf Value at Delivery (Steers) Delivery Point $/cwt $/cwt Weight, lbs. Steers Heifers $97.50 $ $95.00 $ $92.50 $ $90.00 $ $87.50 $ $85.00 $ $82.50 $77.50
16 Steer Feedlot Performance (Cooperator Average) Average Range Delivery Point Weight, to 722 lbs. Initial Value at Delivery, $87.63 $82.43 to $99.10 $/cwt Feedlot In Weight, lbs to 721 Sale Weight to 1272 Days on Feed to 208 Daily Gain to 3.68
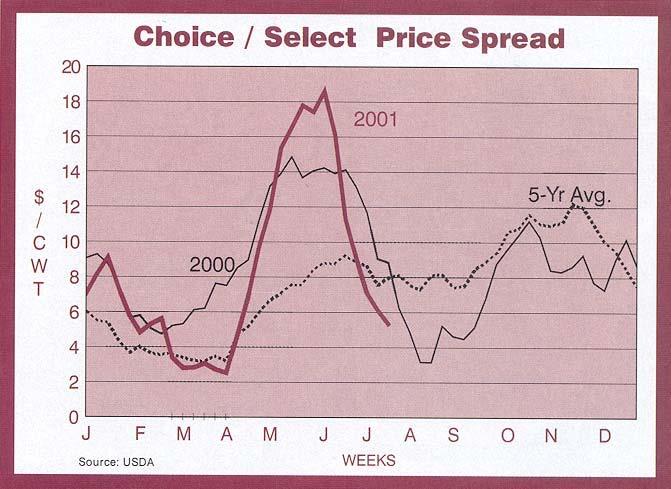
17 How Steers Were Sold Base Price and Grid IBP Joslin, IL and Denison, IA Sale Grp. Sale Date Base Price Select Discount Avg. $/cwt 1 IA 4/9 $ $4.70 $ IN 4/29 $ $4.00 $ IA 5/7 $ $9.20 $ IA 5/16 $ $11.20 $ IN 6/10 $ $17.00 $ IA 6/11 $ $16.65 $ IA 7/9 $ $11.00 $ Premiums: CAB $2.00 to $6.00, Prime $10.00, YG 1 $6.50, YG 2 $2.50 Other Discounts: YG 4, light, and heavy carcass -$15.00 to -$20.00
18
19
20 Steer Carcass Information (Cooperator Average) Average Range Carcass Weight to 844 Dressing % to 66.4 REA to 14.9 REA/cwt carcass to 1.96 Backfat to 0.59 Yield Grade to 3.2 % Choice or Prime to 100 Sale Price, $/cwt $ $ to $ Sale Value/Hd. $ $ to $1,046.19
21 Steer Feeding Cost (Cooperator Average) Avg. Range Feed $ $ to $ Medication $5.15 $0.00 to $31.54 Yardage $48.92 $44.20 to $55.55 Misc. (processing, $31.72 $28.19 to $35.87 trucking, data collection) Total $ $ to $309.71
22 The Bottom Line - Steers (Cooperator Average) Average Range Feed Cost of Gain, $34.11 $30.14 to $38.29 $/cwt Nonfeed Cost of Gain, $15.43 $12.48 to $21.76 $/cwt Total Cost of Gain, $49.54 $43.32 to $58.97 $/cwt Profit/Head $ $46.74 to $ Break Even Feeder Calf $98.19 $81.11 to $ Value, $/cwt
23 Breakeven Feeder Calf Value Calculation: (Harvest Sale Value Feedlot Costs) Calf Weight at Delivery Harvest Sale Value = 729 lbs. x $120.91/cwt = $ Feedlot Costs = $ Net = $ $ = $ Calf Weight at Delivery = 619 lbs. Breakeven Calf Value = $607.80/619 lbs. = $98.19/cwt
24 Profit Groups Based on initial assigned feeder calf value at delivery, feeding costs, and harvest sale value, cattle were divided into profit group quartiles (123 steers/group) Profit = Sale Value Feedlot Costs Calf Value Example: Profit = $ $ $ = $58.69
25 Steer Profit Groups Profit No. Profit Break Even Feeder Group Steers $/Hd. Calf Value, $/cwt $ $ $82.58 $ $34.10 $ $36.52 $82.14 Average 492 $58.69 $97.28
26 Differences Between High and Low Profit Groups Feedlot Performance High vs. Low Delivery Point Weight, lbs. 632 vs. 614 Start Weight, lbs. 618 vs. 591 % Shrink (delivery-feedlot) 2.22 vs Final Weight, lbs vs Feedlot Daily Gain 3.29 vs Medication Cost $1.43 vs. $8.73 Total Feedlot Cost $ vs. $ Cost of Gain, $/cwt $46.71 vs. $53.57
27 Impact of Health on Feedlot Profit of Steers and Heifers 1 Avg. Cost/hd Profit Group % Treated Treated $ $ $ $ head on feed
28 Variability of Cattle Health Status Among Cooperators No. Cattle % Treated % Cooperators Represented (23%) (57%) (13%) (3%) (3%)
29 Differences Between High and Low Profit Groups Carcass Characteristics High vs. Low Ribeye Area, in vs Backfat, in vs % Yield Grade vs. 0.8 % Yield Grade 1 and vs % Choice or Prime 87.8 vs Carcass Price, $/cwt $ vs. $114.41
30 % of Steers in Each Category Which are in the 4 Profit Groups No. Profit Group Category Steers Breed of Sire Angus Charolais Chiangus Gelbvieh Hereford Other Breeds Shorthorn Simmental Other Breeds = Breeds with fewer than 10 steers. Includes Beefmaster (1 steer), Brangus (3), Cross (2), Limousin (6), Maine Anjou (4), Red Angus (1), and Salers (8).
31 % of Steers in Each Category Which are in the 4 Profit Groups No. Profit Group Category Steers Color Black Other IBEP Bull Yes No Delivery Date 10/ / /
32 % of Steers in Each Sale Group Which are in the 4 Profit Groups No. Profit Group Category Steers Sale Group 1 IA 4/ IN 4/ IA 5/ IA 5/ IN 6/ IA 6/ IA 7/
33 IBEEF Heifer Summary Feedlot Performance Delivery Point Weight, lbs. 579 Feedlot in Weight, lbs. 570 Harvest Weight, lbs ADG 2.60 Days on Feed 199 Age at Harvest 450
34 IBEEF Heifer Summary Carcass Characteristics Days on Feed 199 Hot Carcass Weight, lbs. 665 Rib Eye Area 12.2 Back Fat 0.50 Yield Grade 2.8 % YG 1 and % YG % Choice and Prime 70.4 % CAB 26.9
35 Heifer Feedlot Performance (Cooperator Average) Avg. Range Delivery Point Weight, to 675 lbs. Initial Value at Delivery, $85.38 $80.00 to $91.66 $/cwt Feedlot In Weight, lbs to 666 Sale Weight to 1209 Days on Feed to 245 Daily Gain to 3.07
36 How Heifers Were Sold Base Price and Grid IBP, Denison, IA Sale Grp. Sale Date Base Price Select Discount Avg. $/cwt 1 IA 5/7 $ $9.20 $ IA 5/16 $ $11.20 $ IA 6/11 $ $16.65 $ IA 7/9 $ $11.00 $ Premiums: CAB $3.50 to $6.00, Prime $10.00, YG 1 $6.50, YG 2 $2.50 Other Discounts: YG 4, light, and heavy carcass -$15.00 to -$25.00
37 Heifer Carcass Information (Cooperator Average) Avg. Range Carcass Weight to 774 Dressing % to 64.0 REA to 13.9 REA/cwt carcass to 1.95 Backfat to 0.65 Yield Grade to 3.4 % Choice or Prime to 100 Sale Value/Hd. $ $ to $978.10
38 Heifer Feeding Cost (Cooperator Average) Avg. Range Feed $ $ to $ Medication $6.89 $0.00 to $45.41 Yardage $52.76 $46.19 to $62.00 Misc. (processing, $32.09 $31.38 to $32.83 trucking, data collection) Total $ $ to $324.78
39 The Bottom Line - Heifers (Cooperator Average) Avg. Range Feed Cost of Gain, $33.36 $28.73 to $37.66 $/cwt Nonfeed Cost of Gain, $17.52 $13.69 to $22.13 $/cwt Total Cost of Gain, $50.88 $42.42 to $58.18 $/cwt Profit/Head $ $20.33 to $ Break Even Feeder Calf $96.27 $78.94 to $ Value, $/cwt
40 Heifer Profit Groups Profit No. Profit Break Even Feeder Group Heifers Avg/Hd. Calf Value, $/cwt 1 27 $ $ $94.54 $ $37.34 $ $69.33 $72.72 Avg. 108 $52.40 $94.08
41 Differences Between High and Low Profit Groups Heifer Feedlot Performance Delivery Point Weight, lbs. 594 vs. 579 Start Weight, lbs. 591 vs. 567 % Shrink (delivery-feedlot) 0.55 vs Final Weight, lbs vs Feedlot Daily Gain 2.88 vs Medication Cost $0.00 vs. $8.86 Total Feedlot Cost $ vs. $ Cost of Gain, $/cwt $47.58 vs. $57.30
42 Differences Between High and Low Profit Groups Heifer Carcass Characteristics Ribeye Area, in vs Backfat, in vs % Yield Grade vs. 0.0 % Yield Grade 1 and vs % Choice or Prime 96.3 vs Carcass Price, $/cwt $ vs. $107.39
43 % of Heifers of Each Sire Breed Which are in the 4 Profit Groups No. Profit Group Category Heifers Breed of Sire Angus Other Breeds Other Breeds = Breeds with fewer than 10 heifers. Includes Chiangus (6 heifers), Cross (2), Gelbvieh (3), Hereford (3), Limousin (4), Maine Anjou (2), and Simmental (4).
44 % of Heifers in Each Category Which are in the 4 Profit Groups No. Profit Group Category Heifers Color Black Other IBEP Bull Yes No Delivery Date 10/ / /
45 % of Heifers in Each Sale Group Which are in the 4 Profit Groups No. Profit Group Category Heifers Sale Group 3 IA 5/ IA 5/ IA 6/ IA 7/
46 Factors That Affect Profitability Health Feedlot Daily Gain Harvest Weight Quality Grade Yield Grade
47 IBEEF Participation Data Information Knowledge Action
48 For more information about IBEEF: Kern Hendrix, Purdue University (AnSc) Byron Fagg, Purdue CES Washington County Extension Educator

49