Earth Observation in support for project identification/preparation
|
|
|
- Kelly Daniels
- 5 years ago
- Views:
Transcription


1 Asian Water Forum Oct. 5th 2018 Asian Development Bank Manila, Philippines Earth Observation in support for project identification/preparation Christian Tottrup, DHI GRAS

2

3 EO4SD -> Background Water plays an essential and crosscutting role in the sustainable management of land use in particular in the context of agriculture as 70% of freshwater is used for irrigation The successful and sustainable management of water resources requires access to reliable data and information on water related issues The main objective of the EO4SD initiative is to demonstrate the benefit and utility of EO-based information in support land and water resource management in the context of international development projects and activities
4 Objective and program To demonstrate how Earth Observation can support water resource management, agriculture and international development assistance incl. the monitoring and reporting requirements of the Sustainable Development Goals Time Title Speaker EO in support for project identification/preparation Christian Tøttrup, DHI GRAS Optimize agricultural water use efficiency Remco Dost, eleaf Lunch Earth Observation for Integrated Water Resource Management and SDG monitoring Monitoring and evaluation using Earth Observation Christian Tøttrup, DHI GRAS Remco Dost, eleaf 15:00 Wrap Up and Closing Paolo Manunta, ESA
5 Progression Multi-scale/Multi-resolution applications Coarse-resolution/ Multi-factor applications for project identification, preparation > fact finding, hot-spots etc. High resolution applications in support of Agriculture, IWRM and SDG
6 Stakeholder issues Reliable and readily available information on the water cycle, related land (cover/use) processes, climatic facts and socio-demographic developments are fundamental for improving water policies, management and governance effectively The lacking capacity to perform rapid assessments of water-relevant issues and facts is identified as a critical gap for project interventions on the ground: Interventions may often occur with out sufficient knowledge of the spatial context i.e. where is the issues most apparent -> hot-spot identification Even when hot-spots are known availability of an unbiased screening tool can be useful for closing out arguments Project justification may also be supported by assessing the potential for scaling up


7 EO demonstrations Provide information and analysis for identification, analysis and reporting of challenges and facts from regional to national level Irrigation suitability Watershed Vulnerability
8 Groundwater potential, Sahel
 Crop mapping and monitoring Surface Water Monitoring Irrigation management Groundwater")
9 Sahel Irrigation Initiative Support Project Objective To improve stakeholders' capacity to develop and manage irrigation and to increase irrigated areas, including strengthening of IWRM in all countries and the development of an integrated M&E system Information needs: (Irrigated) Crop mapping and monitoring Surface Water Monitoring Irrigation management Groundwater potential
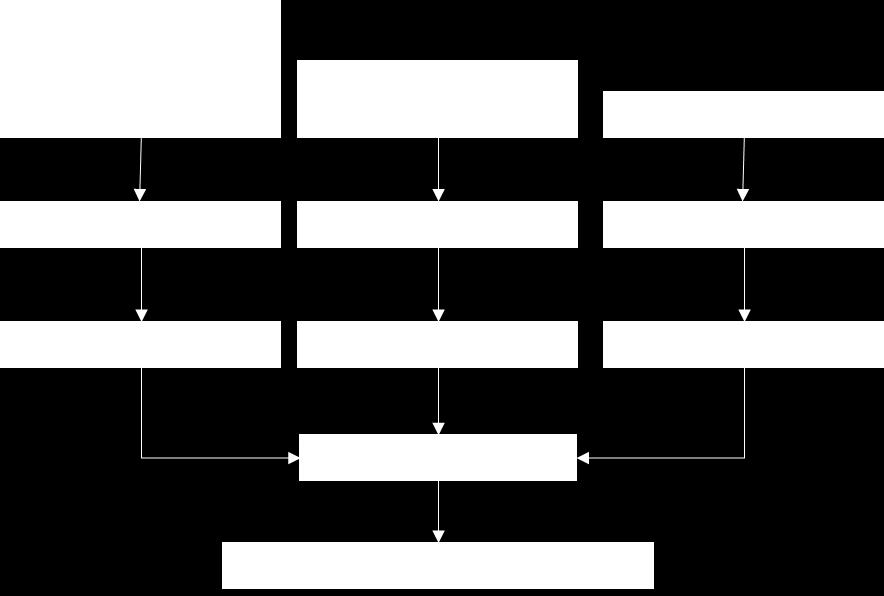
10 Groundwater potential for irrigation Factors that affect the suitability of an area for groundwater irrigation potential include biophysical (e.g., climate, soil characteristics, land use type, and topography) and socio-economic (e.g., market access such as proximity to a road and population density) EO based composite mapping analysis GW potential based on biophysical (P) and socio-economic (H) input layers
11 Hydrogeological potential A very important determining factor in groundwater (non )availability is the capacity of the subsurface, or the aquifers, to produce water Here, this is determined from a combination of recharge potential (R) and the inherent aquifer productivity (A) Hydrogeological potential
12 Recharge potential Recharge occurs in a distributed sense due to direct infiltration from net rainfall and influenced by vegetation cover, topography, and soil properties
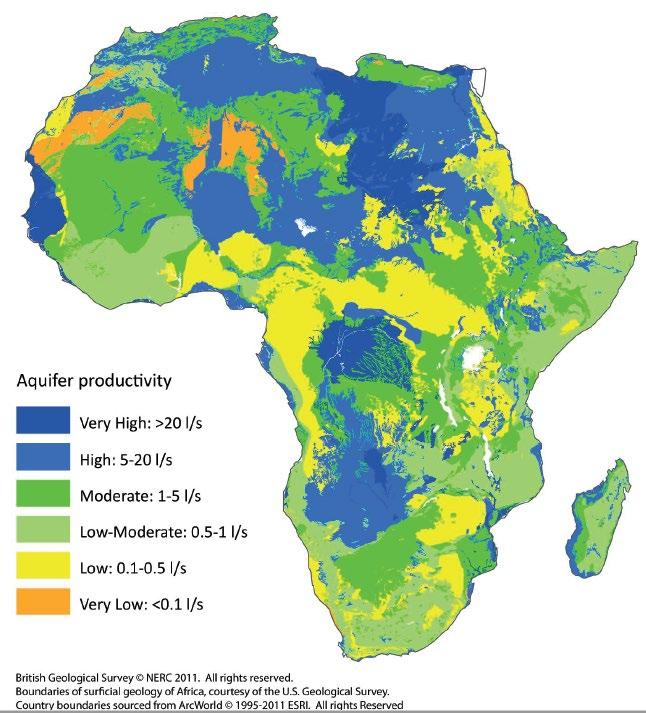

13 Aquifer productivity British Geological Survey

14 Hydrogeological potential Hydrogeological potential
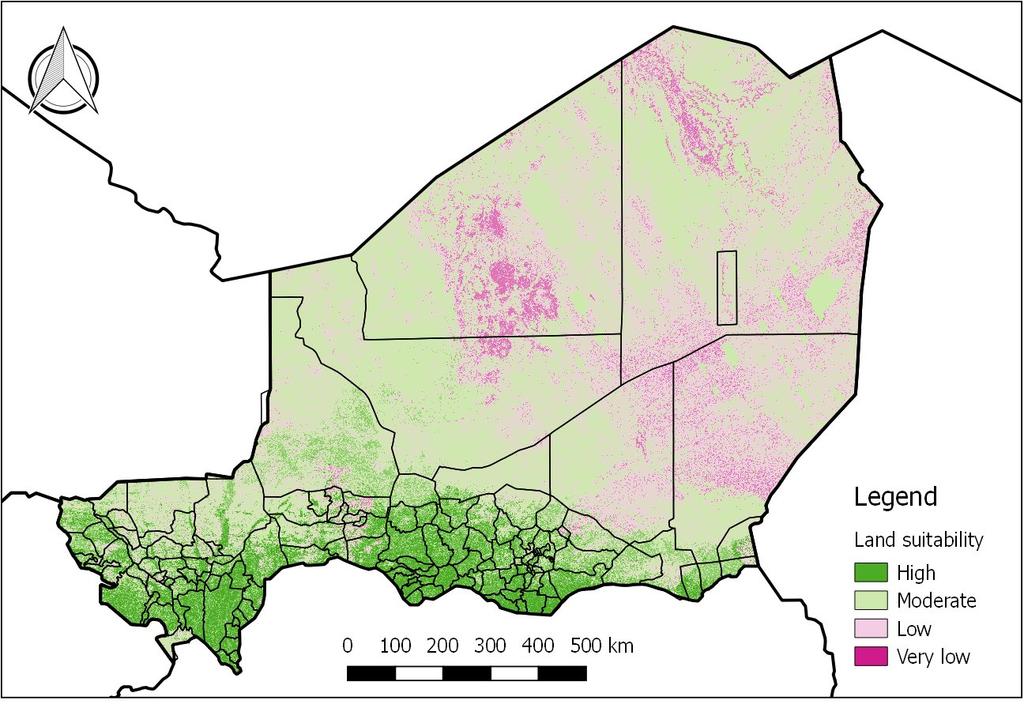
15 Land suitability
16 Hydrogeological potential 24 out 25 of SIIP sites have a score of 1 and 2 i.e. very high to high potential
17 Roll-out results with more factors Theoretical potential -> Bio-physical factors only Practical potential -> Include socio-demographic factors as well Population distribution Infrastructure Conservation areas Hydro-geo. potential Other constraints Practical potential

18 Groundwater potential A first line assessment tool for groundwater development (Source: DHI GRAS/EO4SD)
19 Impacts and benefits Benefits A cost-effective first-line assessment tool to give decision makers and practioners a good initial indicator of where to focus further investigations Impacts Serve as input for the political discourse on ground water exploration Cells that show higher (Physical) Groundwater potential could be potential areas where to focus the efforts on groundwater development, and vice versa
20 Watershed vulnerability, Lao PDR

21 Sustainable Rural Infrastructure and Watershed Management Project (Lao PDR) Sustainable rural development is a major challenge for Lao PDR and agriculture is expected to contribute substantially to economic growth over the next decade Watershed health is critical for agricultural production Deforestation, Watershed degradation and effects of climate change will lead to an increase in hydro-meteorological driven damage and destruction Need for EO services to better understand the bio-physical risks and their spatial distribution -> The project needs to know which watersheds are prone to degradation and where investments in PRI should be prioritized
22 Integrated Climate and Watershed Vulnerability Analysis Content Provide a large area climate and watershed vulnerability analysis to support planning and prioritization of watershed development (e.g. irrigation) at the national/regional level Geographic coverage Northern and Central parts of Lao PDR Temporal resolution Most recent Spatial resolution Blend (30 m -> 5 km) Input (EO) data Multiple Earth Observation data sources providing information on rainfall, topography, land cover and vegetation changes
23 Method


24 Soil erosion

 -significant NDVI trend (0.")
25 Vegetation index trend analysis MODIS NDVI time series analyses Weighted mapping land clearance number (0.5) -significant NDVI trend (0.25) -Hansen tree loss map (0.25)
 and change (0.5)")
26 Rainfall timeseries Identify watersheds susceptible to extreme rainfall events The Standardized Precipitation Index (SPI) is a widely used index to characterize unusually wet and dry conditions Indicator: 6-month SPI -status: count of dry/wet anomaly -change: trend of annual dry/wet anomaly count Weighted mapping from status (0.5) and change (0.5)
 First-line assessment tool for obtaining")

27 Watershed vulnerability: (soil erosion + vegetation change + rainfall extremes) First-line assessment tool for obtaining a national overview and as an initial indicator for interventions and investments in PRI to improve agriculture efficiency

28 Previous Case Studies Vulnerability mapping of Cape Verde in order to identify (i) erosion risk areas; (ii) location of drought prone areas and (iii) their interaction with extent of irrigation. used to target interventions by identifying vulnerable islands 2 out of 10 was selected objective and transparent decision process!
29 Flood & Drought portal - demonstration

30 Flood & Drought Management portal Supporting technical activities within flood and drought planning in transboundary basins where base data is often lacking Data availability is a key issue in planning Data availability is a key concern in many countries and basins Availability of a basic set of data for planning is critical Satellite data should be used to support available station data

31 How can Remote sensing data be used? Why use RS data? Global or regional coverage Free data available Almost available in real time Many data sets available for the last 10 to 15 years Why are RS data not used more often? Difficult to identify the data source to use Different providers and data locations Strange data formats Difficult to analyse and use the data

32 Web portal enabling access to basic data set for planning
 Vegetation and soil moisture NDVI Soil Water Index Lakes and reservoirs")
33 Technical overview - Data Climate data: TRMM, CHIRPS, CRU, GPM rainfall Temperature and PET Forecast and climate change Seasonal and 2-week forecast Climate change (CORDEX) Vegetation and soil moisture NDVI Soil Water Index Lakes and reservoirs JASON data


34 Technical overview - Indices Indices are essential for linking data with assessment Index How are the current values compared to the historical values? Expressed as a deviation, anomaly, percentile etc. Satellite data A number of different indices are maintained. Classification


35 Summary Daily update of relevant satellite based data sources Calculation of relevant drought indices Indices available through web based drought portal Identify location and severity of drought hazard based on drought indices Daily update Download QA Daily update Download on global scale QA of data quality Data processing Calculate indices QA and monitor process Push to web-server

36 Your turn -> How to Access Open the Flood and Drought portal through: and log in: Username: fduser1, fduser2,..., fduser15 Password: dhigras
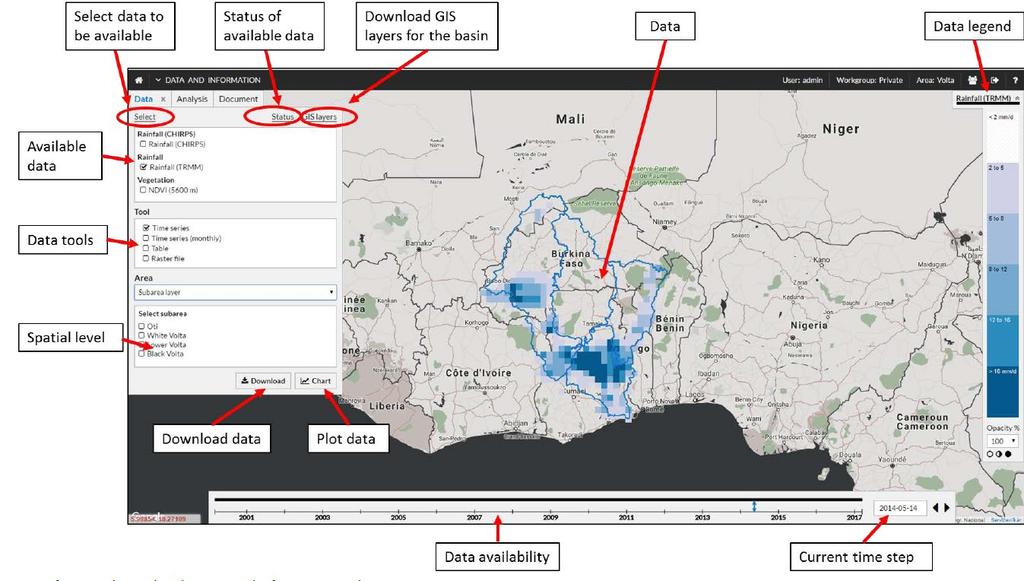
37 Basic functionality
38 Use case examples - Myanmar Flood in Mon region, July 2017 Drought in Magway region, Effective Flood Index (EFI) 2. Time series > no-flood risk > flood risk 1. Effective Drought Index (EDI) 2. Column chart 3. Subarea layer -> Magway 4. Chart 5. Zoom chart 2014

39 More information Christian Tottrup